With the GOP convention now in the electoral rearview mirror, attention is pivoting quickly from Ohio to Pennsylvania as the Democrats kick off their own nominating convention in Philadelphia.
Although it has voted Democratic in the last six presidential elections, political analysts have historically regarded the Keystone State as a swing state. FiveThirtyEight’s latest general election forecast projects a 46 percent vote share for Hillary Clinton, versus just under 44 percent for Donald Trump, making it the sixth-most competitive state. Pennsylvania also features what is shaping up to be a tight Senate race between incumbent Republican Pat Toomey and Democratic nominee Katie McGinty. Thus, it is useful to see how the state’s voters might view the condition of the economy, which could very well influence turnout levels and candidate preferences amid close contests this November.
Pennsylvania’s metropolitan economy
The economic perspectives of Pennsylvanians are perhaps best understood through the prism of the state’s highly distinctive major metropolitan areas. Five large metro areas span the state—Allentown, Harrisburg, Philadelphia, Pittsburgh, and Scranton—and together account for 63 percent of Pennsylvania’s population and 75 percent of its GDP. Their economic specializations are diverse: trade, transportation, and manufacturing in Allentown and Scranton; financial, professional, and educational services in Philadelphia and Pittsburgh; and government in the state capital of Harrisburg. While much political news coverage of Pennsylvania is likely to focus on its iconic small towns, it is really these large metro areas that define the state demographically and economically.
A slow recovery for most
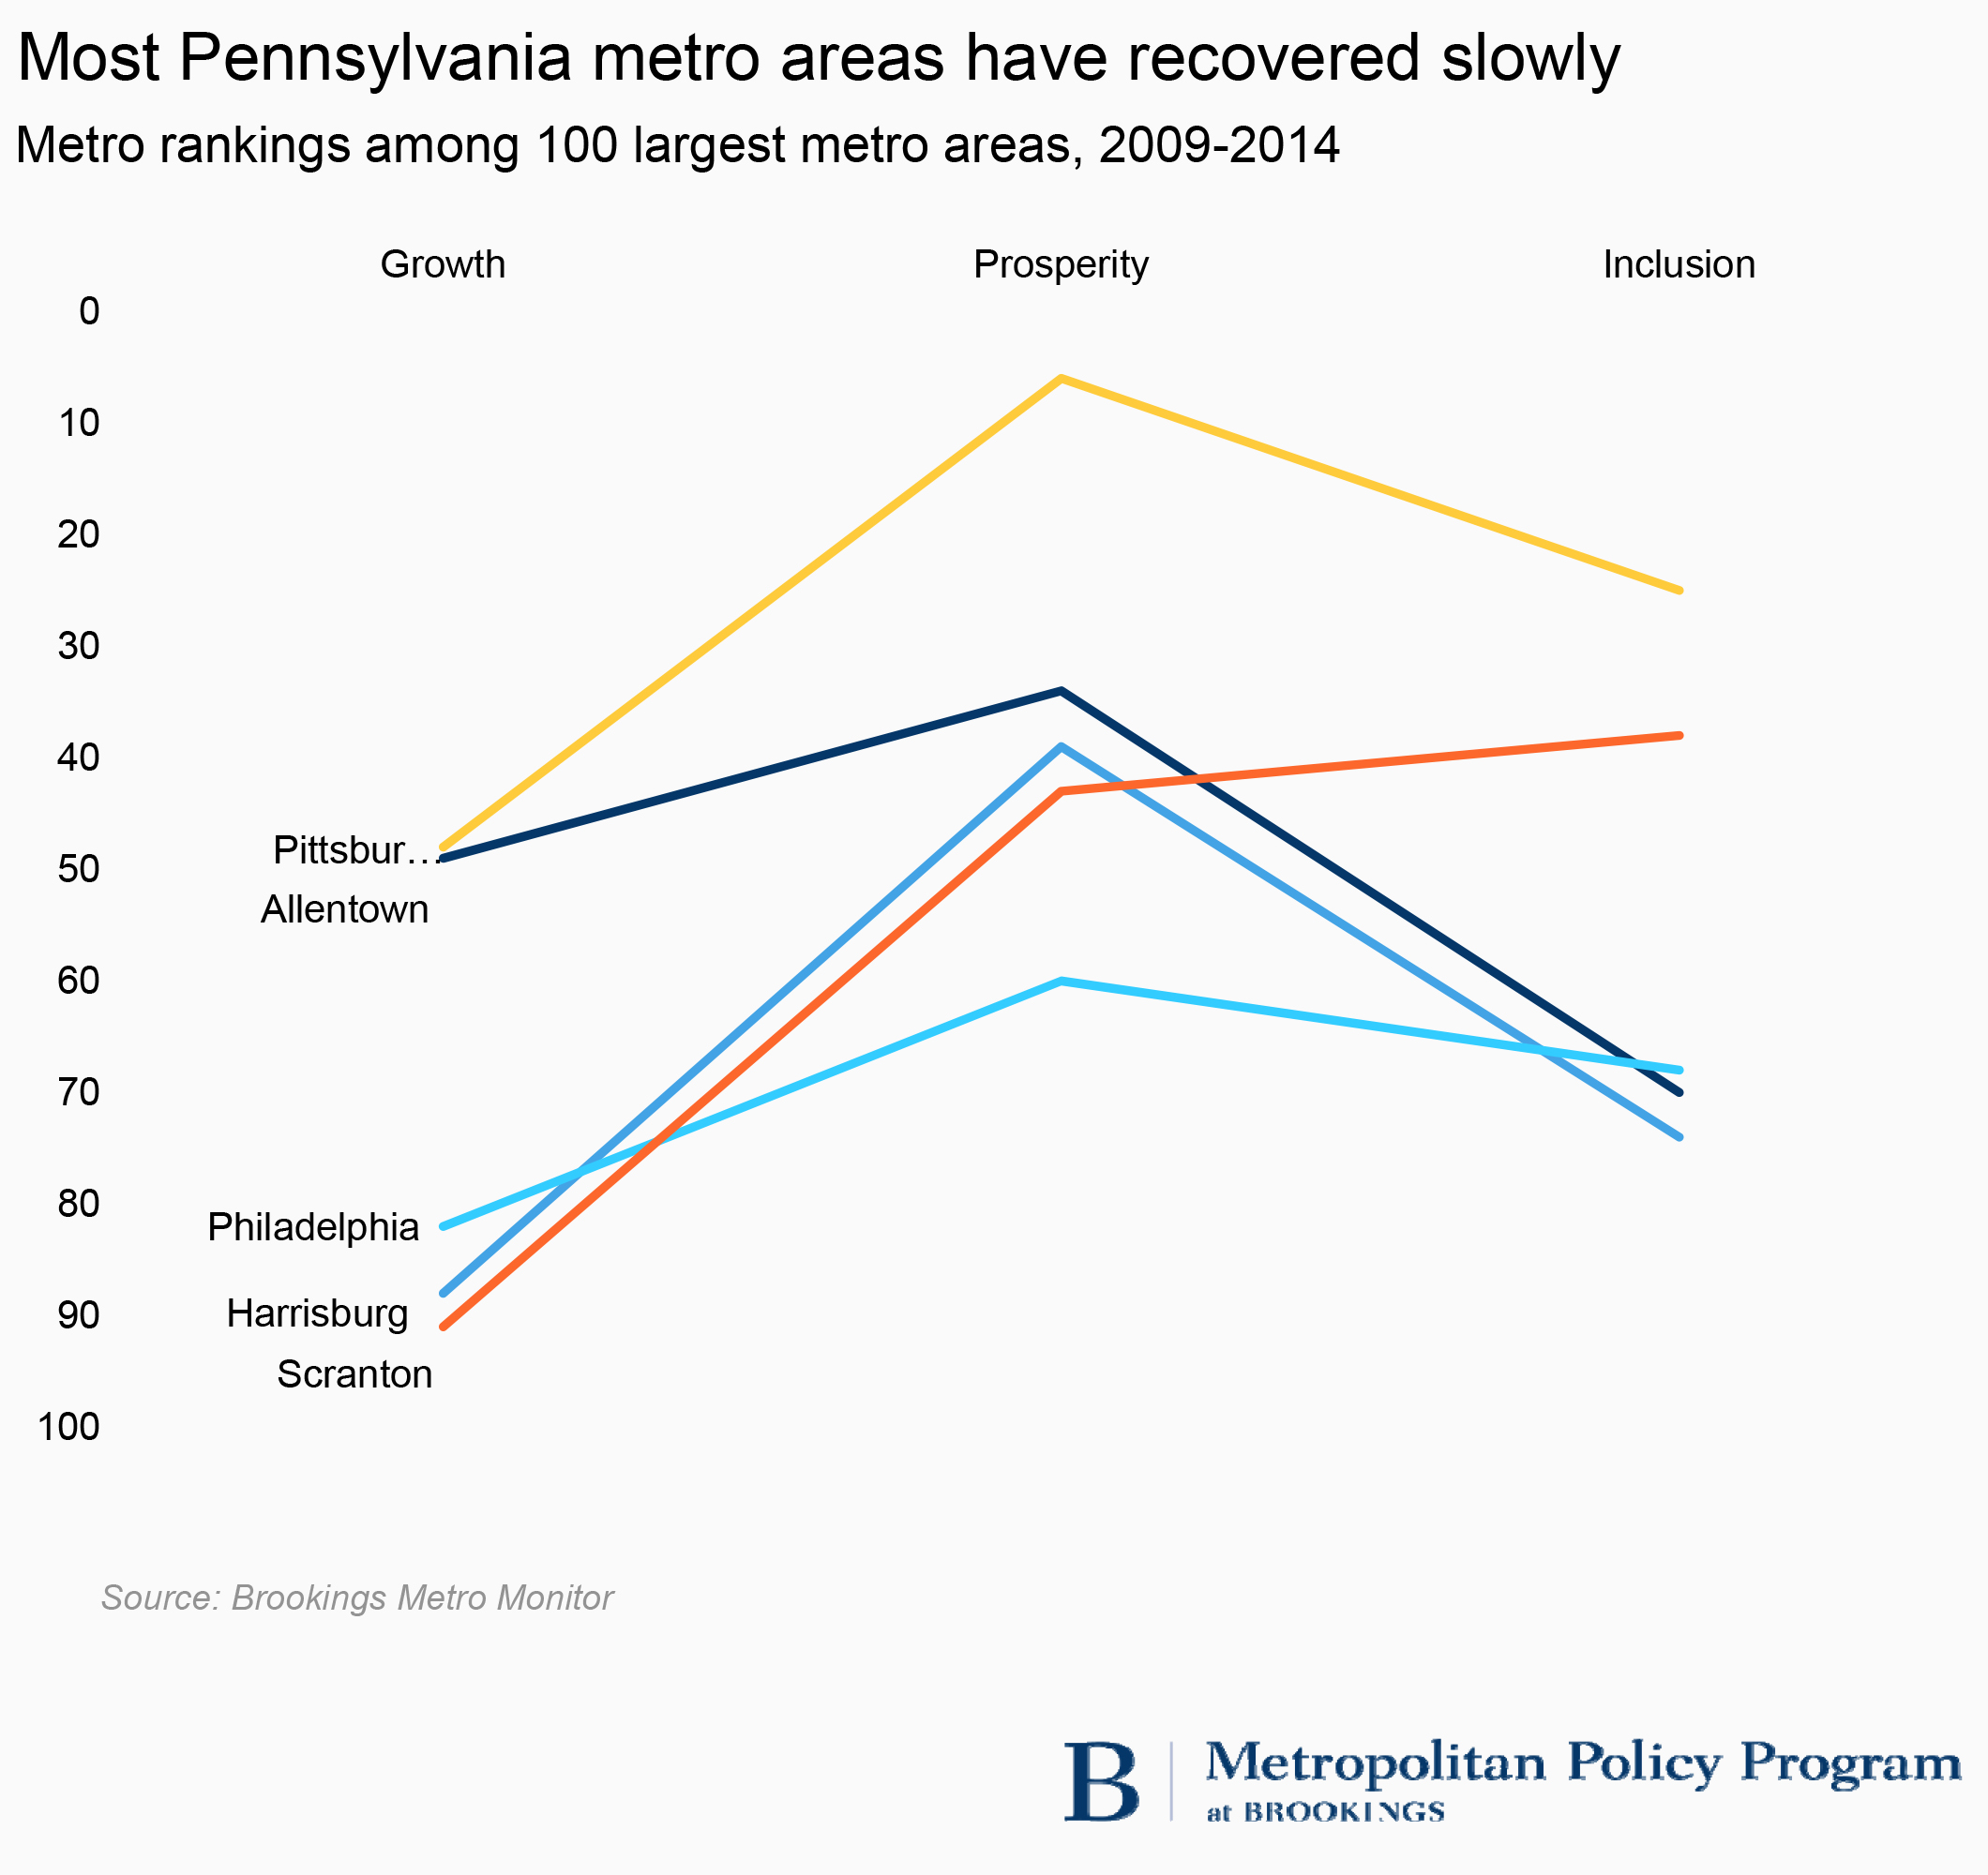
While Pennsylvania was not one of the states hardest hit by the Great Recession, most of its major metropolitan areas bounced back relatively slowly. According to the Brookings Metro Monitor, Harrisburg, Philadelphia, and Scranton ranked among the 20 slowest-growing large metropolitan economies from 2009 to 2014. All performed somewhat better on achieving increases in the local standard of living (prosperity), but Pittsburgh stood out for its 6 percent average wage growth during that time, seventh-fastest in the nation. This wage trend also seems to have propelled Pittsburgh to a better performance than other Pennsylvania metro areas on indicators of employment, wages, and relative poverty (inclusion). Allentown, Harrisburg, and Philadelphia, on the other hand, registered declines in typical worker wages during the first five years of the recovery and little to no progress in reducing poverty.
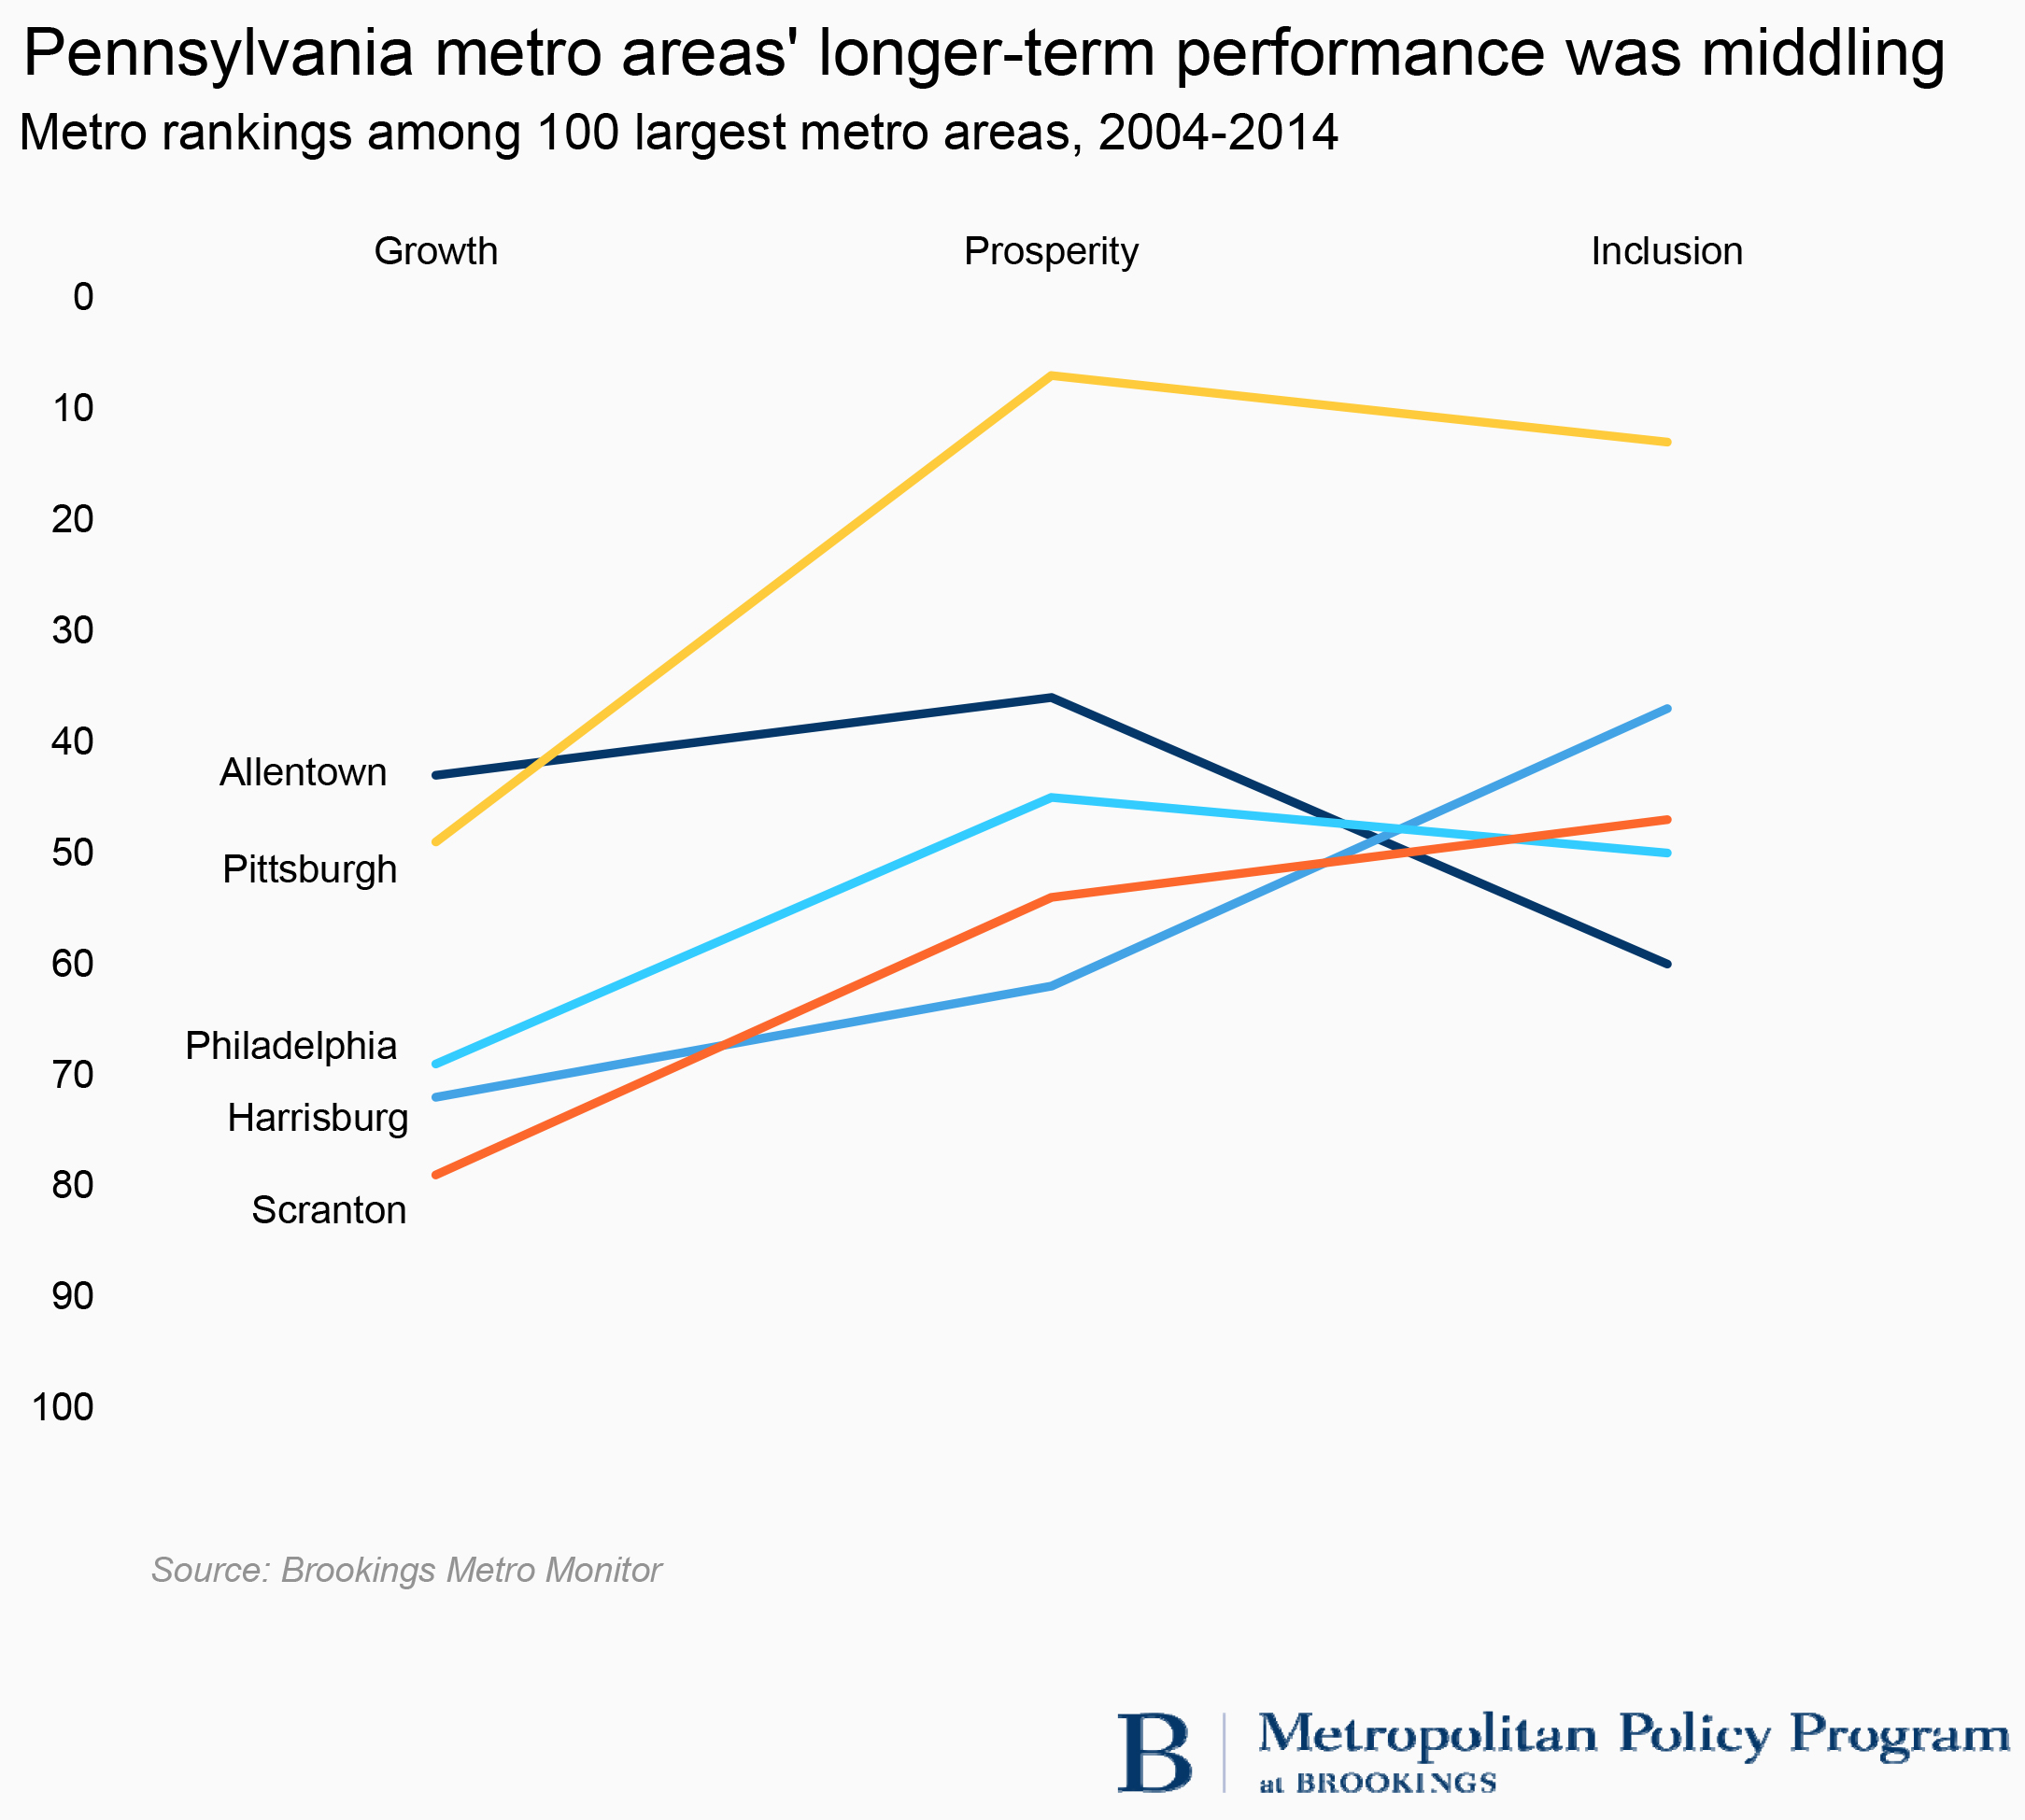
The picture over a longer timeframe is similar, though somewhat less dire. Pittsburgh posted middling growth but very strong performance on prosperity and inclusion over the past 10 to 15 years. That provided a contrast with Allentown, where the economy grew somewhat faster but productivity and average standards of living did not, and economic inclusion suffered. The remaining metro areas—Harrisburg, Philadelphia, and Scranton—all grew weakly but managed to post middling performance on prosperity and inclusion indicators.
Troubling racial disparities
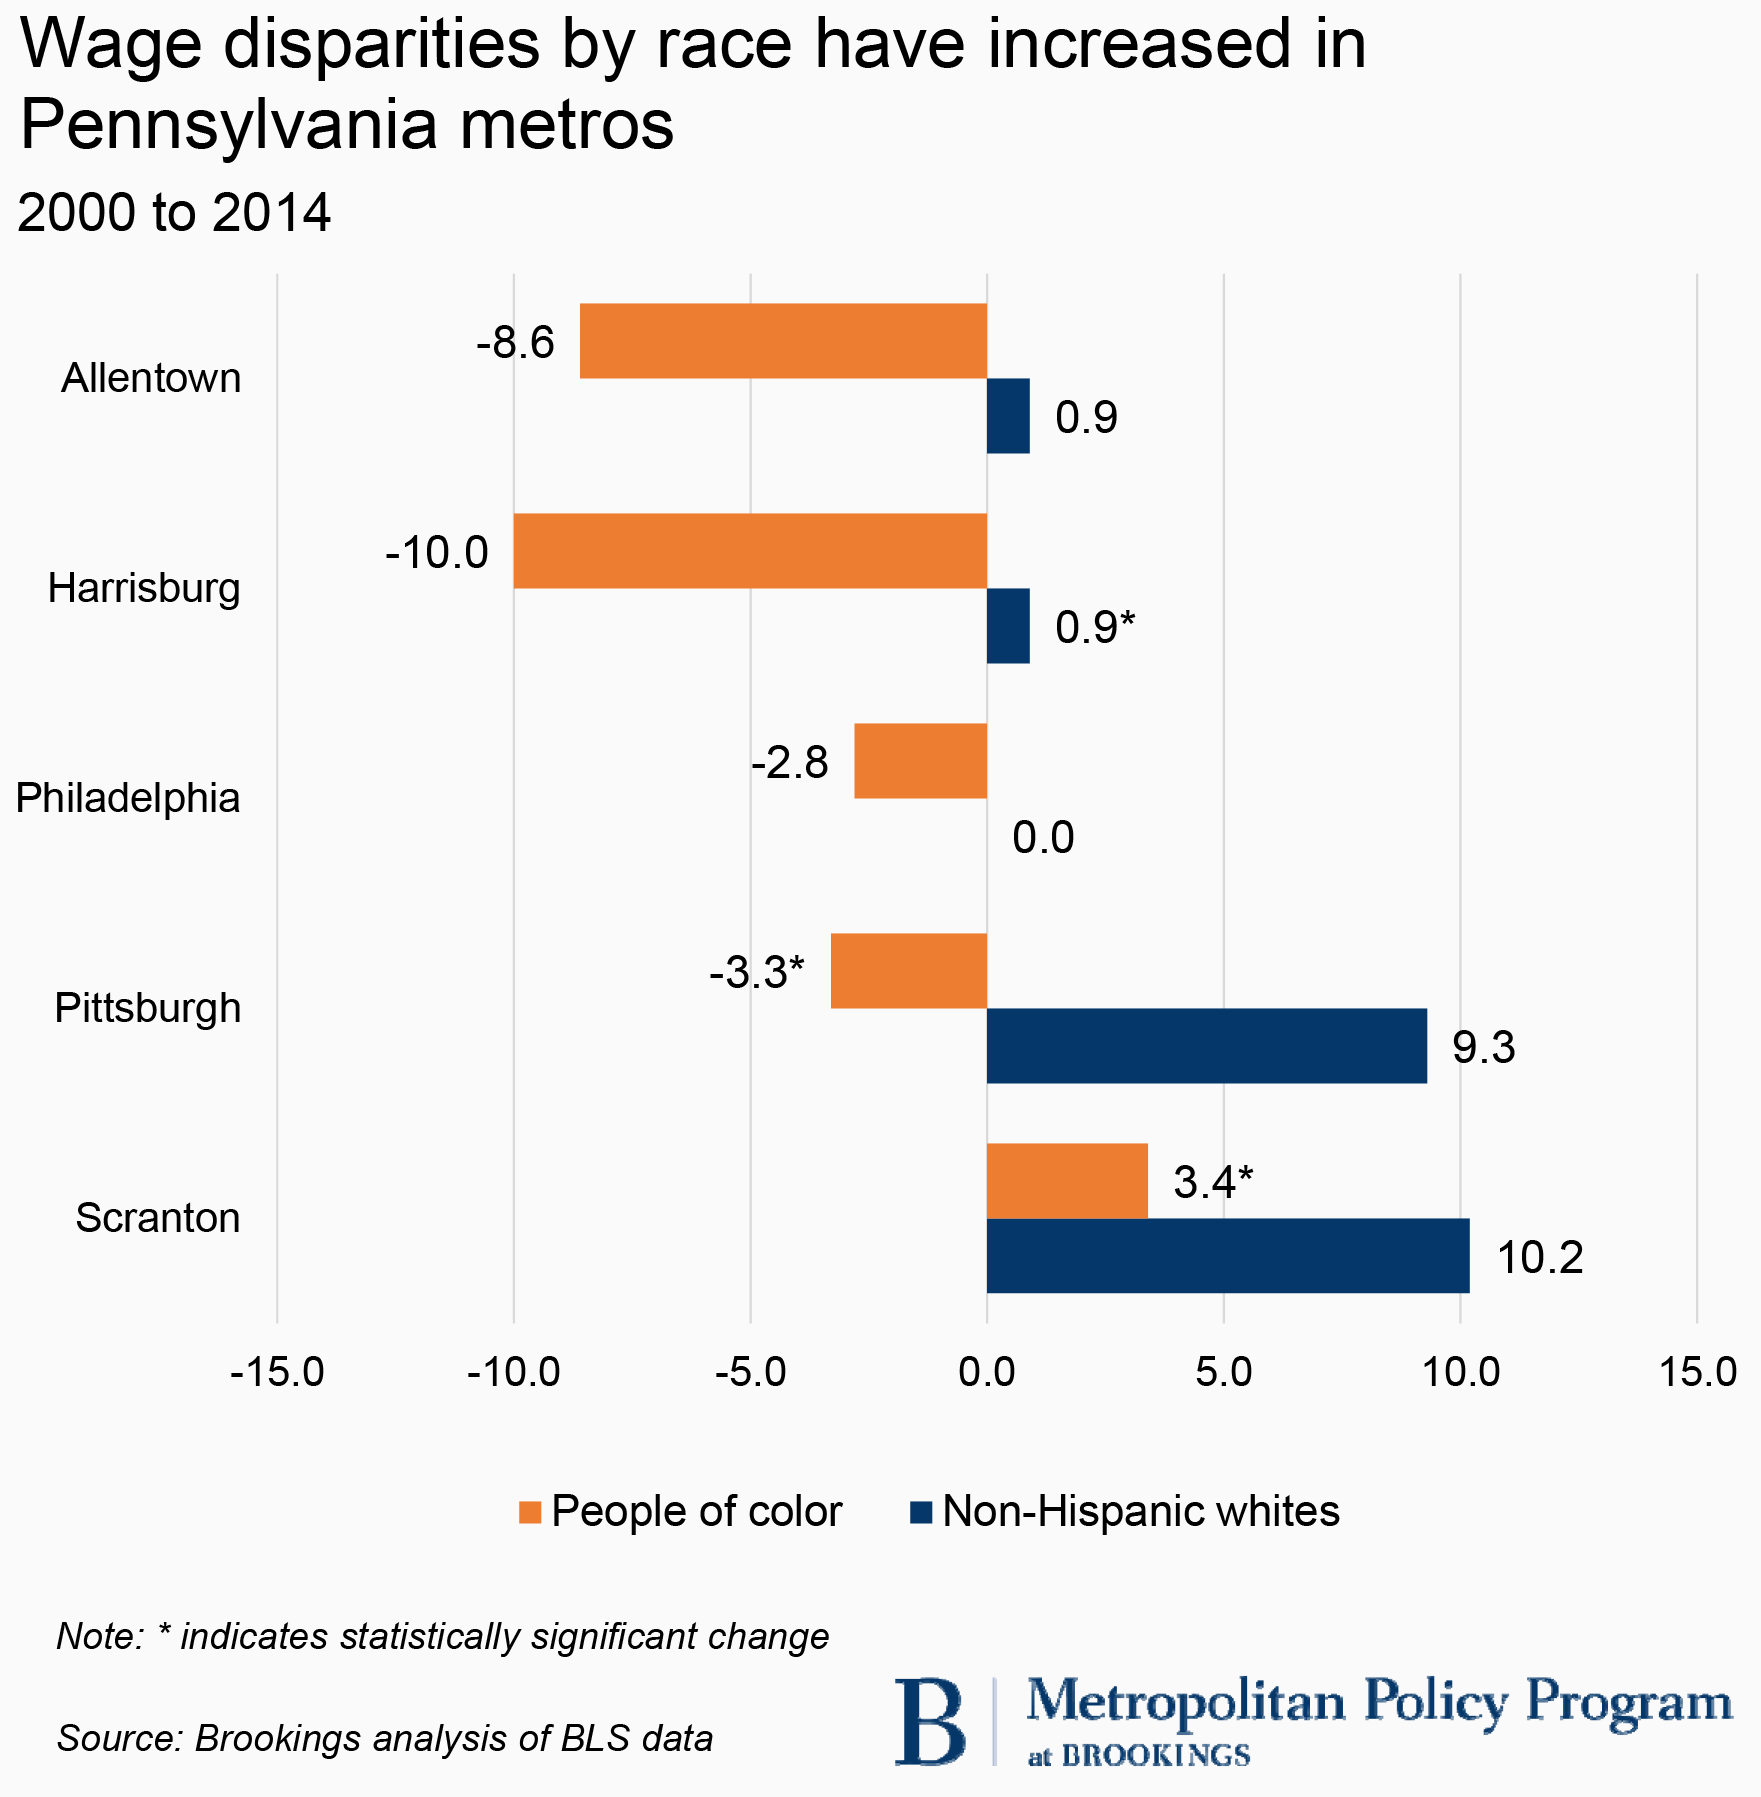
Pennsylvania remains a whiter state than the national average, but its major metro areas are increasingly diverse, particularly in the southeastern part of the state around Philadelphia and Allentown. Nonetheless, Pennsylvania’s economic challenges are frequently framed around the plight of the white working class, which, as my colleague Bill Frey notes, comprises 59 percent of the state’s eligible voter population. In Allentown, Harrisburg, and Philadelphia, whites have indeed suffered long-term wage stagnation. Yet in the more manufacturing-oriented Pittsburgh and Scranton areas, median wages for whites rose significantly from 2000 to 2014. By contrast, workers of color have experienced much more troublesome wage trends, losing ground to whites in every major metro area. Across the five metro areas, typical earnings differences between whites and other workers in 2014 averaged between $10,000 and $12,000.
Reversal of fortune?
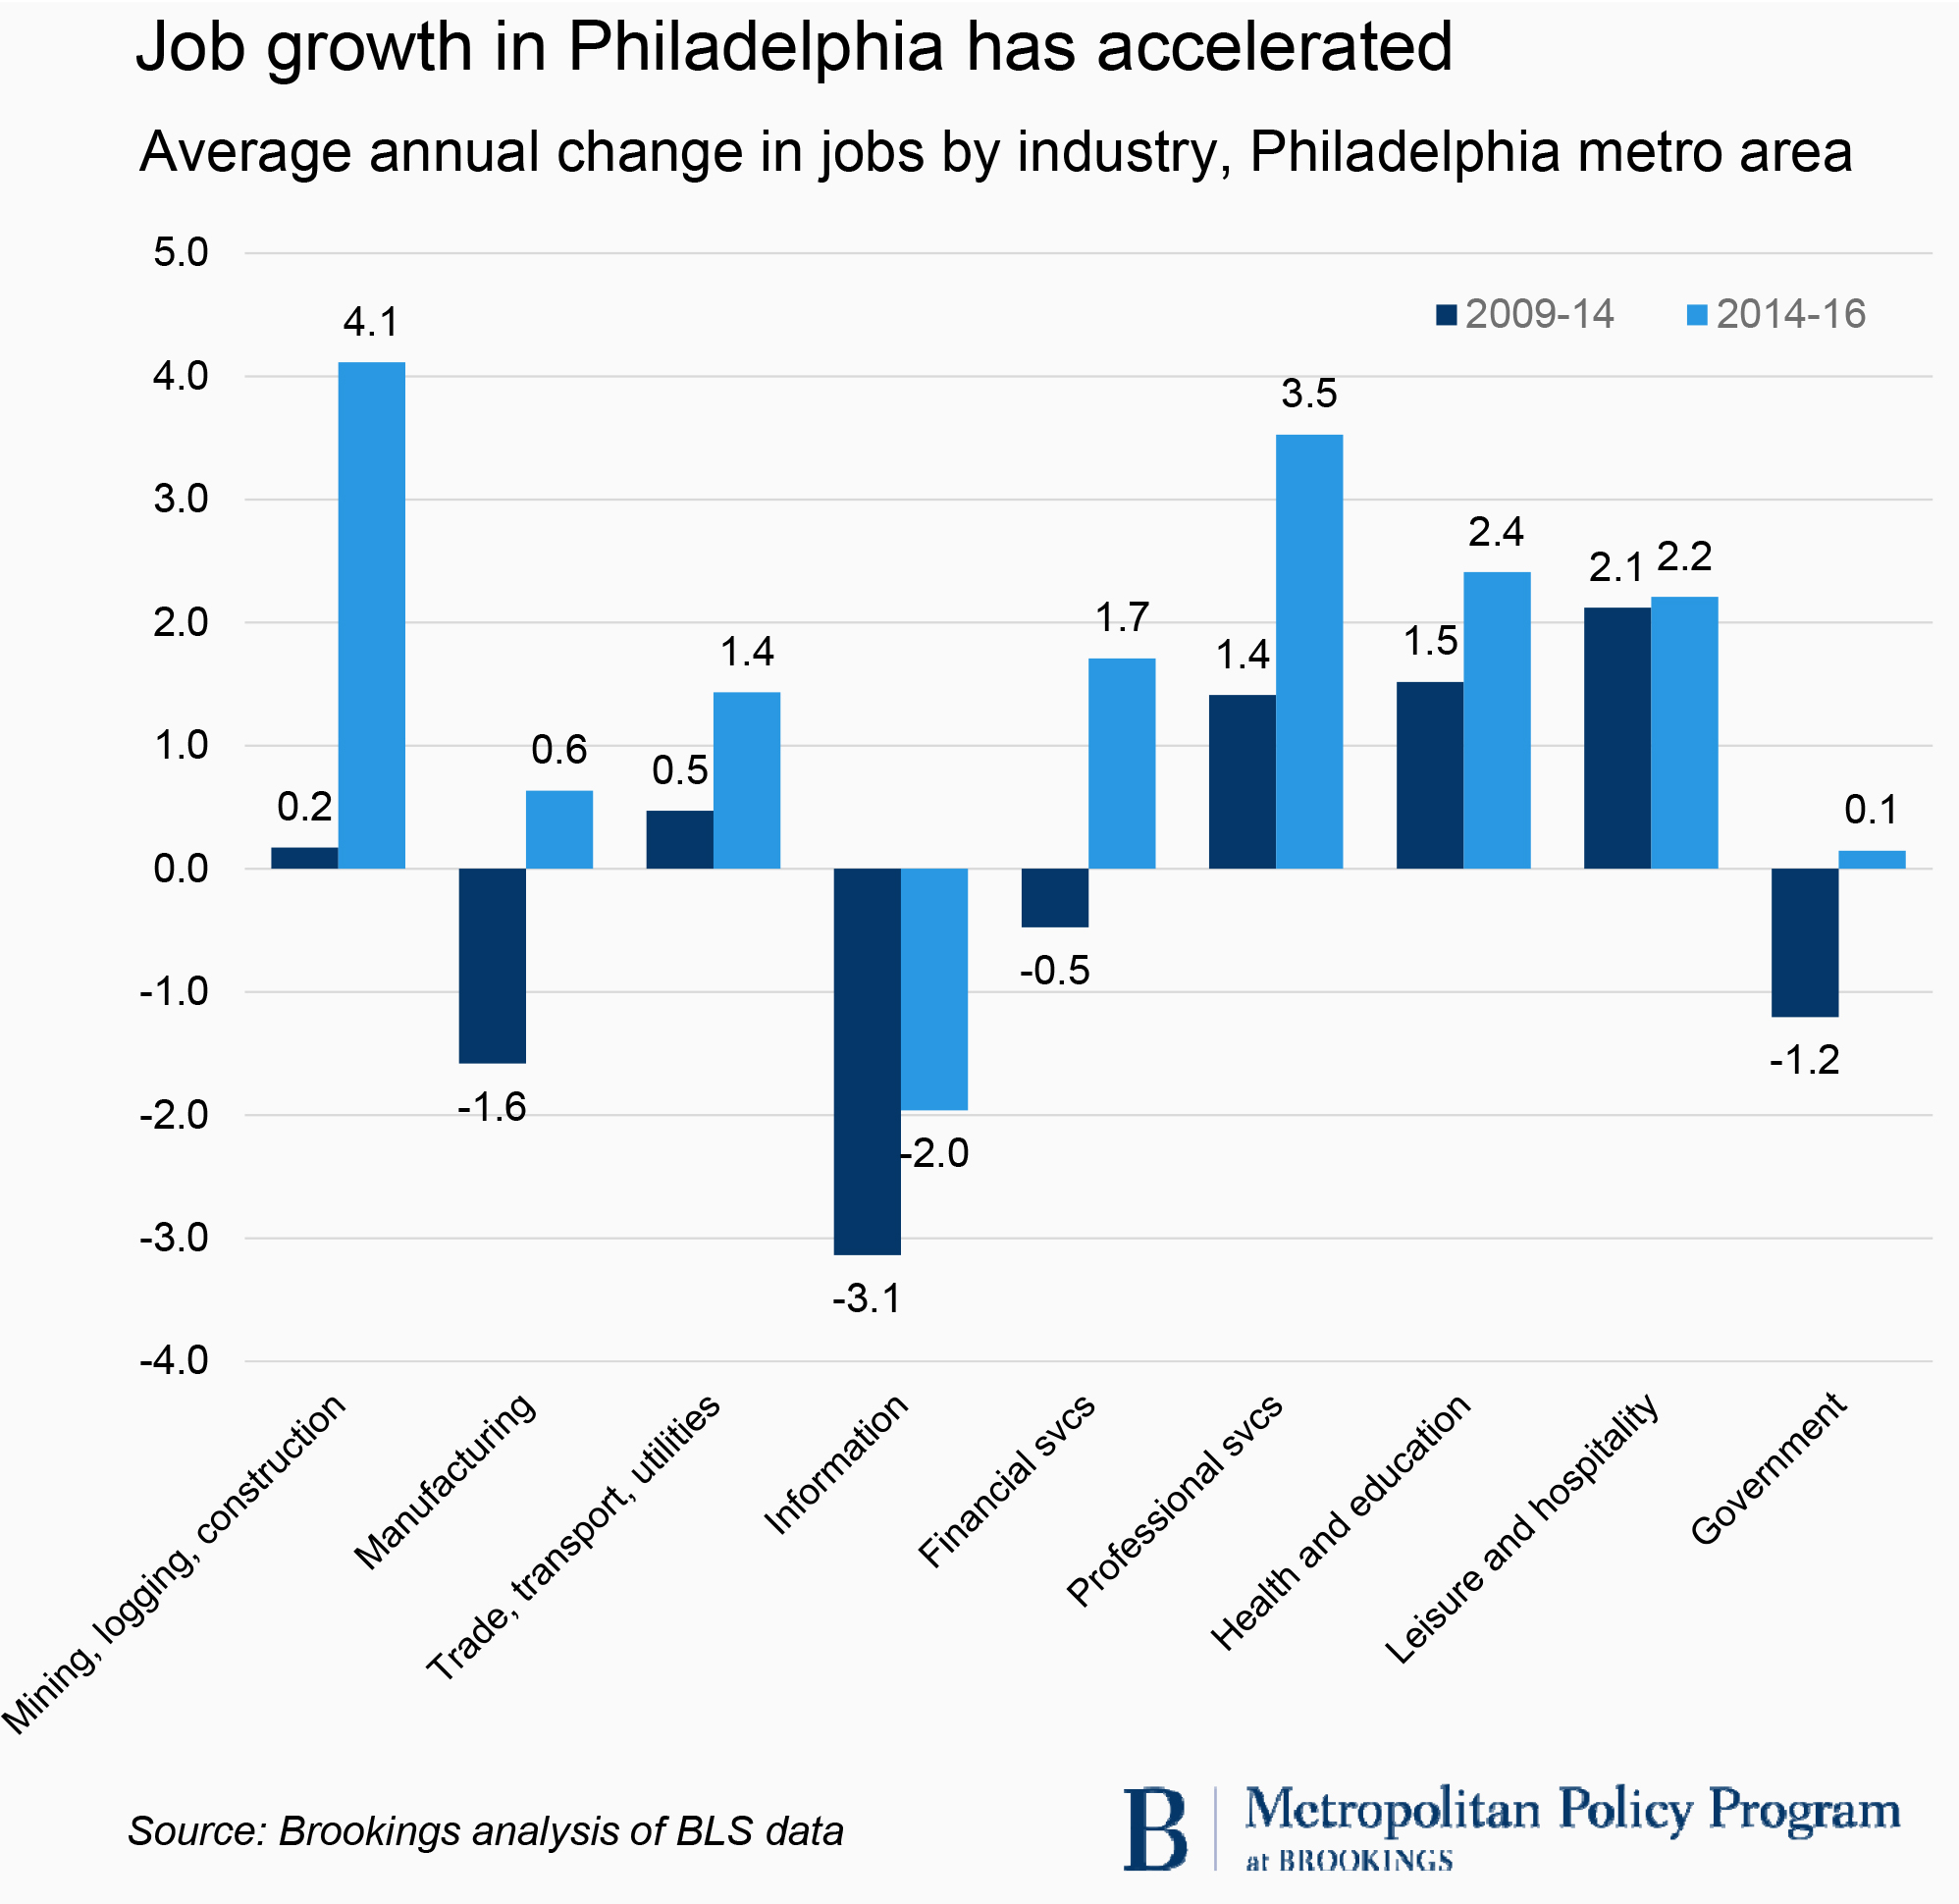
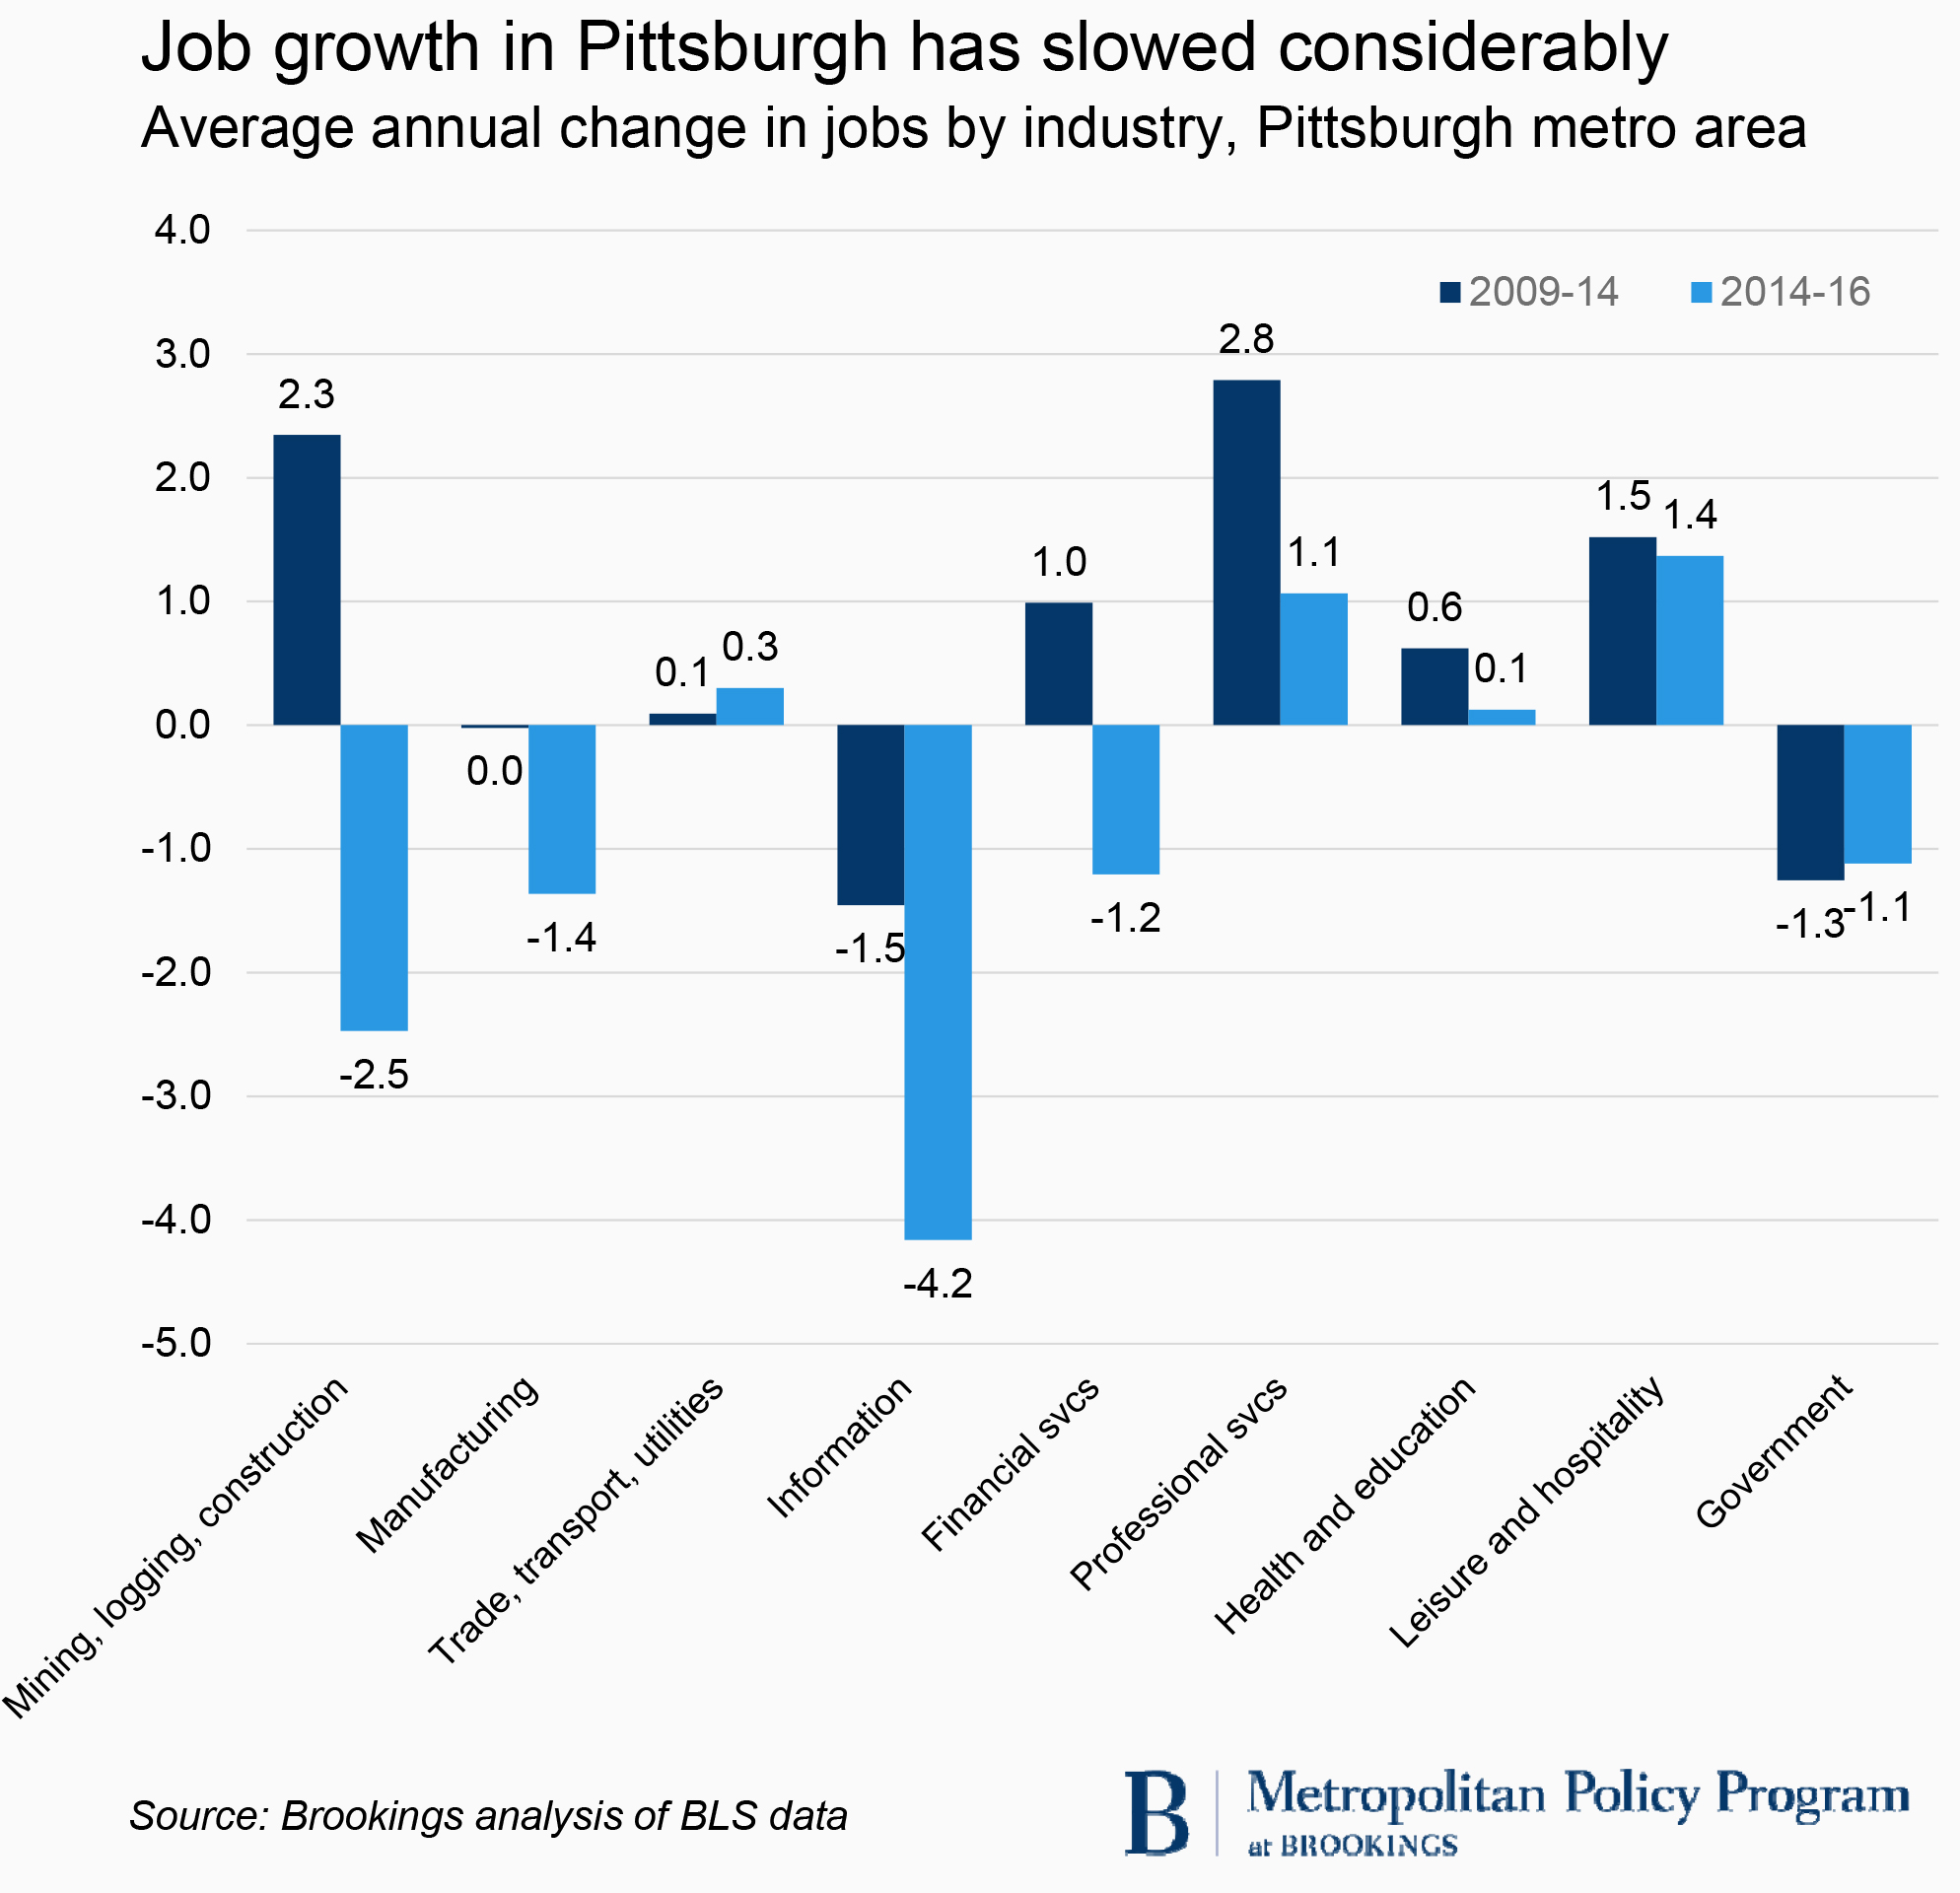
A look at the most recent job trends, from 2014 to 2016, suggests a shifting metro growth map in Pennsylvania. Over the past two years, Philadelphia and Harrisburg have posted much stronger job gains, Allentown’s average annual job growth rate has halved, and Pittsburgh’s job level has flat-lined. The state’s two largest urban centers frame this stark change. In every major industry category, average annual job growth in Philadelphia over the past two years outpaced its rate over the previous five years. In Pittsburgh, on the other hand, job growth slowed—or turned negative—in nearly every sector. The recent energy price crash has halted a fracking boom that buoyed the western Pennsylvania economy through much of the recovery, at the same time that Philadelphia is enjoying a surge in professional services and construction employment. Fittingly, Donald Trump used Allegheny County, outside Pittsburgh, as the backdrop for one of his first post-primary campaign stops, while Philadelphia’s economic momentum will be the background of the Democrats’ argument for another four years in the White House.
The Pennsylvania economy is thus not easily characterized, and the attitudes of its voters are likely to be shaped by regionally specific short-term and long-term trends. Those trends seem sure to keep the Keystone State’s electoral votes and U.S. Senate seat highly contested over the next several months.



Commentary
Pennsylvania’s metro economies: A 2016 election profile
July 25, 2016