The 2022 midterm election results made plain that the predicted “red wave”—in which Republicans were expected to win by huge margins in the House of Representatives and take over the Senate—did not occur. In fact, Democrats gained an additional Senate seat, and while Republicans took control of the House, it was by a modest nine seats rather than the 30-plus some pundits predicted.
Although each state’s election results drew from different demographic components, analyses of exit polls underscored that young voters showed strong Democratic preferences, which contributed to the party’s better-than-expected performance in House, Senate, and select gubernatorial races. Strong Democratic preferences by other groups—including Black Americans, Latino or Hispanic Americans, women, and white female college graduates—also contributed.
What these analyses did not provide, however, was a detailed examination of turnout rates—the percent of eligible voters who voted—associated with these groups. But now, new Census Bureau data from the Current Population Survey’s Voting and Registration supplement provides this information for the 2022 election, and can be analyzed along with a similar data product from earlier elections.1
Perhaps the most notable finding with respect to voter turnout is that 2022 turnout rates were nearly as high as the record-setting 2018 midterm turnout rates. Yet unlike the previous midterm elections, the groups with the highest Democratic voting margins—in particular, young people, Black Americans, women, and white female college graduates—did not show greater turnout increases than other groups, and often displayed lower turnout rates than in the 2018 midterms. These groups displayed higher turnout rates than in the low-turnout 2014 midterms, but either did not match or did not improve on their 2018 turnout levels. And only a minority of states registered turnout increases between 2018 and 2022, while an even smaller number showed increases among young and nonwhite voters.
The new data also provides information on the demographics of the voting population both nationally and across states. As in the 2018 midterms, less than two-fifths of voters in the 2022 midterms were non-college-educated white voters—down from well over 40% in elections prior to 2018. The share of these voters has declined over time in almost all states, while since 2010, the share of white college graduates and nonwhite voters increased nationally and in most states.
Overall, the data places a somewhat new lens on the results of last November’s midterms. The stronger-than-expected Democratic performance was largely due to the voting preferences of the party’s favored demographic blocs that turned out to vote. But the turnout rates for these blocs—while still higher than most pre-2018 elections—either declined or did not rise since the previous midterms.
Overall turnout in 2022 out was high, but with unexpected shifts
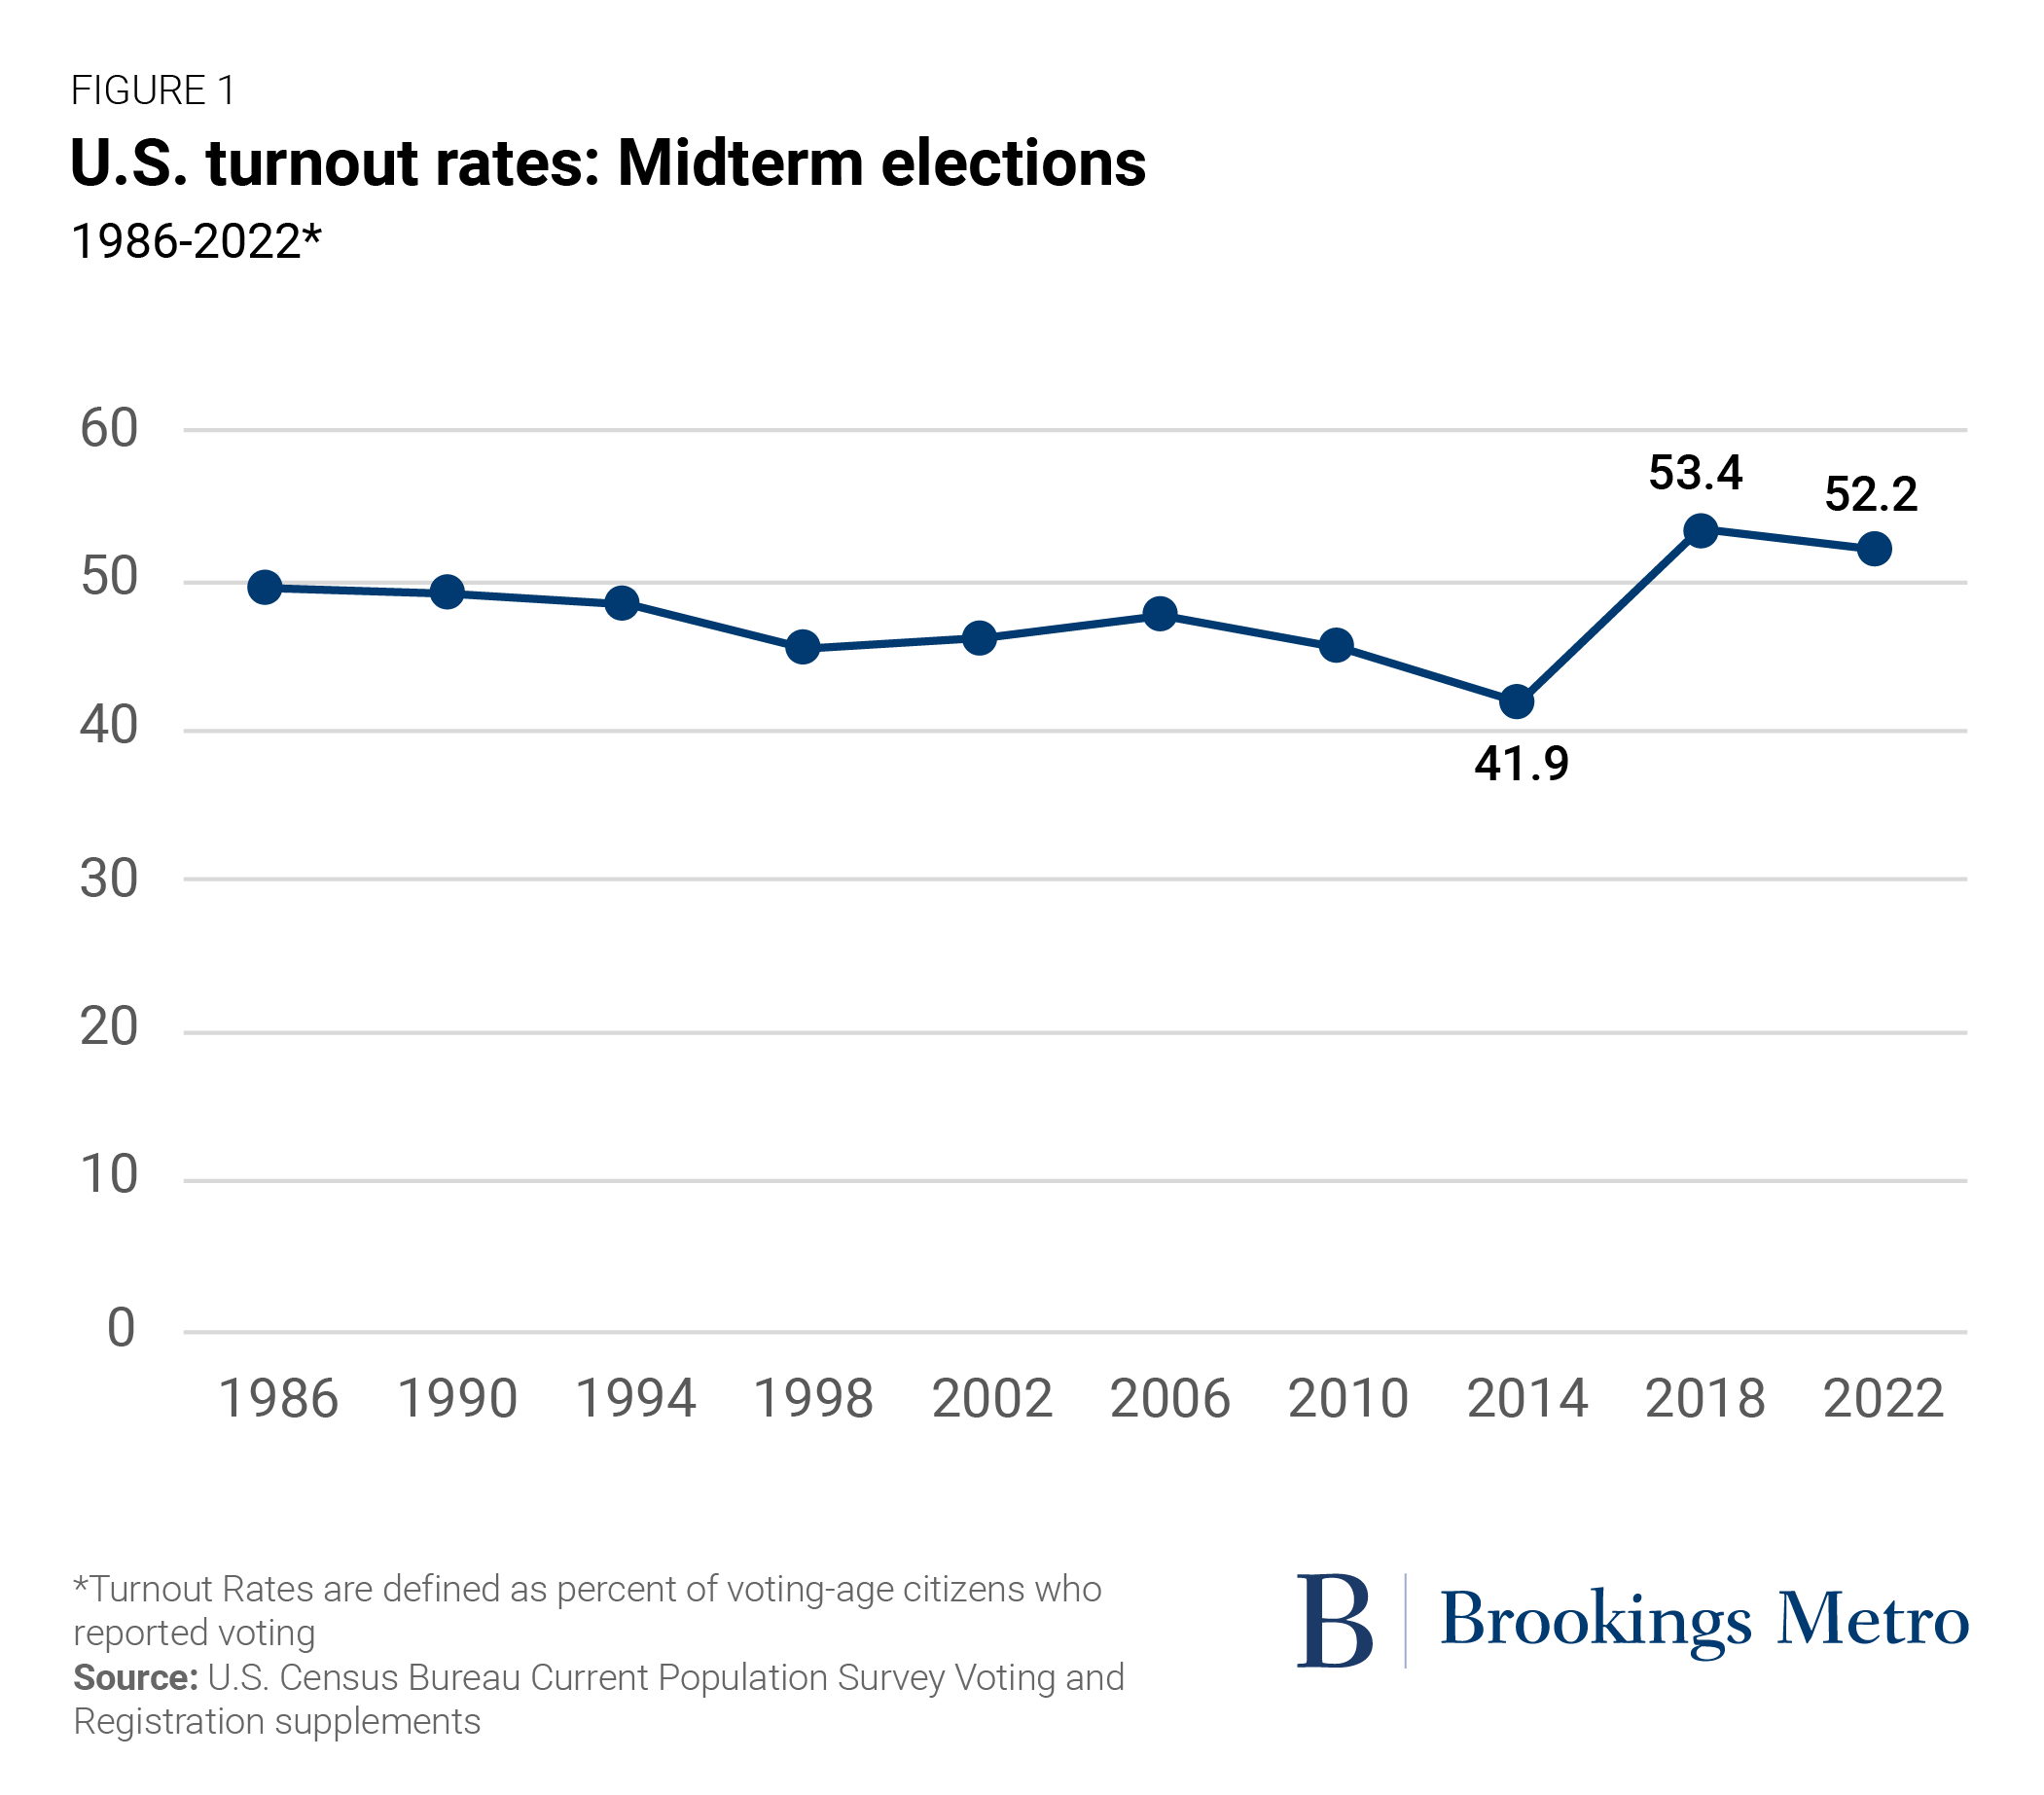
The national election rate (actual voters per 100 eligible voters) in 2022 was 52.2%—the second-highest that the Census Bureau has recorded for a midterm in four decades. The highest was in 2018, at 53.4%. (The 2020 presidential election, meanwhile, recorded a very high rate of 66.3%.) This, along with the fact that the 2022 midterms also saw the highest rate of voter registration recorded by the Census Bureau, suggests that the nation has entered an era of a highly energized electorate, perhaps spurred by a rising level of partisanship.
Still, given the results of the 2022 midterms—when the “red wave” did not materialize—one might have expected that key Democratic-leaning voting groups such as young people, people of color, women, and white female college graduates would have shown bigger turnout increases than other groups. That was the case for Democratic wins in the 2018 midterms and 2020 presidential election. Yet an examination of 2022 turnout rates by age, sex, race, and education reveals that these groups did not show the greatest turnout increases and, in many cases, displayed lower turnout than in 2018. (See Figure 2 and downloadable Table A).
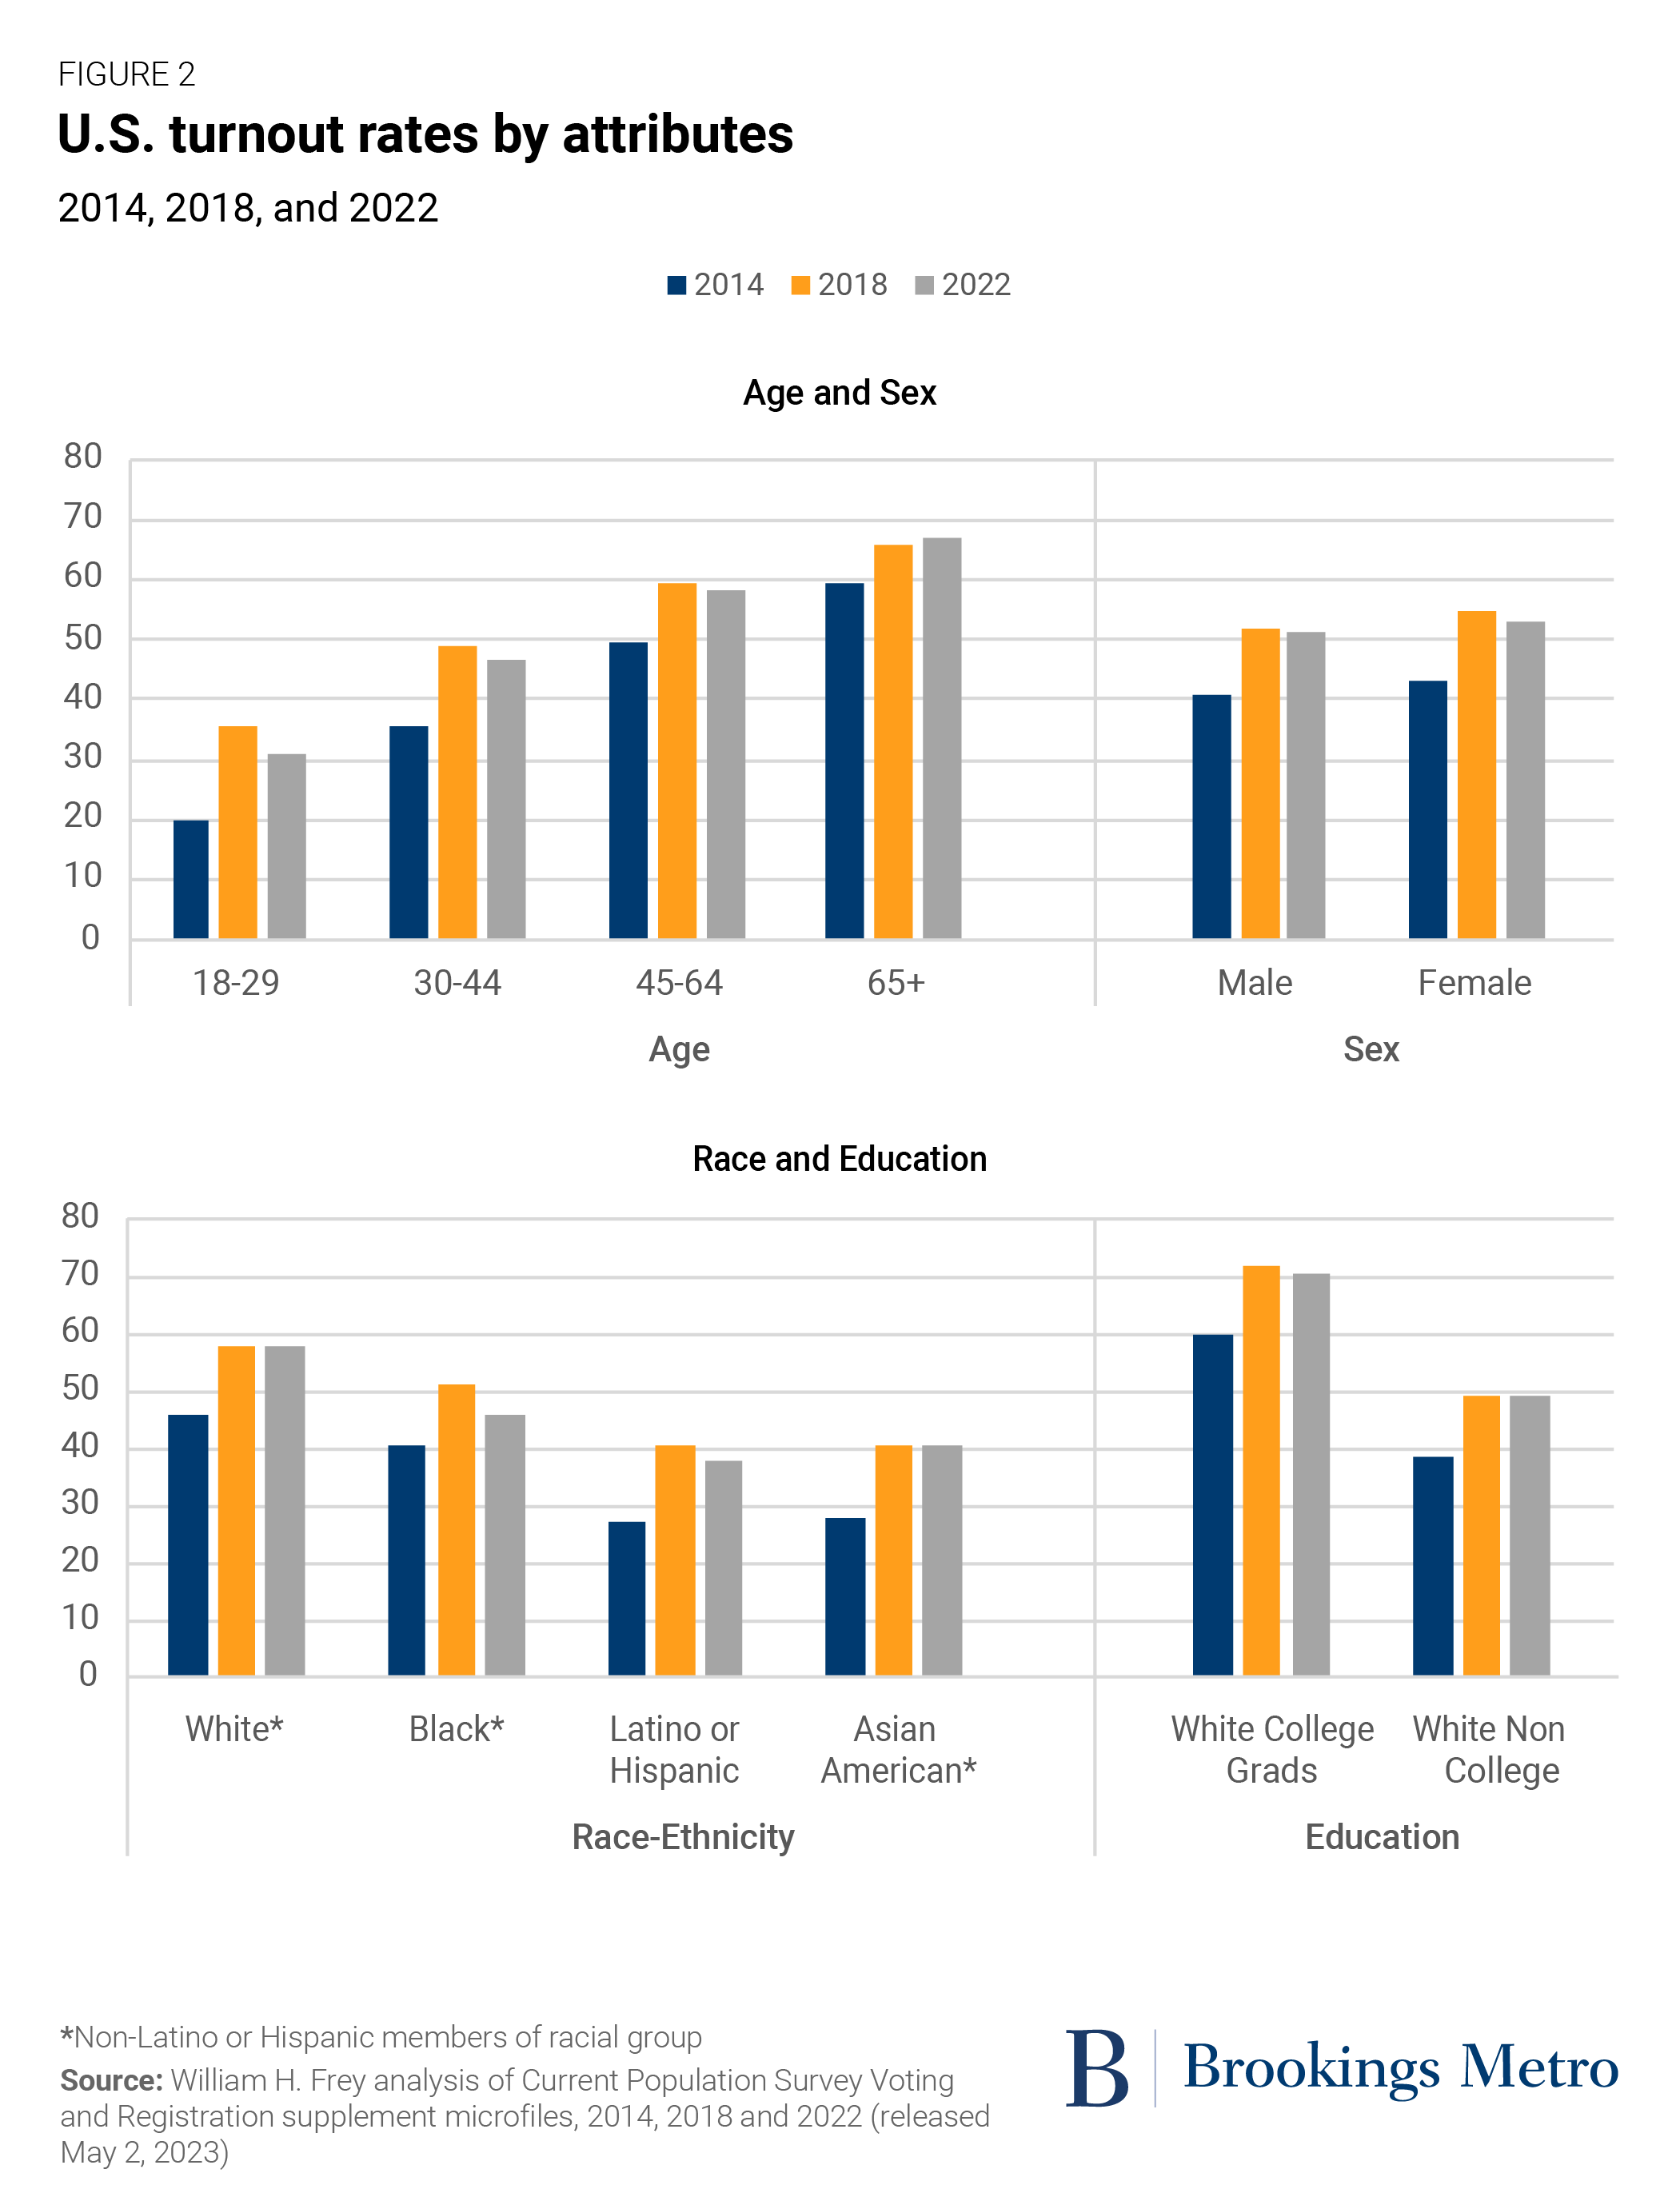
Among broad age groups, 18- to 29-year-olds showed a noticeable decline in turnout since 2018, with the oldest group (over age 65) registering a modest gain. This is opposite of what happened between the 2014 and 2018 midterms as well as between the 2016 and 2020 presidential elections, when the younger group registered the largest turnout gains of all age groups. While 2022 turnout rates for 18- to 29-year-olds (as those of other groups) continued to be higher than in 2014 and several earlier midterms, the downward shift is surprising. Moreover, as in the past, older eligible voters displayed higher turnout rates overall than younger eligible voters. Because of the decline in younger turnout rates in 2022, the young-old age gap in turnout widened modestly.
Among racial groups, it is also surprising that Black and Latino or Hispanic Americans showed noticeably lower turnout rates in 2022 than in 2018, while white Americans’ turnout levels were similar. When looking at racial turnout levels within age groups, distinct declines are seen for Black and Latino or Hispanic 18- to 29-year-olds, as well as for Black 30- to 44-year-olds and 45- to 64-year-olds (download Table A). Again, this differs from 2018, when younger minorities (as well as younger white voters) showed sizeable turnout gains compared to the previous midterms.
Turnout levels in 2022 by sex were not much different from those in 2018, though female turnout decreased slightly. This is counter to expectations in a year when abortion rights were a major issue. Similarly, white female college-educated voters showed modestly lower turnout in 2022 than in 2018, though their level remains much higher than in 2014 and the immediately preceding midterms (download Table A).
Among white non-college-educated eligible voters (a reliable Republican voting group), there was no appreciable change in turnout between 2018 and 2022. While showing sharply lower turnout than white college-educated eligible voters, their 2022 turnout—like in 2018—stood higher than most earlier midterms.
Long-term demographic trends drove turnout changes in 2022
The new Census Bureau statistics also permit an examination of the demographics of the voter population and shifts in that population over time (download Table B). The makeup of the voter population depends on both the underlying demographics of eligible voters (citizens age 18 and older) and the degree to which different demographic groups turn out to vote. The former reflects broader population trends over time, while the latter serves to translate those trends into the voting population.
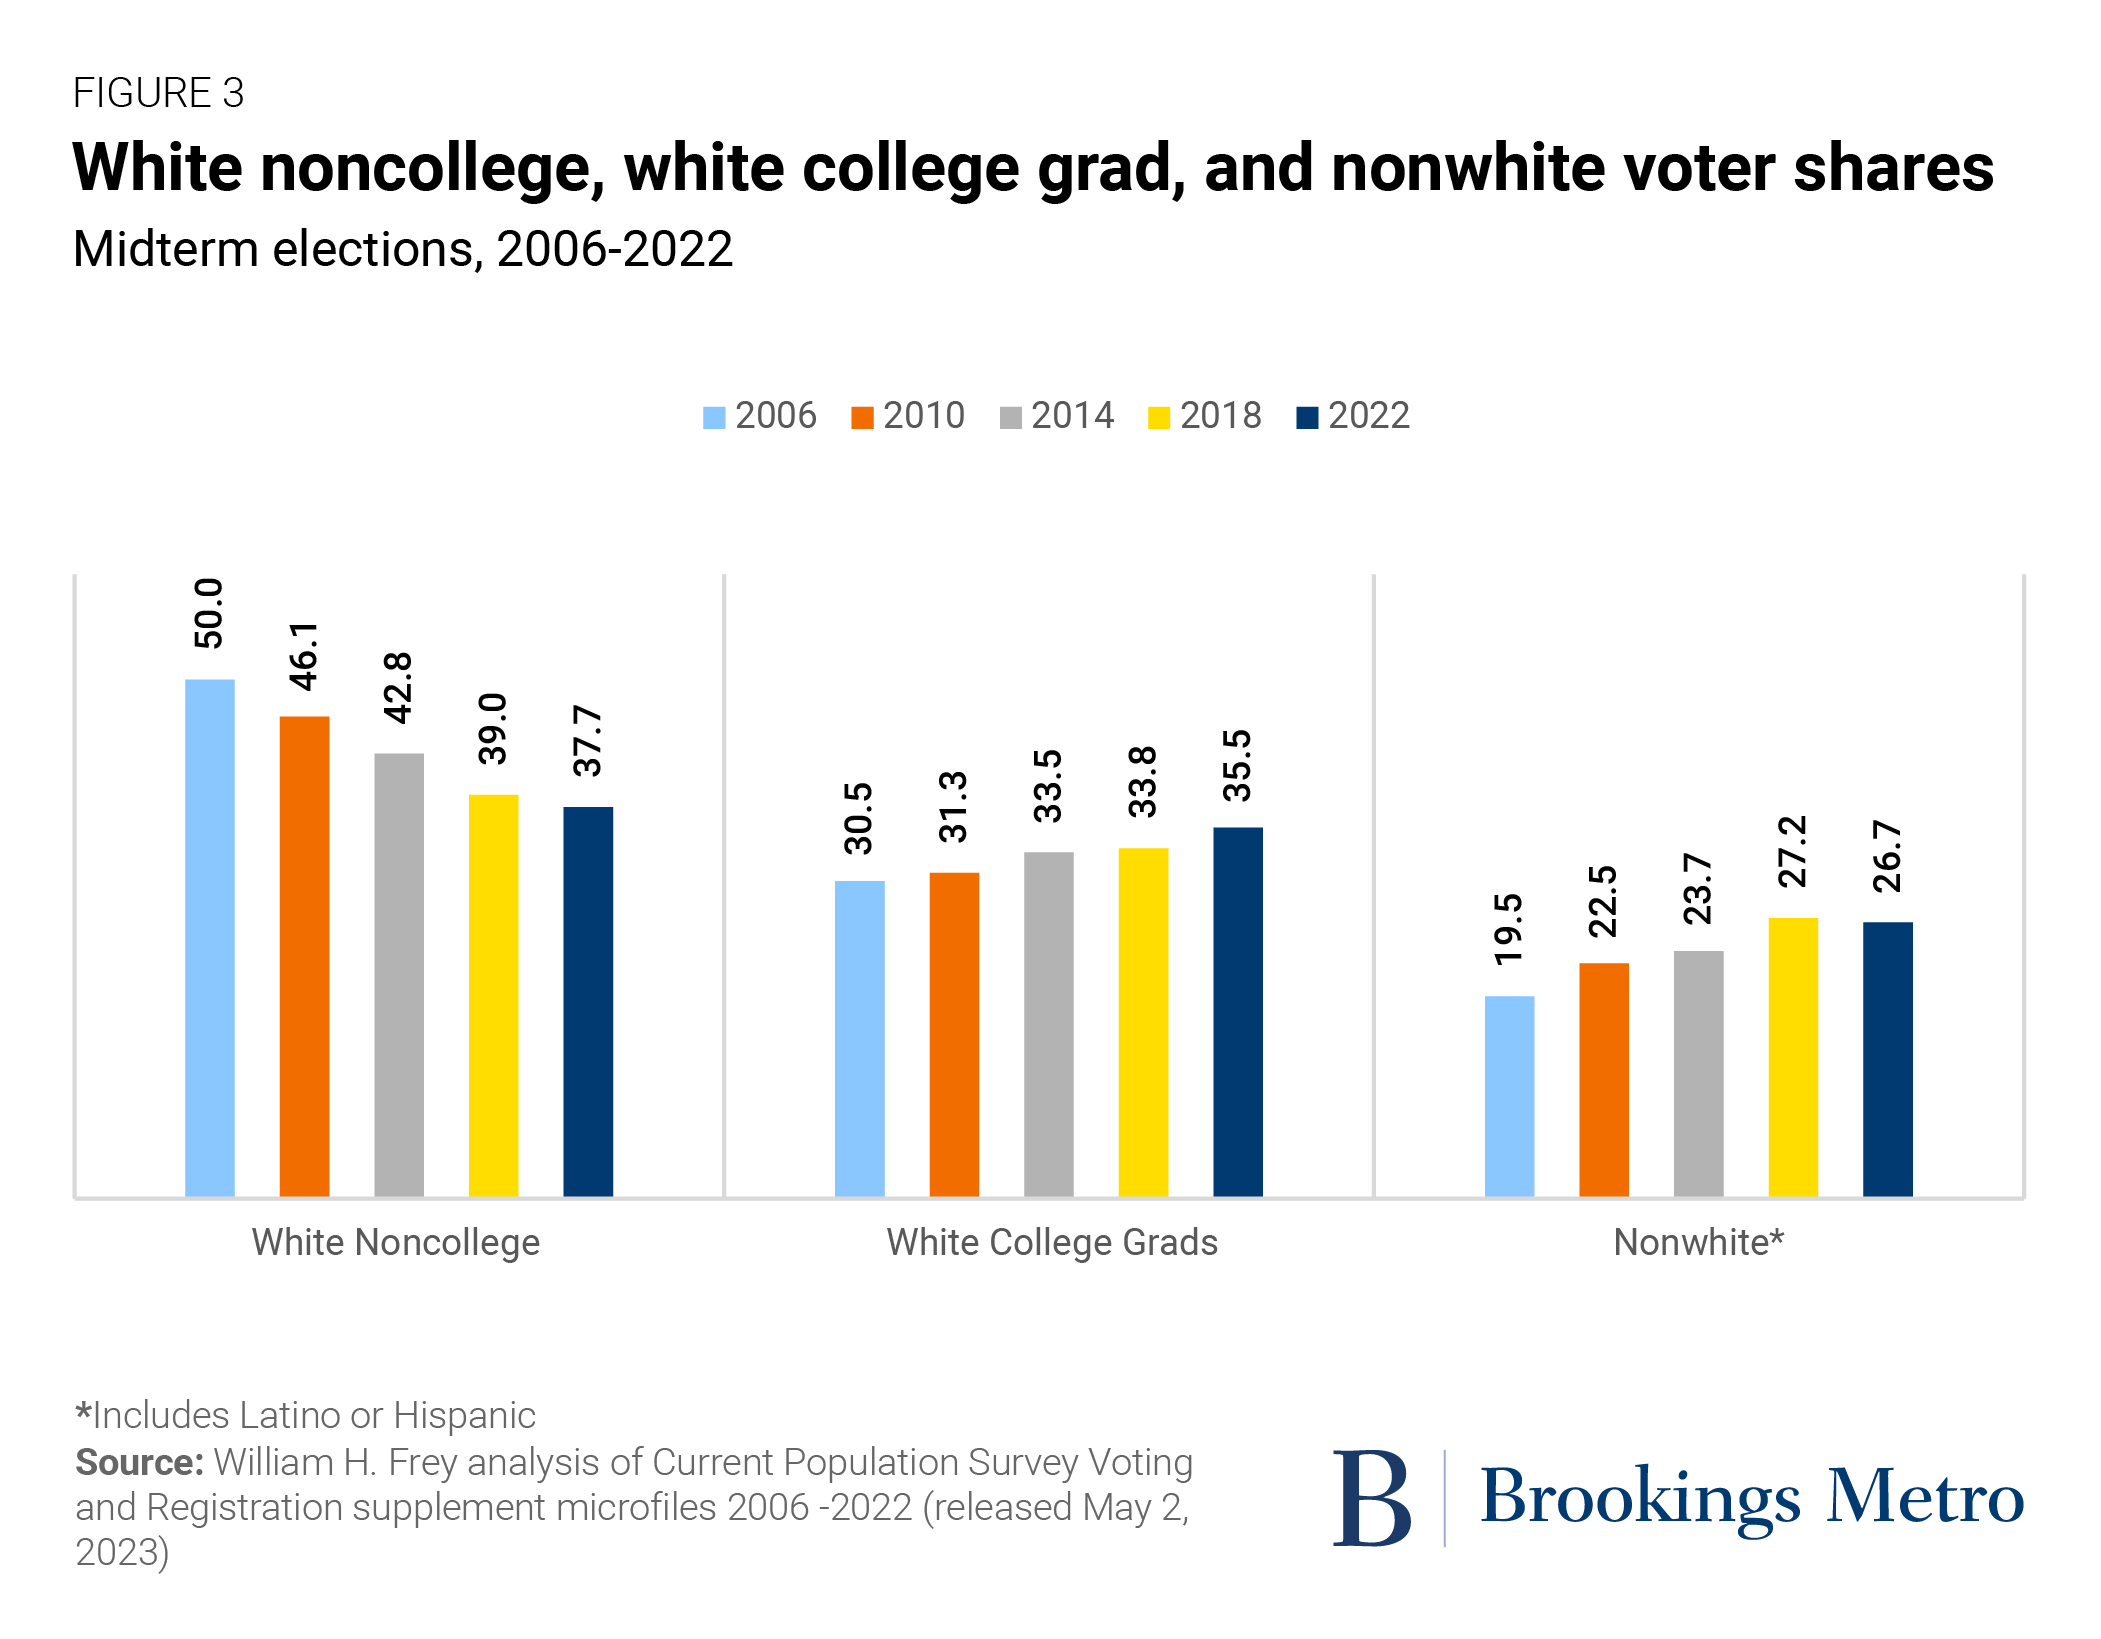
Especially notable is the continued decrease over time in the share of voters who identify as white noncollege graduates. As shown in Figure 3, 2022 was the second midterm election where this voter bloc stood below two-fifths of all voters (at 37.7%)—down from 46.1% in 2010 and 50% in 2006. This is the result of increasing shares of minorities and college-educated white Americans in the eligible voter population, as well as noncollege white turnout levels, which are still lower than those of college-educated white Americans. In contrast, the share of voters who identify as white college graduates is now over one-third (35.5%)—up from 30.5% in 2006.
The combined nonwhite voter population has also risen over time, largely as a result of the rise in nonwhite eligible voters but also due to shifts in voter turnout. The nonwhite share of midterm voters rose from less than 20% in 2006 to 27.2% in 2018 (and up from just 23.7% in 2014, due in part to higher 2018 turnout rates). However, in 2022, the nonwhite voter share declined slightly to 26.7% as result of the decreased turnout rates of Black and Latino or Hispanic Americans.
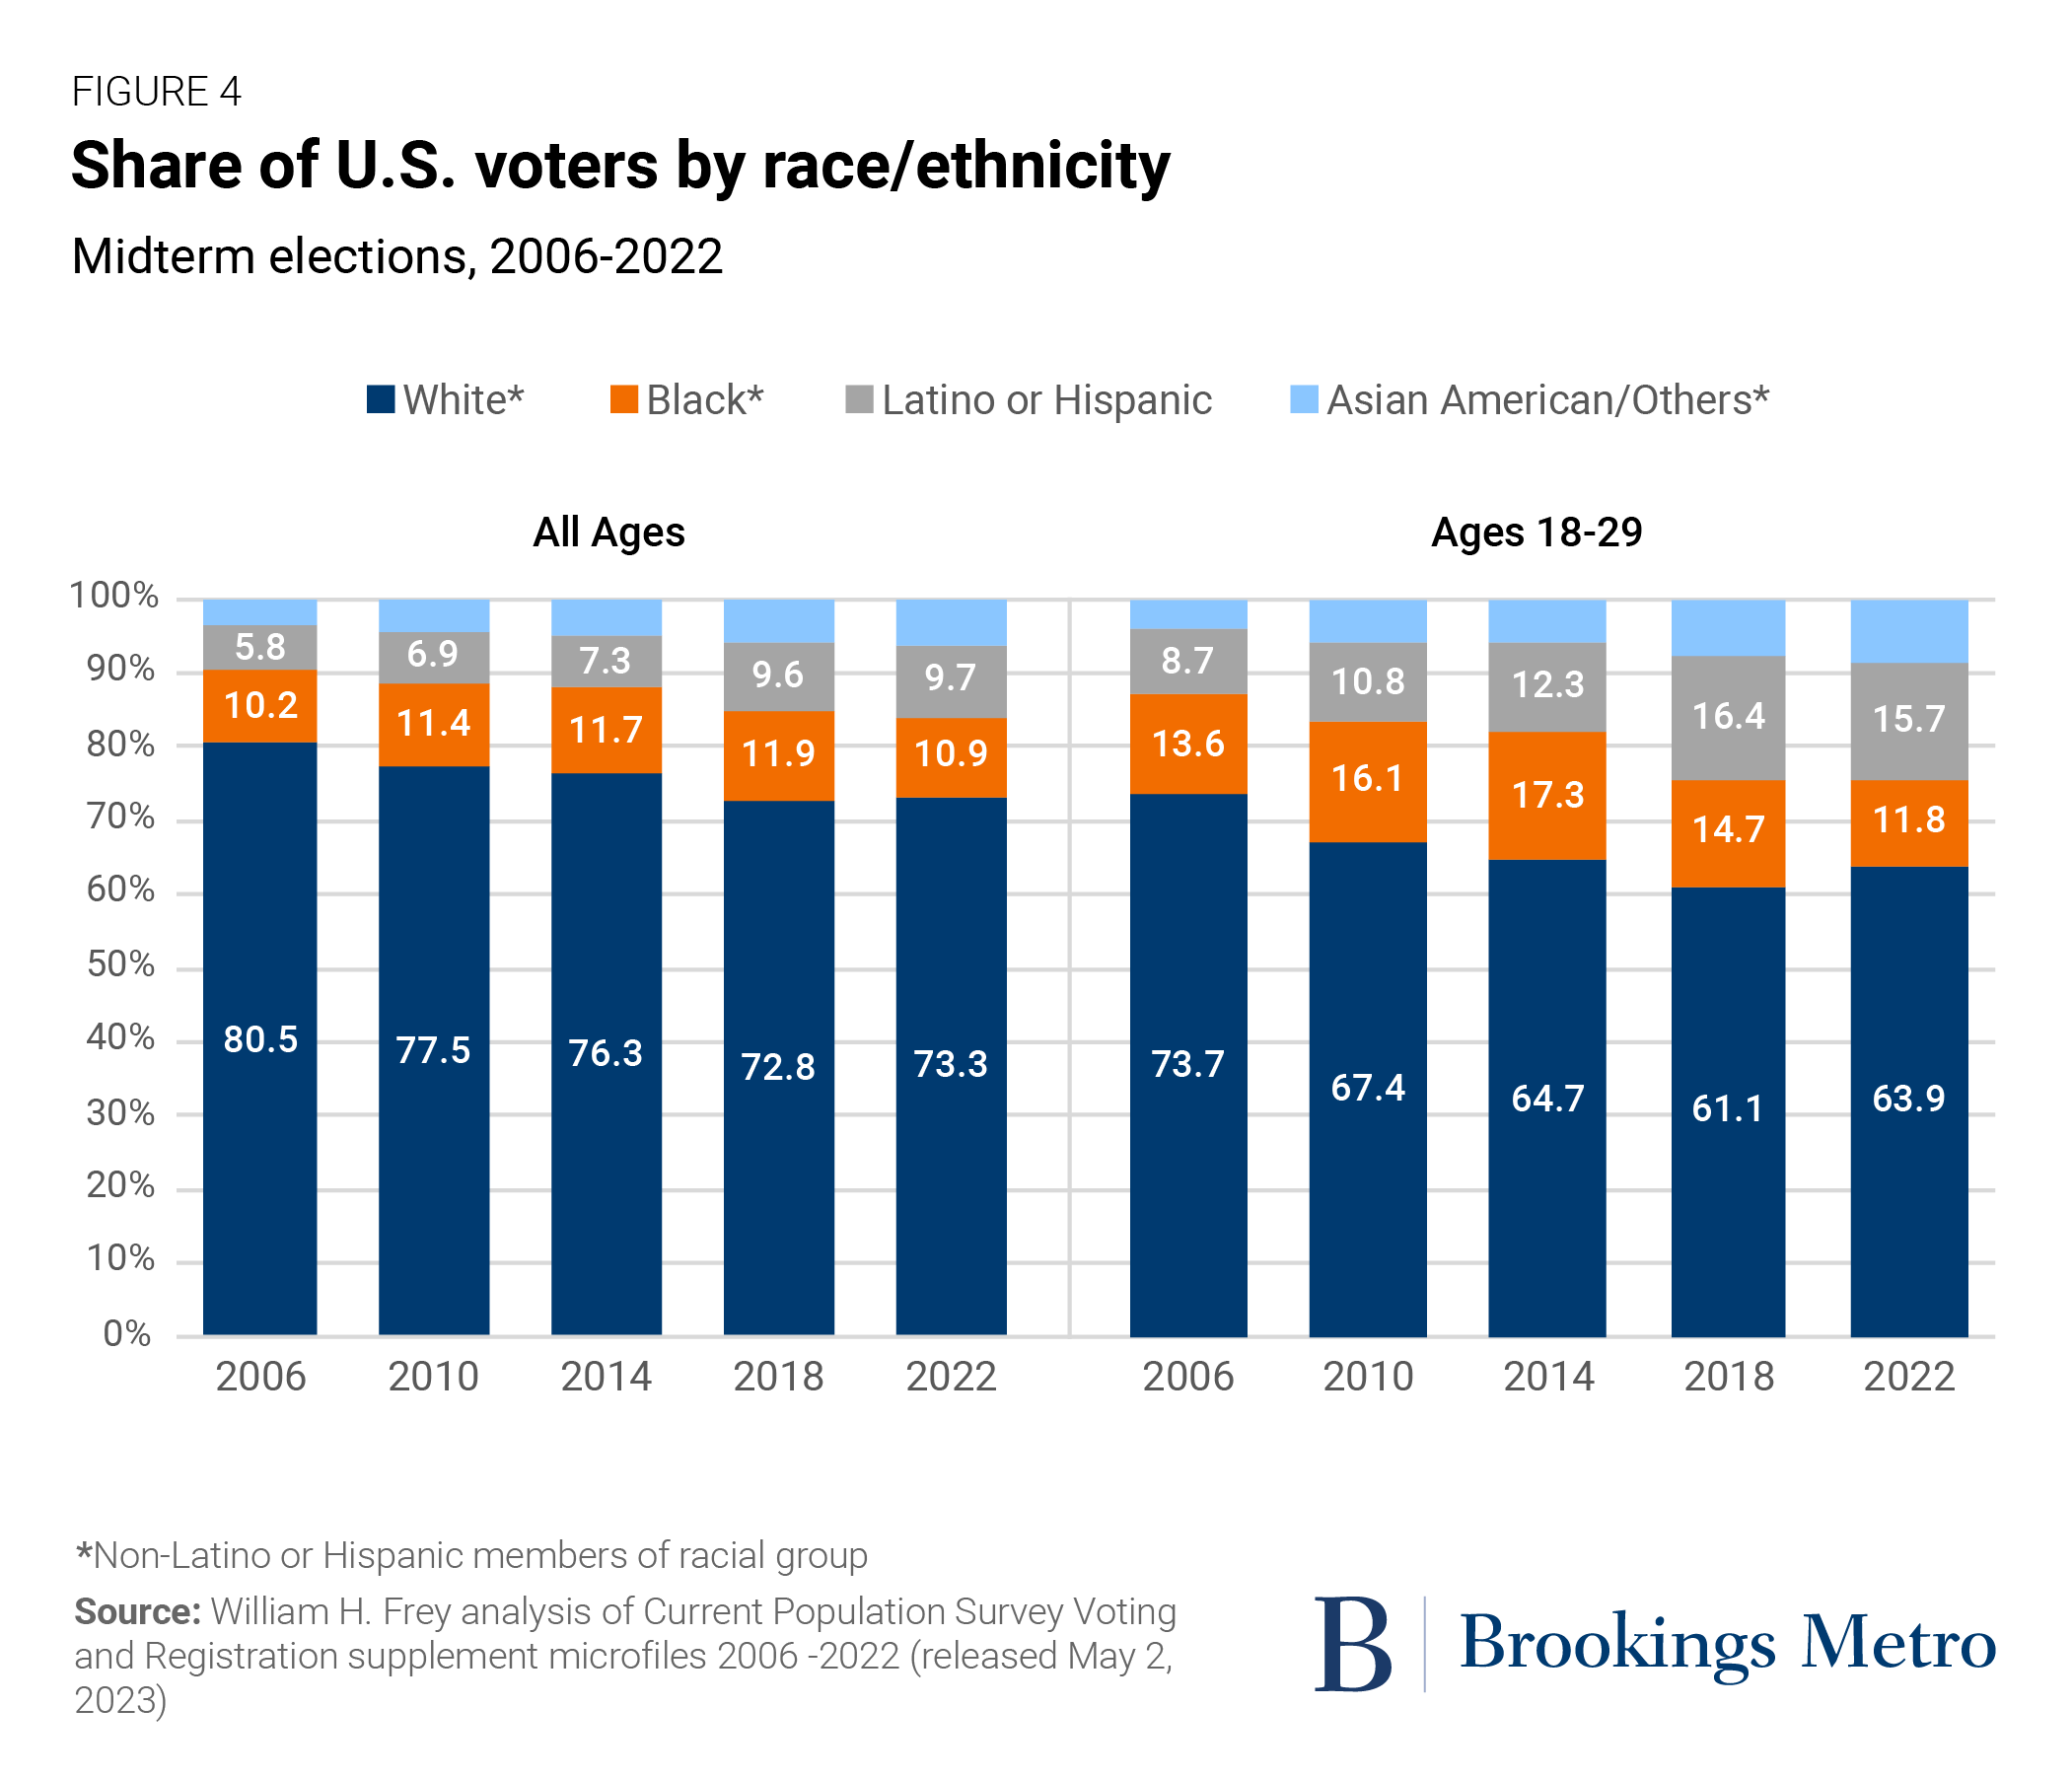
Still, despite 2022’s downtick in nonwhite voters, the long-term shift in the voting population’s racial makeup yields a smaller white voter population. Between 2006 and 2022, the white share of the voter population declined from 80.5% to 73.3%. Among the highly diverse 18- to 29-year-old population, the white voter share declined from 73.7% in 2006 to 63.9% in 2022.
Finally, in terms of the age structure of voters, it is clear that as the large baby boomer cohort continues to enter the 65-and-older age group—and as older voters continue to turn out at high rates—that group’s voter share has risen from 22.5% in 2006 to 30.4% in 2022 (download Table B). Yet shifting turnout levels are also seen for younger age groups. For example, the turnout rise for 18- to 29-year-olds between 2014 and 2018 helped to increase that group’s voter share from 10% to 13.8%. The subsequent turnout decline between 2018 and 2022 lowered that group’s voter share to 11.7% in the most recent midterms.
Turnout changes in 2022 varied across states
The national turnout rate decline between 2018 and 2022 does not apply to all states. Because 2022 was a midterm election, some state elections for senators, governors, House members, and other local positions as well as ballot initiatives may lead to sharp rises in voter interest and, therefore, turnout. Moreover, organizations such as the Brennan Center for Justice have been monitoring laws in several states that have the effect of suppressing the voting rights of certain groups, including young people and racial minorities. Meanwhile, other states have adopted measures to expand voting opportunities.
Among all 50 states plus Washington, D.C., 21 registered increases in voter turnout between 2018 and 2022. This was led by Oregon, a “motor voter” state that also had the highest overall turnout rate in 2022 (download Table C). The Census Bureau statistics show that 30 states saw turnout declines, led by North Dakota. Of the nine states which showed at least a 5-point turnout decline, five are located in the South: Alabama, Mississippi, North Carolina, Tennessee, and West Virginia. Moreover, nine of the 10 states with the lowest 2022 turnout rates are also in the South, led by West Virginia.
Far fewer states—just nine—registered midterm turnout increases between 2018 and 2022 for their 18- to 29-year-old populations. Still, in all 50 states, this group’s 2022 turnout rate was higher than in 2014 (download Table D). Among the nine states that saw 2022 turnout increase for young voters were the battleground states of Michigan, Wisconsin, and Pennsylvania. These states were also among those with the top 10 2022 turnout rates for 18- to 29-year-old eligible votes, a list that also includes Washington, D.C., Minnesota, Colorado, and Georgia.
Only 11 states saw 2018-2022 turnout increases for nonwhite voters, including New Mexico, Michigan, Pennsylvania, Nevada, and Washington, D.C. (download Table D). In 17 states, 2022 nonwhite turnout rates were lower than in 2018 or 2014. Among the latter are southern states Arkansas, Louisiana, Kentucky, Mississippi, North Carolina, and South Carolina; midwestern states Indiana, Iowa, Nebraska, North Dakota, and Ohio; northeastern states Maine, Connecticut, and New Hampshire; and western states Alaska, Colorado, and Wyoming.
In contrast, 27 states saw 2018-2022 turnout gains for white voters, and in all states except Louisiana, 2022 white turnout rates exceeded those in 2014 (download Table D). Among the states with greatest white turnout increases were Vermont, Oregon, New Mexico, Pennsylvania, Georgia, and Colorado.
Focusing on turnout and voter shifts in battleground states
To get a better sense of how states varied in turnout for select Democratic- or Republican-leaning demographic groups, it is useful to focus on “battleground” states with visible statewide elections in 2022.
The first focus will be on three northern battlegrounds: Pennsylvania, Michigan, and Ohio (see Figure 5 and downloadable Table E). Democrats had a successful midterm election in Pennsylvania, taking the governorship and an open Senate seat. In Michigan, Democrats won in the gubernatorial election and passed a Right to Reproductive Freedom Initiative (Ballot Proposal 3). However, in Ohio, Republican candidates won both the gubernatorial and Senate elections.
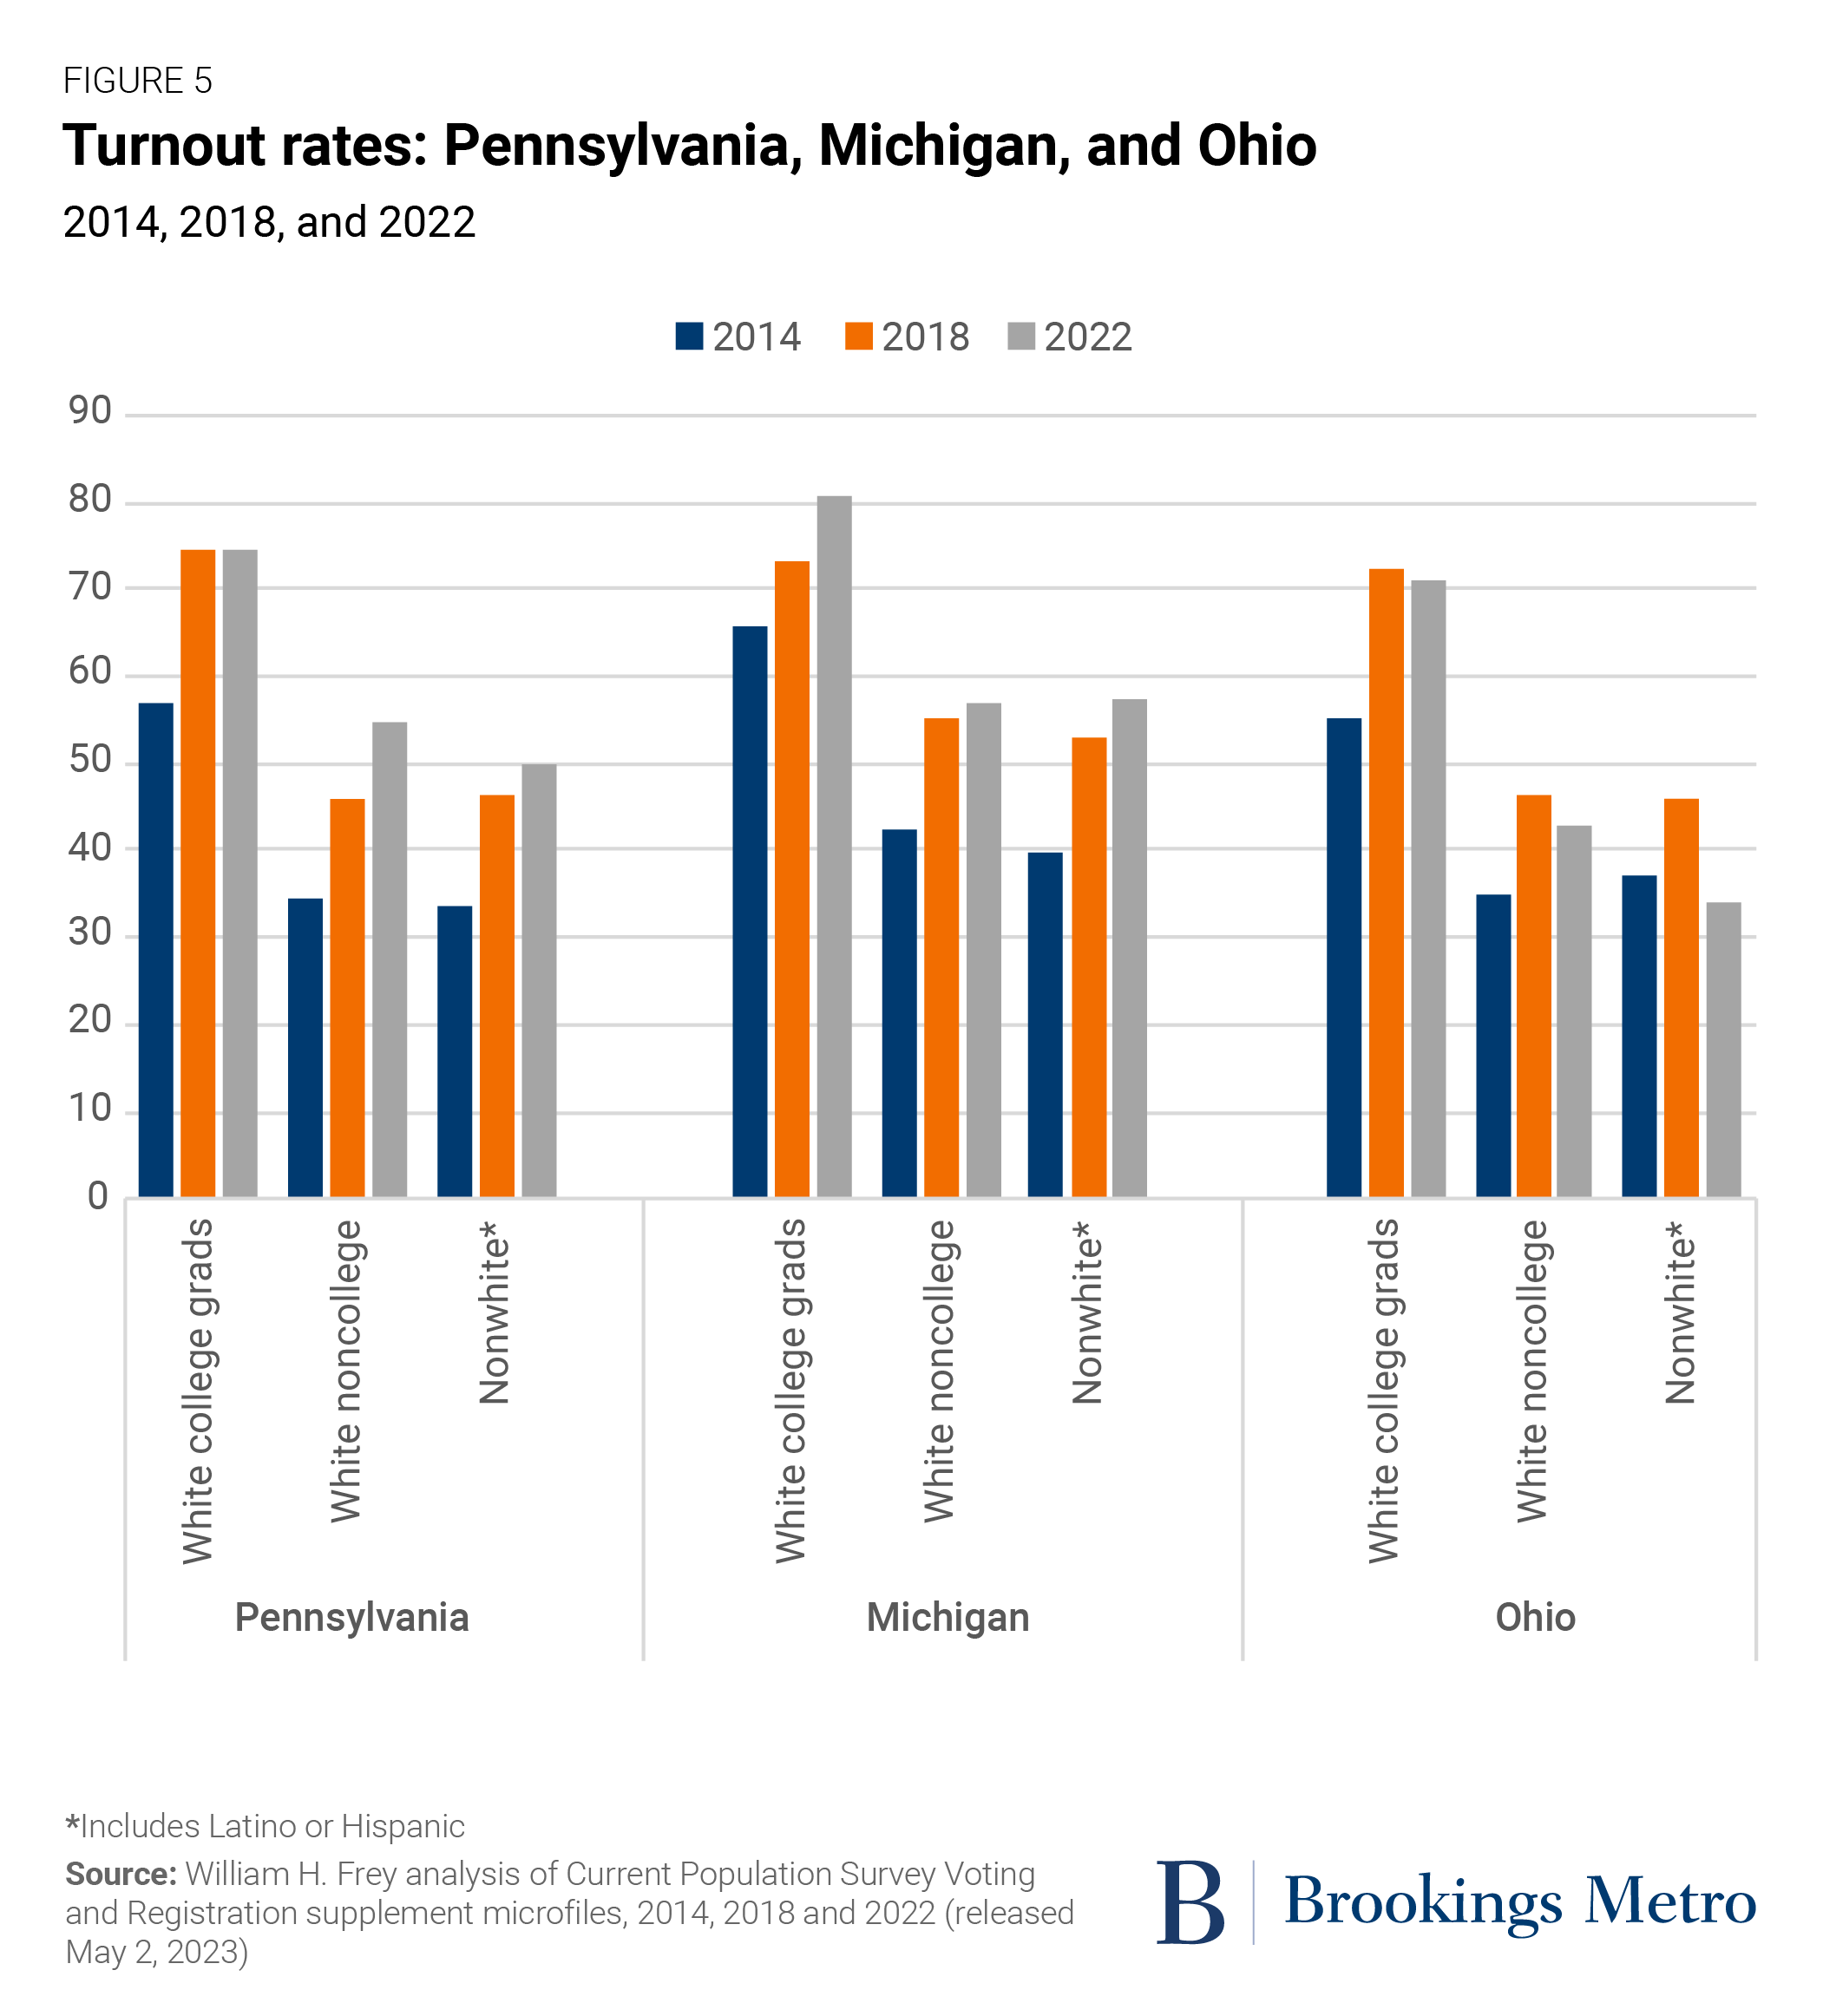
In terms of turnout, Pennsylvania stands out not only because of its total turnout increase between 2018 and 2022, but the turnout gains for several demographic groups, including nonwhite eligible voters and white noncollege eligible voters as well as the lack of change in the continued high turnout for white college graduates. Among specific groups, turnout gains were registered by all age groups, both sexes, and white, Black, and Latino or Hispanic Americans (download Table E). Clearly, turnout increases in key Democratic voting groups contributed to the success of the party’s candidates in the Keystone State.
Michigan’s success in re-electing its Democratic governor and ballot proposal securing abortion rights was bolstered by its substantial turnout increases among key Democratic-leaning groups: white college graduates and nonwhites, along with especially strong turnout increases among 18- to 29-year-olds, women, and Black and Latino and Hispanic voters.
Ohio stands in contrast to the prior two states due to its lower turnout in 2022, as well as across most demographic groups. Especially noteworthy is its low turnout for nonwhite voters, particularly Black voters, to below levels in 2014 and 2018. There was even a turnout decline for white noncollege eligible voters. Thus, it appears that Ohio’s Republican victories were not dependent on increased turnout in any major demographic group.
The second focus is on three Sun Belt states: Georgia, Arizona, and Florida (see Figure 6 and downloadable Table E). Georgia had a split outcome, with Republicans winning the governorship and the Senate seat close enough to be determined by a later runoff election. In Arizona, Democratic candidates won both the governorship and the Senate seat. And in Florida, Republicans were victorious in both of those offices.
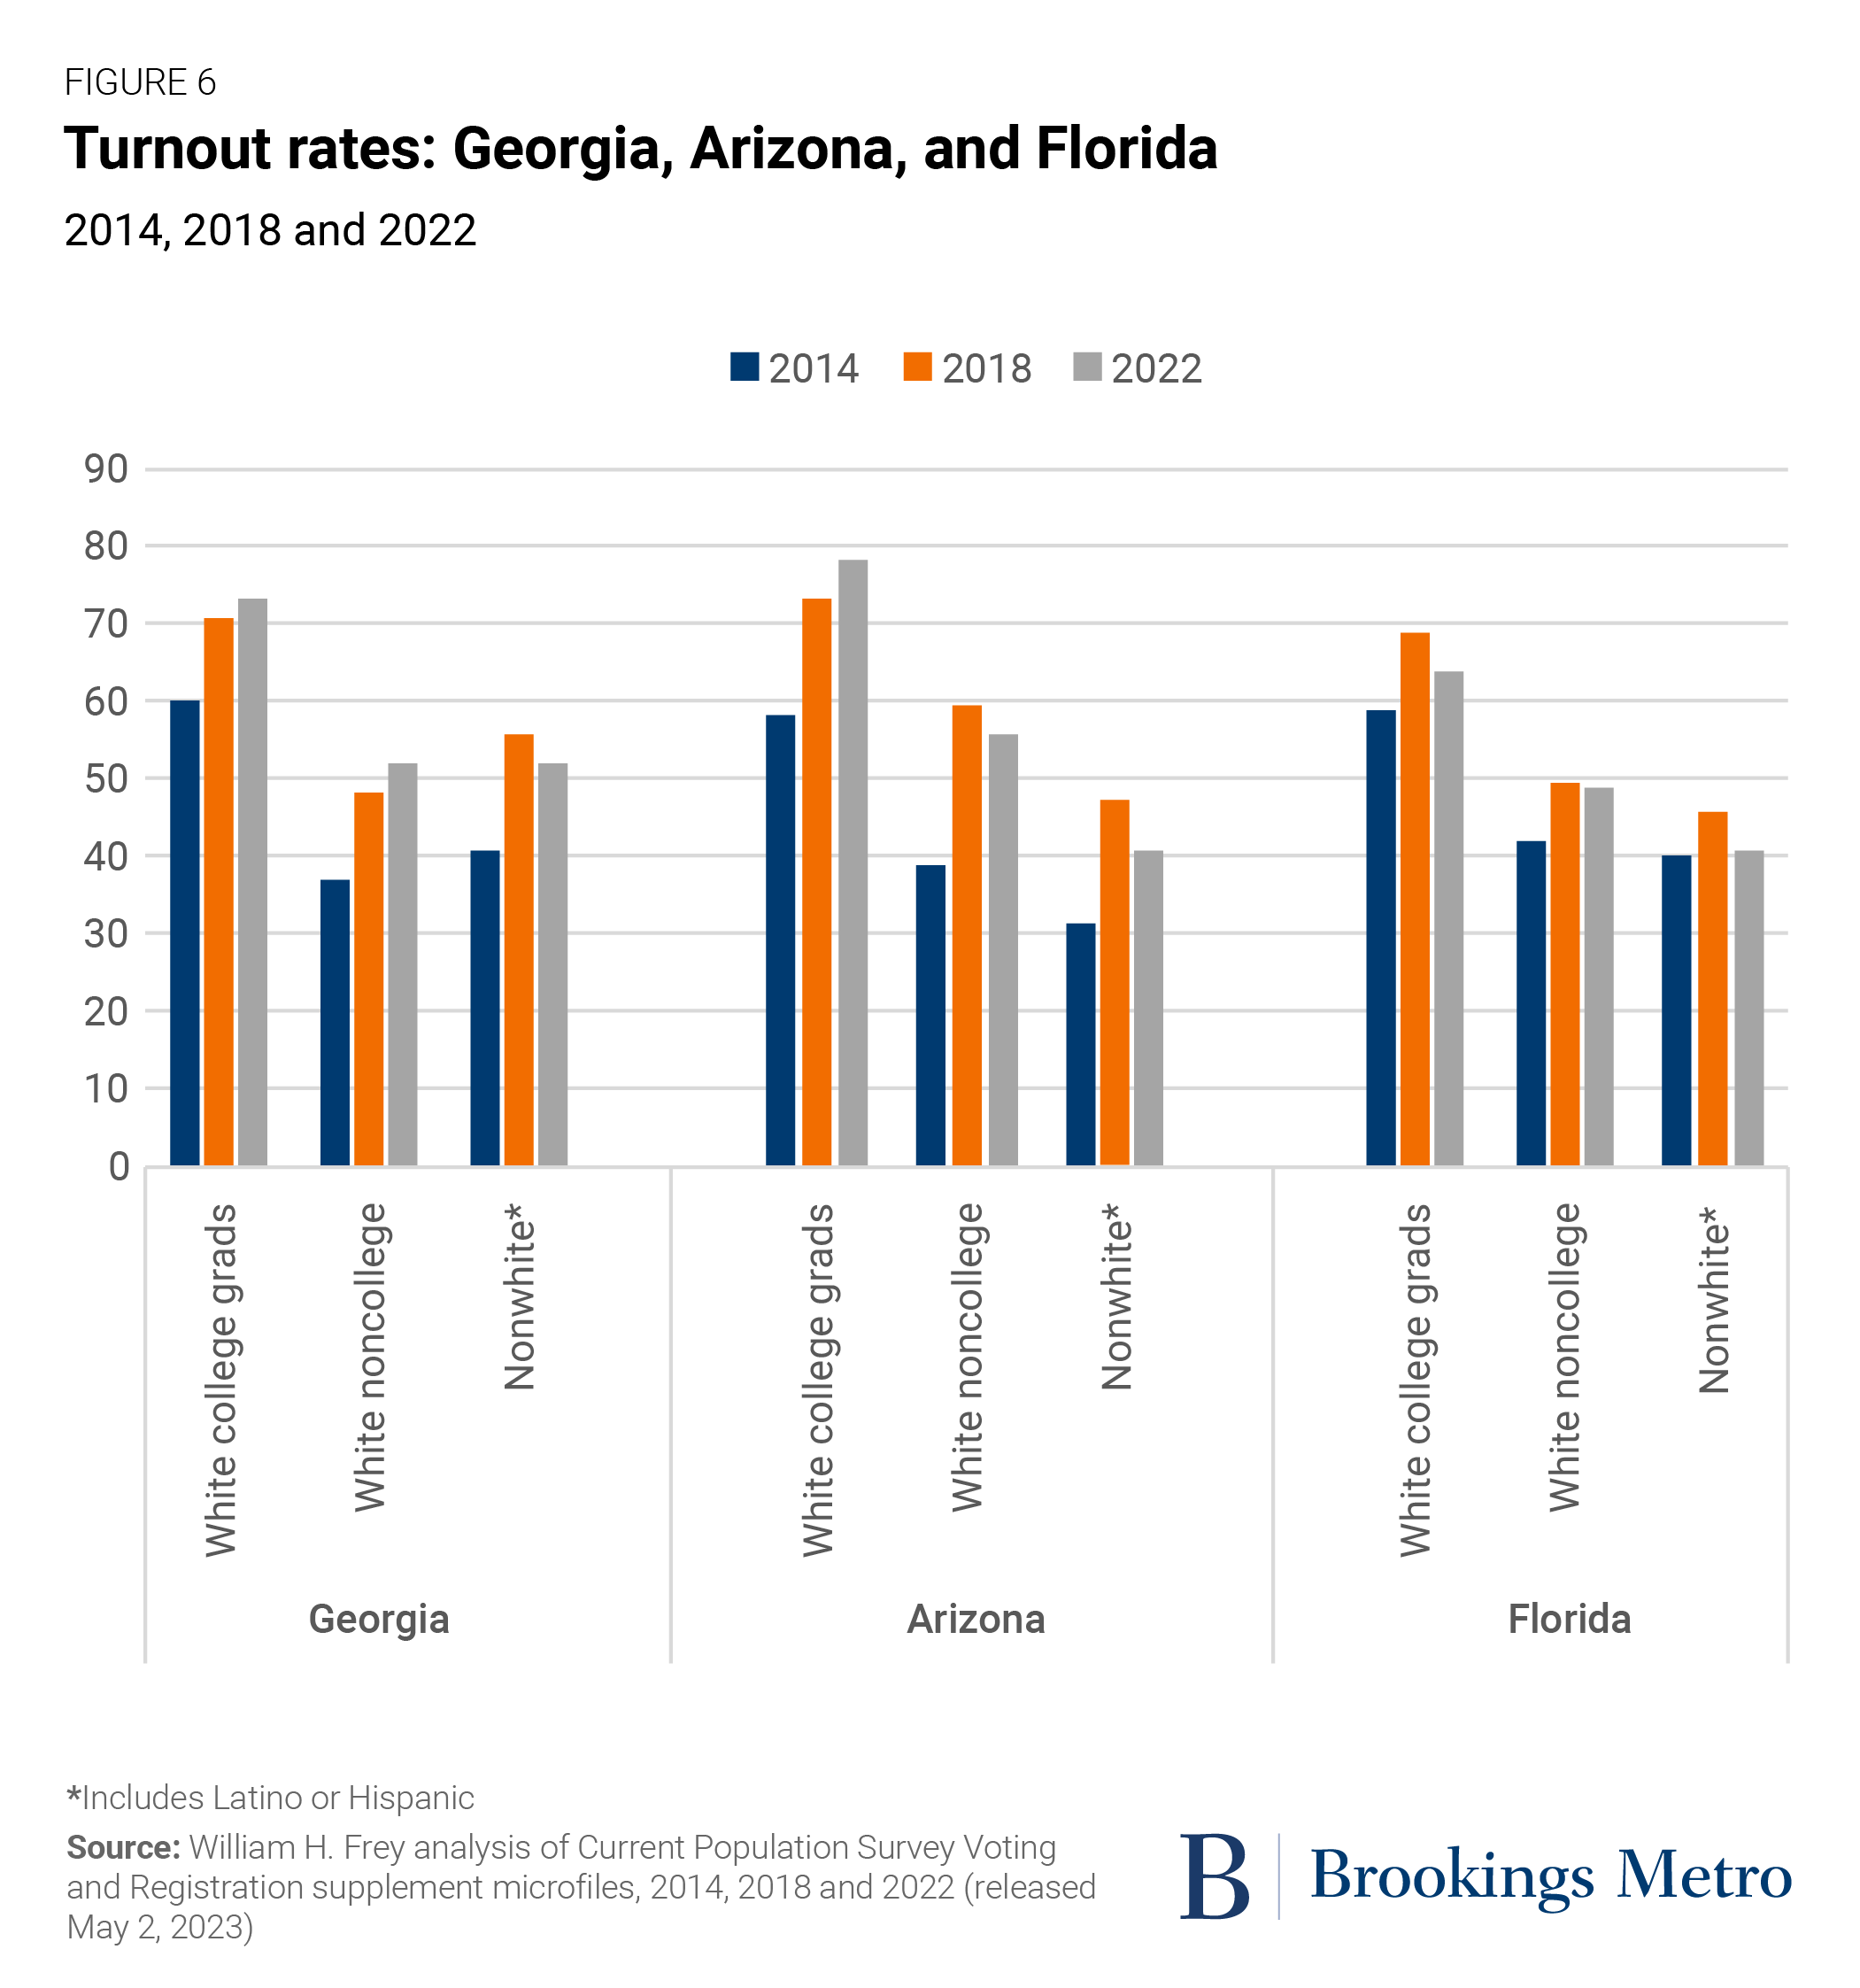
Georgia had a modest overall increase in turnout between 2018 and 2022, with gains in white college graduate and white noncollege eligible voters. And though there was a turnout decline among nonwhite voters, its 2022 nonwhite turnout rate still ranks fourth among all states. Moreover, despite a small 2018-2022 decline in its 18- to 29-year-old turnout, Georgia ranked 10th among all states in youth turnout. These patterns, along with strong partisan voting margins for Democrats (among young and minority voters) and Republicans (among white noncollege voters) contributed to the “split” outcome in last November’s election.
Arizona and Florida, though showing different election outcomes with respect to party wins, both displayed overall downturns in turnout as well as 2018-2022 downturns among white noncollege and nonwhite eligible voters. Arizona differs only in its gain among white college-educated voters, in contrast to Florida’s decline. The differences in their election outcomes may have more to do with the voting preferences of voters who did vote, rather than turnout per se, with Florida showing very strong Republican support among white noncollege and Latino or Hispanic voters. In Arizona, white college graduates along with young people voted strongly Democratic.
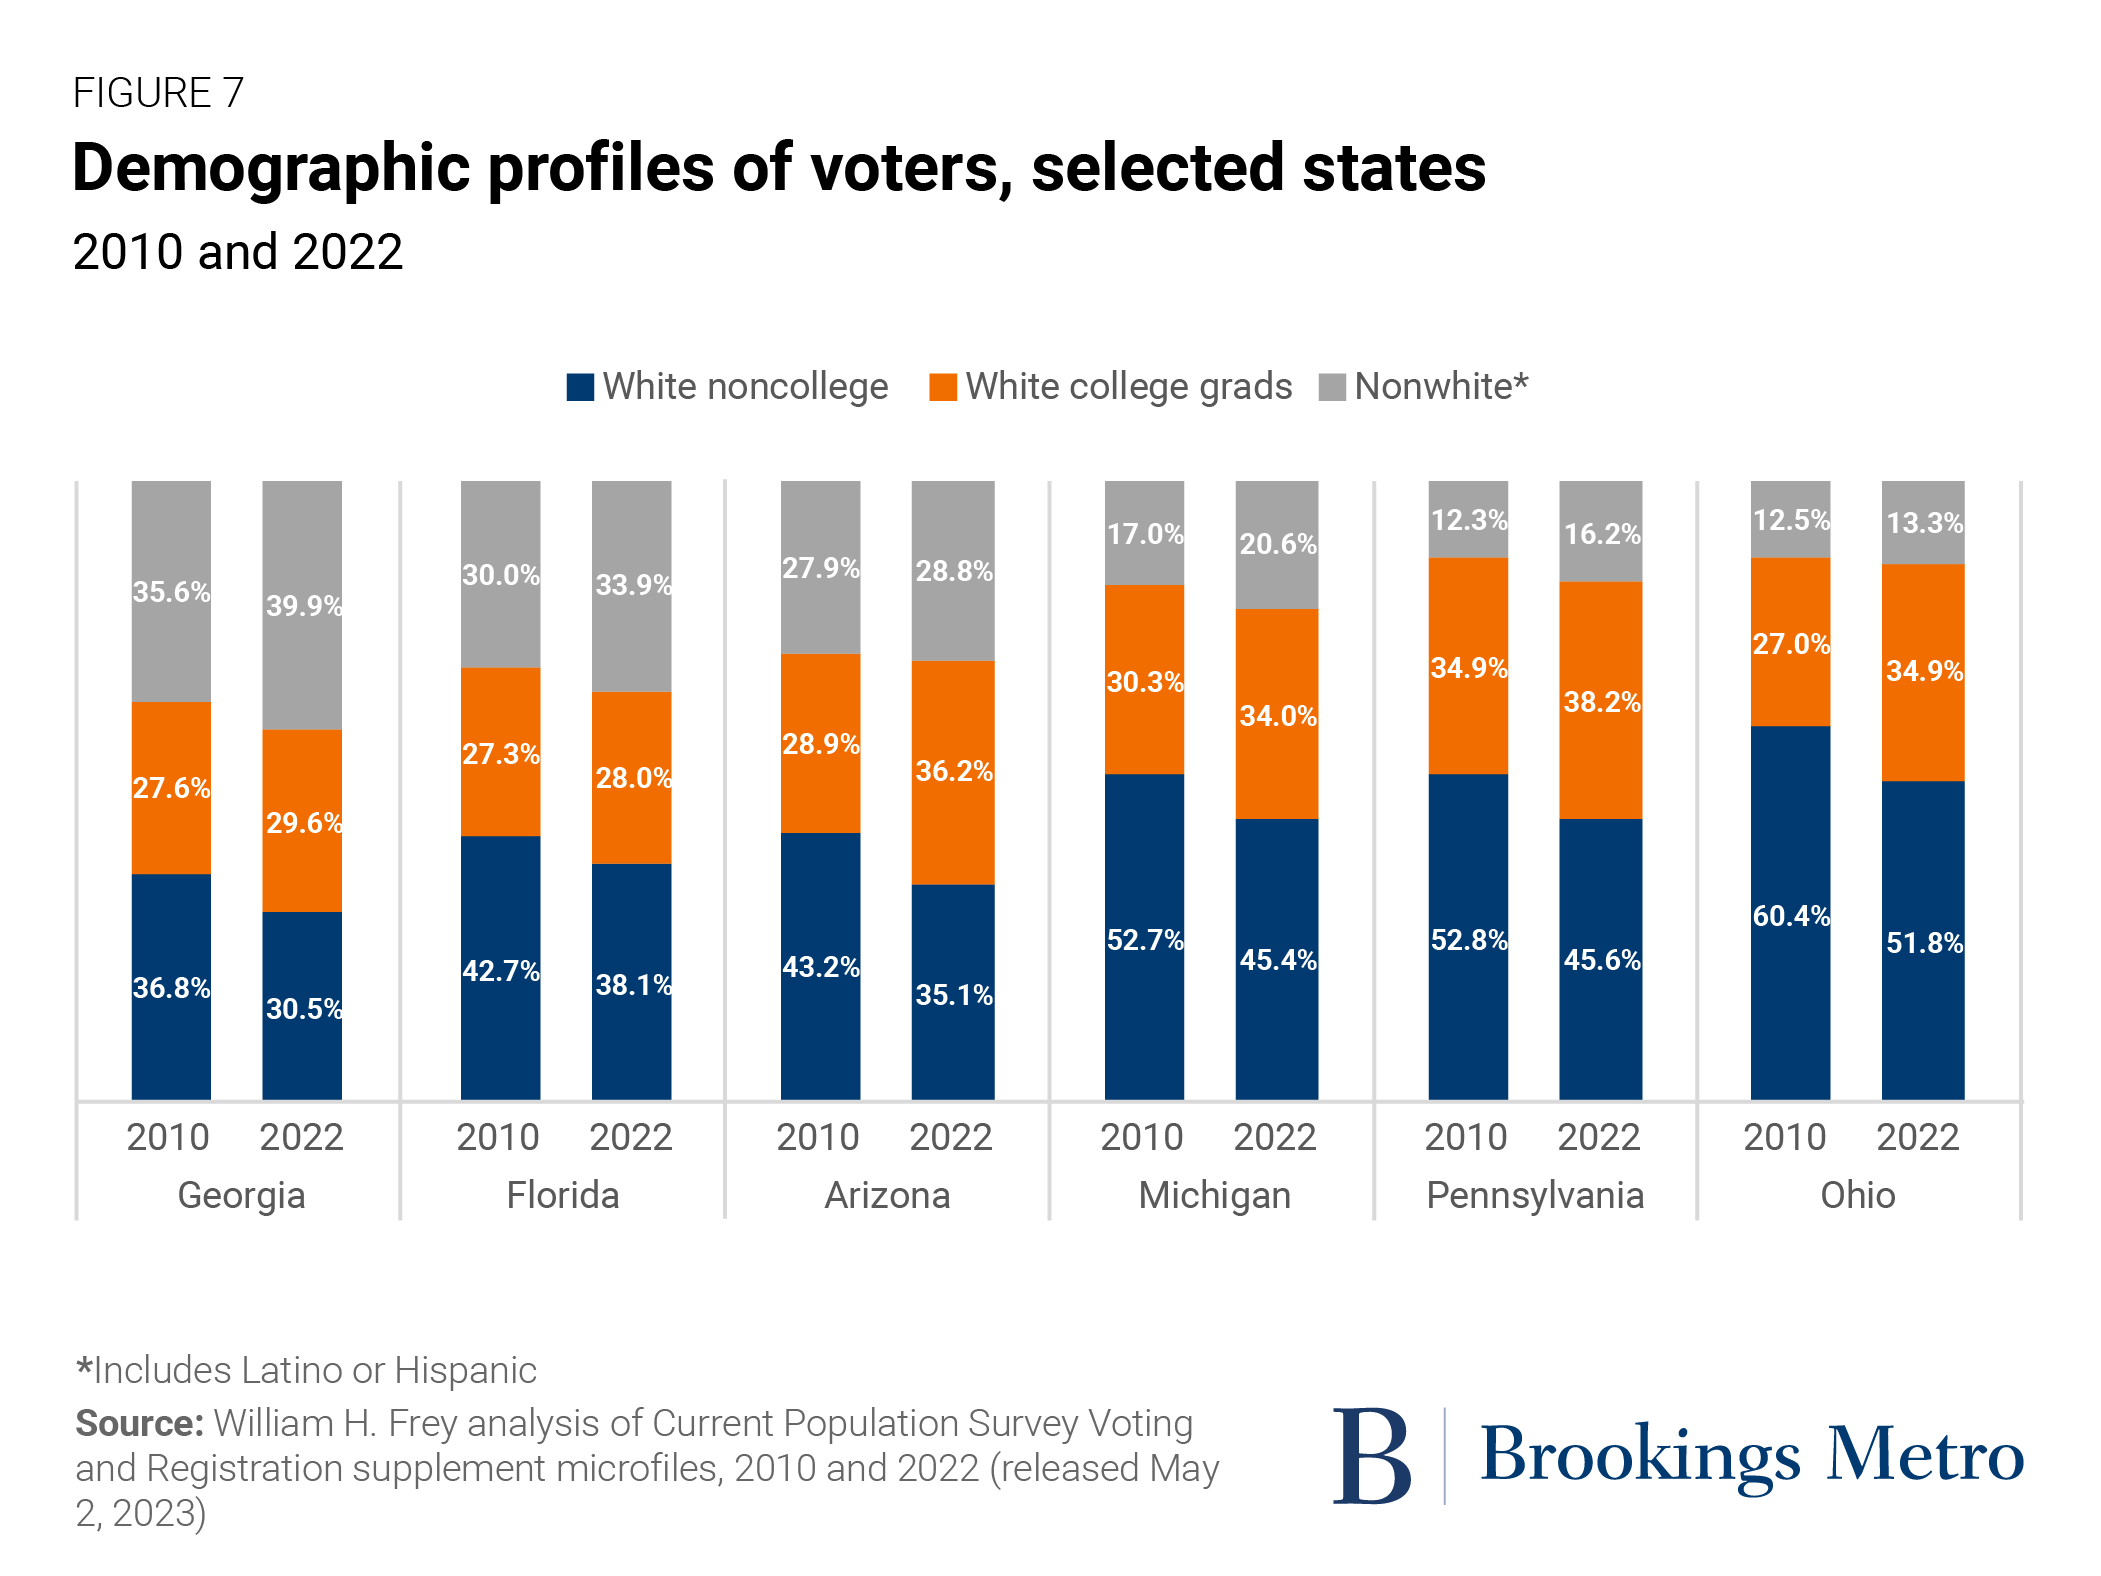
Still, the voter demographics in each of these states—both northern and Sun Belt—are broadly changing. Between 2010 and 2022, all six states displayed sharp declines in their white noncollege voters (with this group no longer dominating electorates in Michigan and Pennsylvania and will soon represent less than half of voters in Ohio) and gains in white college-educated and nonwhite voters.
Looking at demographic changes nationwide during this period, 49 states plus Washington, D.C. showed declines in their white noncollege voter shares (download Table F). Each state differs in the relative sizes of their white college graduate and nonwhite populations based on the growth of their Latino or Hispanic, Black, and Asian American voter populations. But despite small changes in turnout rates, broad demographic shifts will continue to effect change in each state’s voter population.
What these turnout patterns mean for future elections
This analysis of new Census Bureau voting data makes two insights clear. First, national voting turnout is on the rise—well above the low turnout levels of 2014 and earlier. And even if midterm voting turnout took a slight dip between 2018 and 2022, national voting levels and those of most demographic groups did not sink to levels seen in 2014 or earlier.
Related Books
Second, there are notable variations in turnout across states both overall and among demographic groups. This was especially noticeable among young voters and people of color, who showed turnout increases in most states between 2014 and 2018 but in only a handful of states in between 2018 and 2022. This may be crucial in future elections, as these groups were instrumental in determining the results of the 2020 presidential election and 2018 and 2022 midterm elections.
Whether the recent decrease in turnout for these largely Democratic-leaning groups was due to a waning interest in the 2022 midterms or other factors such as state-imposed restrictions that could lead to longer-term voter suppression of these groups remains to be seen. It is nonetheless clear that the relative turnout levels of all groups will contribute heavily to midterm and presidential elections in the future.
Author

-
Footnotes
- This report is based on analysis of U.S. Census Bureau Current Population Survey Voting and Registration supplement microfiles for the November 2022 midterm elections (released May 2, 2023) and earlier midterm elections. These data are estimates based on reported voting and may differ from vote counts reported by states.
The Brookings Institution is committed to quality, independence, and impact.
We are supported by a diverse array of funders. In line with our values and policies, each Brookings publication represents the sole views of its author(s).


Commentary
New voter turnout data from 2022 shows some surprises, including lower turnout for youth, women, and Black Americans in some states
May 18, 2023