Over the last six months, we have been conducting research at Brookings that looks closely at the ways that climate change might create financial instabilities. We’ve found that markets are flying blind when it comes to how the physical impacts of climate change could alter the value of some stocks and undermine the fiscal integrity of communities that are most exposed to climate change. These impacts could have striking consequences — if places get so hot that they are unlivable, then the local tax base will wither.
Analysts have known about these problems, in theory, yet operated on the assumption that it was impractical to forecast climate impacts with enough precision. Climate models run globally, with coarse resolution, and downscaling the results to particular places and firms was far beyond what the models could handle. Worse, it was hard to connect the estimates of climate impacts on hand with assessments of possible damage to assets, such as roads or buildings.
A new paper out this month offers fresh evidence that it’s possible to do much better analysis of how the physical impacts of climate change could affect communities, property, and infrastructure. The analysis comes from a leading catastrophic risk modeling firm, AIR Worldwide, whose tools are widely used in insurance and other industries. Unlike yet another academic study, it will be hard for financiers to ignore this latest analysis.
Quantifying the problem
AIR zeroes in on one of the most visible, deadly, and costly natural disasters: hurricanes. The full list of natural disasters that could be affected by climate change is long, but hurricanes are one good place to start. According to the National Oceanic and Atmospheric Association (NOAA), major hurricanes typically cost about $20 billion on average. They also account for seven of the 10 largest natural disasters since 1980.
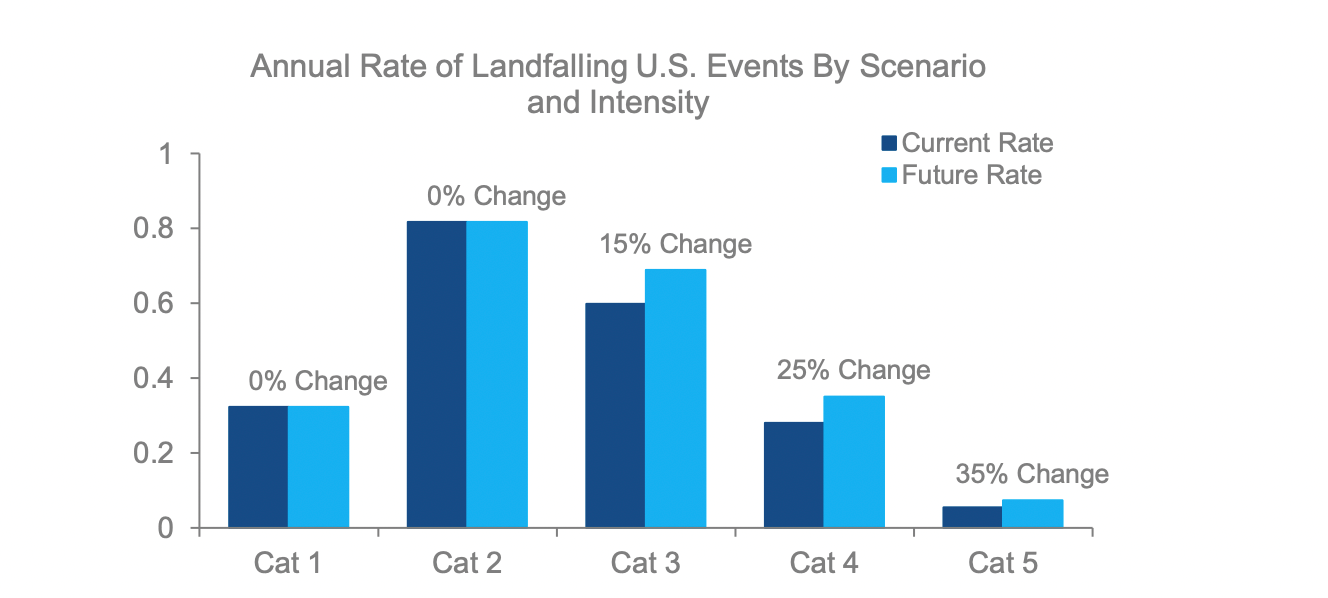
Doing this analysis requires simulating thousands of hurricane tracks and selecting a catalog sample that is calibrated for the effects of climate warming, in this case using models that assume little change in the emissions trajectory through 2050. The best hurricane science suggests that the main effects of climate change will be to create higher sea surface temperatures, which will feed stronger storms. As shown in the figure below, which is calibrated to that science, the AIR catalog envisions a strong uptick in Category 4 and 5 storms in particular.
Figure 1: Projected changes to annual U.S. hurricane landfall rates by category, by 2050
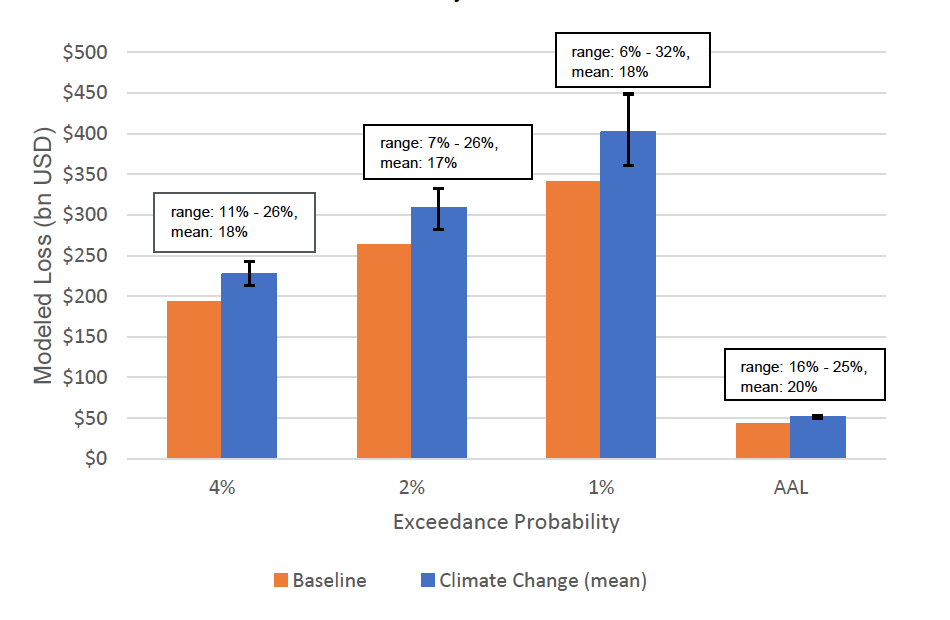
Stronger storms mean a rise in the damage: The annual average loss increases by about one-fifth by mid-century. More worrisome, though, is that the probability of mega-storms will rise as well, resulting in an increase of total annual losses. In the insurance world, these extreme outcomes are described using the concept of “annual exceedance probability” — that is, the chance that total losses in a year will exceed some level of damage.
In a world of climate change, shown on the blue bars below, any given year has a 1% chance of total annual losses exceeding $400 billion in the U.S. And this modeled loss only includes direct loss, and loss of use, of exposures such as residential, commercial, and industrial properties, and automobiles; and excludes non-modeled losses such as public infrastructure and indirect losses such as lost wages and economic productivity. If that sounds like an astronomical number, it is. To put this number into perspective, the highest annual loss years over the last 100 years were 2005 and 2017, which NOAA estimates generated total losses of $224 billion and $278 billion respectively. Some other historical years, when adjusted to current property values and exposures, would have produced aggregate losses over $100 billion, but only the largest events in those years have been examined. For instance, AIR estimates that the Great Miami Hurricane of 1926 (the largest hurricane on record in the U.S.) could produce total losses in excess of $150 billion if it were to recur today. Developing estimates for present-day views of the earliest historical events is a significant challenge, as it is hard to quantify changes in the number and value of properties at risk and changes in insurance and economic conditions.
Figure 2: Projected rise in annual losses from U.S hurricanes by 2050
In addition to stronger storms, a warmer world brings higher sea levels, and the AIR study looks at how these two effects compound. Sea level rise can increase storm surge damages by a factor of two for exposed cities such as New York, Miami, and Houston, and make a 1-in-50-year event today more like a 1-in-30-year event by 2050.
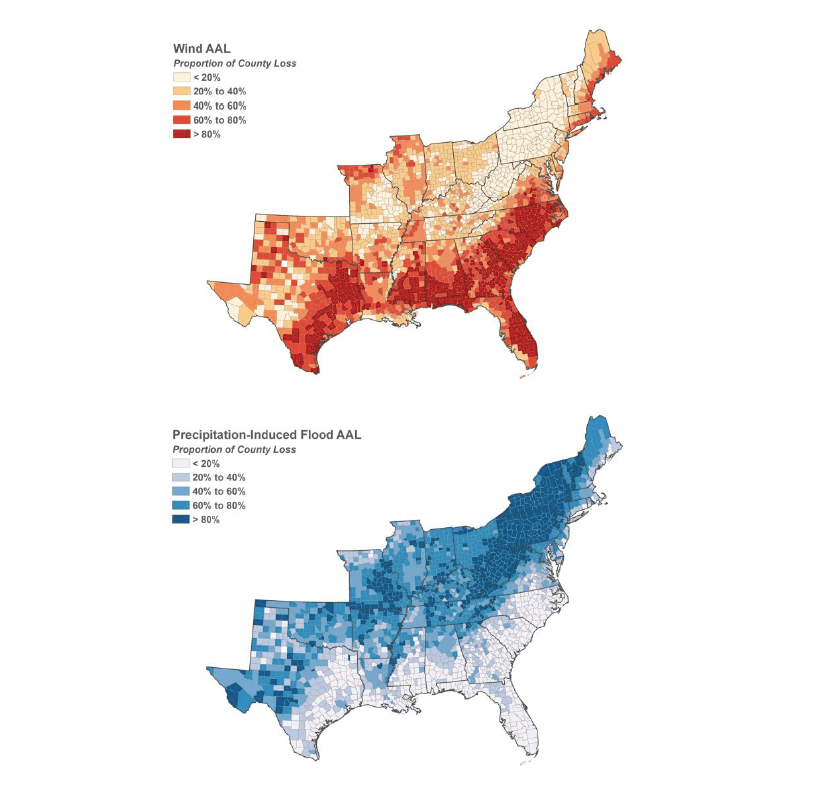
So far, so bad. But considering how these storms propagate inland is even more interesting. Sure, stronger storms will batter coastlines that are already battered. But what is surprising are the losses that extend inland through more severe flooding. The states affected aren’t the usual poster children for hurricane damage and include Missouri, Kentucky, Tennessee, Arkansas, West Virginia, and Pennsylvania.
Figure 3: Geographic distribution of projected future hurricane losses from wind (top) and precipitation-induced flooding (bottom)
Figuring out what all this might cost is hard because it requires combining insights into natural hazards (wind, flood, and storm surges) with valuation and damage of the assets in nature’s path. The AIR study methodology held constant the values of assets to isolate climate change impacts in the future. In recent decades, the cost of hurricanes has soared not because hurricanes are stronger but the value of what’s flattened and flooded has been rising. Based on migration and rising incomes alone, the value of U.S. coastal property exposures grew 27% from 2012 to 2018. That kind of explosive growth seems likely to continue. All told, if coastal property values continue increasing at the 4% per annum rate of recent years, coupled with stronger storms and higher storm surges, it is entirely plausible that losses will rise by a factor of three for exposed coastal metro areas by 2050 versus today.
For all the importance of this study, AIR is hardly alone. A growing number of open-source and academic studies have set the building blocks of analysis needed to understand climate related hazards such as sea-level rise, wildfire, and flood risk — at the levels of granularity needed to draw links to the financial system. These efforts have discovered that climate impacts are already being felt in the housing market, where one study found that houses exposed to sea-level rise trade 7% lower than those that are not. Organizations like First Street Foundation seek to provide accurate, granular, and transparent flood information to U.S. homeowners. Similar scientific advances are also occurring in the study of wildfire, making it easier to understand the links between climate change and the increasingly destructive wildfire seasons on the West Coast.
In the private sector as well, an emerging sector of analytics firms is targeting companies concerned about their climate risk exposure. Companies like 427, risQ, and Jupiter Intelligence overlay climate models with proprietary datasets to develop climate risk scores that, in turn, can make it easier to understand where financial instruments are exposed. These tools, both private and public, show a way forward, but they are far from the final word. The AIR study, for example, looks only at first-order effects — that is, increased frequency of major storms. The next thing that is needed is more modeling of the unique ways that storms behave — including the tracks they may follow, and the devastation in their path — under warmer conditions, along with how investments to reduce vulnerability affect likely damage.
Towards solutions that can last
If the tools are now coming into focus, what should policymakers do? To start, they should develop accepted methodologies for deciding when physical impacts of climate change are material, and then set stronger rules for meaningful disclosure of those risks. The private sector, on its own, is now disclosing more information on the risks to firms as they transition from high-carbon to low-carbon futures. More such disclosure is needed from firms and governments about their exposures to the physical risks of climate change — disclosures that are robust, quantitative and specific. The AIR study, and others, show that an array of organizations sit ready to supply that market, and care will be needed to compare these tools and evaluate their application in measuring the physical impacts of climate change. The timing is fortuitous, since many firms and governments are focusing on practical ways to cut emissions and exposure to climate impacts — looking closely at which policy instruments actually work, not just treating climate change as some abstract topic that will be handled in the future.
There’s also a need at all levels of government to grapple more fully with how climate change will affect public assets, such as roads. A few communities are already far along in this process, such as Miami, the California Coastal Commission, and the tri-state area of New York, Connecticut, and New Jersey, which had the sledgehammer of wake-up calls from Hurricane Sandy in 2012. Such awareness, which is still rare, must spread more widely. One benefit of these modeling tools is that they help communities — and their bankers — understand that some of the places that will be hard-hit don’t know it, and that as this knowledge becomes more widely available, the perception of these communities’ riskiness will increase as well.
Climate change is hitting us, and we can do better. As the Biden administration takes office, it will be looking for ways that executive power can be applied to the climate crisis. Action in Congress seems a lot harder with the nation polarized and the Senate, regardless of what happens in Georgia, split. While there’s a lot of attention to the obvious climate-related agencies, like Environmental Protection Agency and Department of Energy, it’s the financial markets that will get most of industry to take notice. Getting those markets to reflect the real dangers of climate change — which the new AIR study helps to quantify — could well be the most important administrative actions that Biden’s team will take.





Commentary
New research exposes the harsh realities of hurricanes in a warmer world
December 21, 2020