India has just released its official consumption expenditure data for 2022-23, providing the first official survey-based poverty estimates for India in over ten years. The previous official survey was conducted from 2011-12, and the absence of up-to-date data for India has added considerable uncertainty to global poverty headcount ratios.
Before presenting the results, a quick methodological note is in order. India has two different methods for estimating consumption expenditures: the Uniform Recall Period (URP) and the more accurate Modified Mixed Recall Period (MMRP). The URP method asks households questions on their consumption expenditures over a uniform recall period of 30 days. The MMRP asks household consumer expenditure on perishables (for example, fruits, vegetables, eggs) for the last 7 days, durable goods for the last 365 days, and expenditure on all other items for the last 30 days. India officially shifted to the MMRP, the standard in other countries, beginning with the 2022-23 survey, though it previously experimented with both methods.
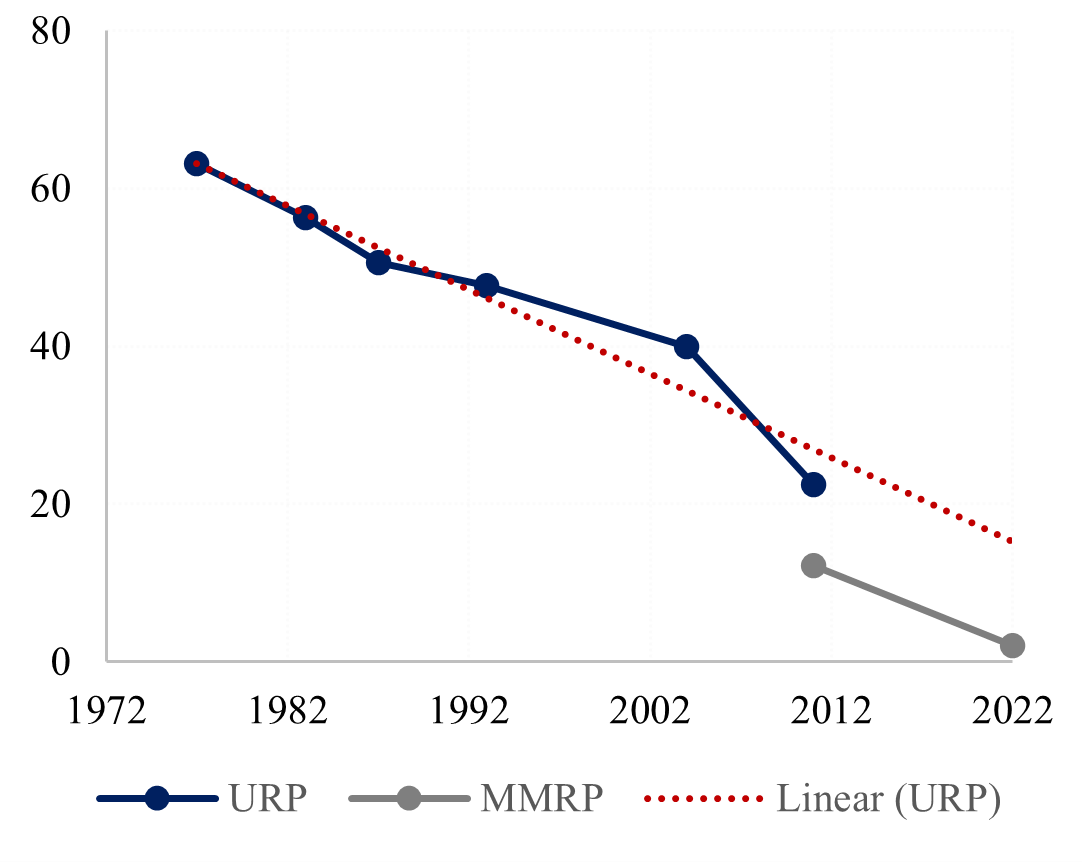
Comparable poverty estimates for India are available for the period 1977-78 to 2011-12 using the URP method and from 2011-12 to 2022-23 using the MMRP method for the purchasing power parity (PPP)$ 1.9 (international extreme poverty) and PPP$ 3.2 poverty lines (recommended line by the World Bank for lower middle-income countries such as India).
What do the data show?
Growth: Real per capita consumption growth of 2.9% per annum (pa) since 2011-12; rural growth at 3.1% pa was significantly higher than urban growth of 2.6%.
Inequality: An unprecedented decline in both urban and rural inequality. The urban Gini (x100) declined from 36.7 to 31.9; the rural Gini declined from 28.7 to 27.0. In the annals of inequality analysis, this decline is unheard of, and especially in the context of high per capita growth. We offer some explanations below on why this may have happened, but more work will be required to fully explore the issue.
Poverty: High growth and large decline in inequality have combined to eliminate poverty in India for the PPP$ 1.9 poverty line. (Here we use the PPP$ 1.9 line [2011 prices] rather than the PPP$ 2.15 line at 2017 prices because the former closely corresponds to the official India Tendulkar poverty line.) The Headcount Poverty Ratio (HCR) for the 2011 PPP$ 1.9 poverty line has declined from 12.2 per cent in 2011-12 to 2 per cent in 2022-23, equivalent to 0.93 percentage points (ppt) per year. Rural poverty stood at 2.5% while urban poverty was down to 1%. For the PPP$ 3.2 line, HCR declined from 53.6% to 20.8% (almost 3 ppt per year). Note that these estimates do not take into account the free food (wheat and rice) supplied by the government to approximately two-thirds of the population, nor utilization of public health and education.
The data show a strikingly lower number of poor people in India, at both thresholds, than those estimated by the World Bank. That institution relied on the Consumer Pyramids Household Survey, a privately provided data source, to derive poverty numbers of 10% (at $1.90) and 45% (at $3.20) in 2020, despite well-known problems with that data explained by Bhalla, Bhasin and Virmani (2022).
Time for a higher poverty line
In the chart below, we show India’s HCR for both the 1.9$PPP and the 3.2$PPP from 1977-78. The change in slope of the HCR for the higher 3.2$ poverty line reveals the extent of inclusive growth experienced in India over the last decade.
Poverty HCR (2011 PPP 1.9$)
Poverty HCR (2011 PPP 3.2$)
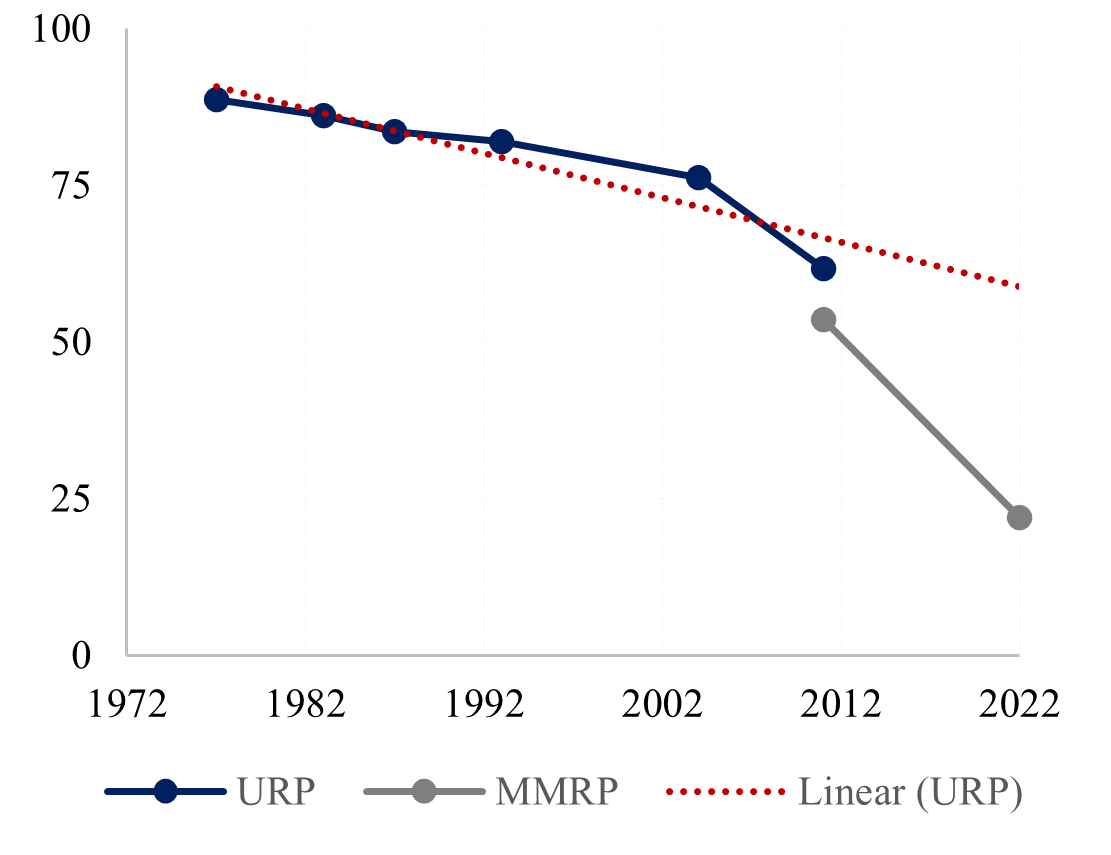
Given the near elimination of extreme poverty, we outlined the need for India to transition to a higher poverty line in an earlier article. The decline in HCR for both the poverty lines illustrates this point, as we can see not much decline can occur at the lower poverty line. Incidentally, the decline in HCR at the higher poverty line is remarkable given that in the past it took 30 years for India to witness a similar decline in poverty levels as now witnessed over 11 years.
How and why the results
The relatively higher consumption growth in rural areas should not come as a surprise given the strong policy thrust on redistribution through a wide variety of publicly funded programs. These include a national mission for construction of toilets and attempts to ensure universal access to electricity, modern cooking fuel, and more recently, piped water. As an example, rural access to piped water in India as of 15th August 2019 was 16.8% and at present it is 74.7%. The reduced sickness from accessing safe water may have helped families earn more income. Similarly, under the Aspirational District Program, 112 districts of the country were identified as having the lowest development indicators. These districts were targeted by government policies with an explicit focus on improving their performance in development.
Key takeaways
Official data now confirms that India has eliminated extreme poverty, as commonly defined in international comparisons. This is an encouraging development with positive implications for global poverty headcount rates. This also means that time has come for India to graduate to a higher poverty line much like other countries. The transition to a higher poverty line provides an opportunity to redefine existing social protection programs particularly with the objective of better identification of intended beneficiaries and providing greater support to the genuine poor.
Authors


The Brookings Institution is committed to quality, independence, and impact.
We are supported by a diverse array of funders. In line with our values and policies, each Brookings publication represents the sole views of its author(s).


Commentary
India eliminates extreme poverty
March 1, 2024