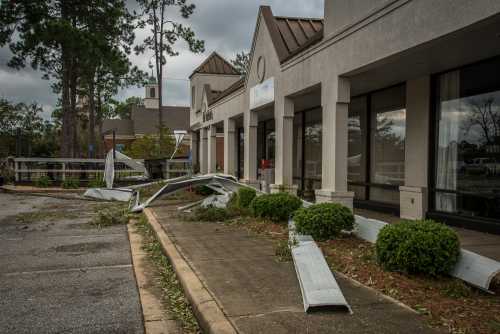


Across the U.S., more frequent and destructive climate events are impacting our day-to-day lives and communities. The physical, economic, and human costs of these events are increasing and becoming more obvious over time. The average annual damages from weather- and climate-related disasters jumped from $18 billion in the 1980s to $81 billion in the 2010s, and the 2020s are easily on pace to shatter that record.
Governments at all levels have a responsibility to help communities adapt to increasing climate risks. Local governments are on the front lines, as they regulate and incentivize the location of new housing and commercial development, develop and operate transportation and water infrastructure, and oversee emergency preparedness and response. The rapidly growing field of climate analytics can help local governments adopt a more proactive approach by identifying risks, developing climate action plans, and implementing strategies that limit the harms of both chronic and acute climate stresses, from intense storms to wildfires to extreme heat.
The goal of this project is to illustrate how local governments can use geographically granular climate risk data to map local hazards and plan community-based adaptation strategies, while highlighting some of the challenges in working with this data. We also discuss areas where regional, state, and federal agencies can support their local colleagues in these efforts. This analysis is intended to be useful for local governments—including elected officials and career staff—as well as utilities, regional planning agencies, private sector firms, and civic organizations engaged with built environment planning.
To illustrate the potential uses and challenges of geographically granular climate risk information, we analyze data created by First Street Foundation that measures heat, wildfire, and flood risk. Focusing on the city of San Diego, we create risk maps at several levels of geography—city, neighborhood, and parcel—to illustrate how risk varies across geography, over time, and by climate risk category. These metrics primarily capture physical risk; when possible, we look at overlaps with social and economic characteristics that affect community vulnerability. Case studies of three neighborhoods with particularly high risks show the usefulness—and some cautions—of parcel-level analysis.
Briefly, our key findings are:
- Geographically granular climate risk data provides new insights that can inform adaptation strategies—but is quite complicated to work with, creating a steep learning curve. Local governments that want to undertake this type of analysis will need to invest in developing staff capacity with appropriate technical skills and subject matter expertise to analyze and interpret the data.
- Heat is the most widespread risk in San Diego, and is strongly correlated with geography. Heat risk rises moving inland from the coast. The frequency of extreme heat will increase substantially over the next 30 years across most neighborhoods. Low-income neighborhoods do not have a higher average heat risk, but will need more support in implementing adaptive strategies.
- About half of San Diego neighborhoods face wildfire risk. While the general patterns do not change over the next 30 years, the intensity of wildfire risk in areas currently affected will increase.
- Flood risk is both spatially concentrated and diffuse. About 1% of parcels citywide have estimated flood risk. These parcels are dispersed widely across the city—many neighborhoods have one or two parcels with high risk. A small handful of neighborhoods have concentrated clusters of high-risk parcels; these are likely targets for intervention.
While the spatial patterns we find are specific to San Diego, some of the insights from the analysis apply more broadly to local and regional public agencies across the country. Generalizable recommendations include:
- Regional or state governments should take the lead in acquiring and managing geographically granular climate risk data. Climate hazards cross political borders, with both extreme and chronic events likely to impact multiple jurisdictions at the same time. Many cities and counties do not have the technical expertise, staff bandwidth, or fiscal resources to conduct their own analysis. Because of the high upfront costs for learning how to use this data, there are clear economies of scale in sharing knowledge across multiple localities.
- Local governments should integrate findings from climate risk analysis into their resilience and adaptation plans. Having better information on the types of risk that affect different neighborhoods will allow local governments to prioritize limited public resources and undertake adaptive strategies with the greatest social benefits. Overlaying physical risks with other types of information—including social and economic characteristics or the condition of buildings and other infrastructure—will enable leaders to better target capital investments.
- Public officials and civic leaders should develop better ways to communicate local climate risks to general audiences. To build public trust and buy-in to adaptation investments, community members should understand both underlying risks and how specific risk reduction strategies can help. Enhancing the public’s understanding demands overcoming the complexities and abstractions within climate risk data and its underlying concepts. The task is made even more difficult when considering sensitive issues around the uncertainty of weather predictions, fraying trust in public institutions, rising insurance costs, and unequal abilities to pay for adaptation.
Climate stresses on our homes, neighborhoods, and budgets will only grow in the coming decades. Public officials should act now to incorporate climate adaptation throughout their decisionmaking, investment, and communication processes.
Across the U.S., more destructive climate events are impacting our day-to-day lives and communities. The summer of 2023 saw heat records shattered in every national region, including a “heat dome” that left temperatures near or exceeding record highs for weeks. The frequency and intensity of wildfires, hurricanes, flash freezes, and extreme rainfall continue to trend upward. The net result is more disruptions to people’s daily lives, decreased public health, reduced worker productivity, and costly damage to capital assets and natural ecosystems.
As a result, climate-related costs are surging. The average annual damages from weather- and climate-related disasters jumped from $17.8 billion in the 1980s to $81.1 billion in the 2010s, and the 2020s are easily on pace to shatter that record. Households and businesses have seen their annual insurance premiums continue to rise—or their coverage scaled back—as the insurance industry continues to adopt new actuarial models. Nor are these economic impacts felt evenly. In many parts of the country, low-income, Black, and Latino or Hispanic households face higher climate risk in exchange for lower housing costs—reflecting persistent wealth disparities and discrimination in housing markets, including access to mortgages and insurance.
Governments at all levels have a responsibility to help communities adapt to increasing climate risks, with the goal of becoming more resilient. In this report, we use “adaptation” to refer to actions or adjustments that reduce the physical and financial risks of climate stresses. “Resilience” refers to the ability of communities to anticipate, absorb, and recover from shocks.
A healthy natural environment is the ultimate example of a public good, but many governments are not yet taking appropriate actions to reduce risks. For example, our decentralized, locally driven approach to land development has resulted in faster housing and population growth in environmentally risky areas; over the past 20 years, half of new homes were built in risky locations. Too often, federal, state, and local governments wait until disaster strikes and then react by rebuilding homes, buildings, and infrastructure in the same ways and in the same places.
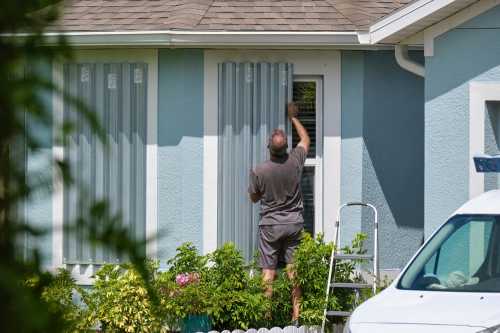
Some of the most effective ways to reduce the economic and human damages from climate events are community-based investments, rather than focusing on individual properties. Policies such as limiting development in high-risk areas, upgrading building codes, and expanding stormwater management systems can limit the harms of future events across a wide swath of people and businesses. Undertaking these investments before disasters occur can save money and lives—but the upfront costs require public support, because they are beyond the financial capacity of individual property owners or neighborhoods. Additionally, households and businesses may not fully understand or value investments that improve resilience until the dangers become more visible and acute. Better public messaging about the need for these investments would help build community buy-in.
Adopting a more proactive approach to climate adaptation is, at its core, a local issue, because officials are on the front lines in helping their communities manage a changing climate.1 Local officials serve as the gatekeepers of real estate development by using zoning codes, building codes, and tax policies to influence the location and quality of buildings. Cities and counties develop and operate the infrastructure that transports people in times of emergency, manages stormwater during heavy rainfall, and builds community centers to protect people from the heat and cold. Local officials also serve as advocates on behalf of their constituents with state and federal agencies by passing along questions and concerns to insurance regulators, utility commissions, infrastructure agencies, and other climate-related entities. In turn, state and federal agencies can provide essential support to localities, such as greater financial resources and technical expertise, and can coordinate when adaptive investments cross jurisdictional boundaries.
Many local governments and their nonprofit partners now adopt formal climate adaptation and resilience plans—but officials need more accurate, timely information to tailor their strategies. Infrastructure planners need a better understanding of how different types of climate risk vary by neighborhood to inform their capital plans. Land use planners and building departments would benefit from knowing where to limit future development or retrofit older structures against increasing climate stresses. Elected officials and their communications staff need clear, understandable language to explain their decisions to constituents.
The rapidly growing field of climate analytics can help local governments achieve these goals. The same climate models that predict high-level climate patterns are now being applied to predict risk at a more granular level, from individual neighborhoods down to single properties—and are increasingly being used by insurance companies. Yet while this data offers officials promising ways to understand risk at the levels they need, simply making the data available does not directly translate into adaptation strategies. Cities, counties, and regional agencies will need to invest in hiring and training staff with the technical expertise to understand how to use the data and gain the bandwidth to undertake analysis. And beyond the technical work, local leaders must decide how to use the analysis to inform public policies and engage with real estate developers, insurers, and other private market actors.
All public agencies face resource constraints, so government leaders must make choices about how to deploy their budgets, staff, and political capital. Where, when, and how should they invest limited resources? Having better information on the relative exposure of different neighborhoods to various types of physical risk is one important part of the equation. Determining the greatest social return on investment also inherently requires value decisions: Should officials prioritize adaptive strategies in areas where residents have more social vulnerabilities, places with higher expected costs of damages (which often reflects underlying property values), or investments that can create broader positive spillovers through space and communities?
In short, the growing availability of small-scale climate risk data offers new opportunities for local governments—but officials need guidance to make the most of those opportunities.
The goals of this project are to illustrate how local governments can use newly available climate risk data to map local hazards and plan community-based adaptation strategies, while highlighting some of the challenges and areas where regional, state, and federal agencies can support their local colleagues. This analysis should be useful for local governments—including elected officials and career staff—as well as utilities, regional planning agencies, and civic organizations engaged with built environment planning.
We begin by discussing the broader context of why cities need to invest in more resilient built environments to withstand increasing climate stresses. Next, we unpack the measurement of small-scale climate risk data, previewing the work practitioners will undertake. To provide insights into how this data can be used, the remainder of the report explores various ways to visualize climate risks, using the city of San Diego as a case study. San Diego provides a useful empirical setting because it has substantial variation across neighborhoods in both the types and severity of three major climate risks: heat, wildfires, and floods. We conclude with practical recommendations for how local officials can integrate small-scale climate risk data into their climate adaptation plans and policies.
Local efforts are needed to increase built environment resilience to climate stresses
Protecting people and property is a core responsibility of every local government. Today, the growing intensity of weather-related hazards and unsustainable development patterns are testing local governments’ ability to carry out these responsibilities. The heat wave seasons of the 2010s were an average of 47 days longer and included about four more heat waves annually than in the 1960s, while the growth in area covered by pavement, concrete, and other manufactured surfaces is intensifying heat island effects. Since 1990, roughly one-third of homes were built within wildland-urban interfaces (WUIs)—areas where human settlements have close proximity to combustible wildland. More frequent and intense rainstorms are overwhelming stormwater systems and intensifying water pollution. Large-scale suburban development and agricultural practices have put strains on groundwater systems across the country.
Many neighborhoods and cities built in earlier decades are not prepared for current and future estimates of infrastructure damage from floods, wildfires, heat, freezes, and wind-related risks. Many local governments are not well equipped to plan for and mitigate low-probability, high-impact events that have not occurred before, such as hurricanes in Southern California or deadly freezes in the Southeast. Yet climate change is not experienced the same way everywhere; risk levels vary from year to year and neighborhood to neighborhood. Government officials across the U.S. must be vigilant in understanding the threats posed by each category of weather-related hazard and how those threats align with residents’ and businesses’ ability to cope.
That’s especially the case for those groups least prepared to manage environmental risk. Nationally, people of color live in urban heat islands and face long-term flood risks at far higher rates than other demographic groups. Wildfire risks also disproportionately affect people of color, with census tracts that are majority Black, Latino or Hispanic, or Native American facing 50% higher vulnerability to wildfires. Lower-income households and smaller businesses with less access to credit could struggle the most with rising insurance premiums and other climate-related costs.
In response to these growing risks, many local governments are implementing new resilience-focused policies as well as mitigation or decarbonization plans. Each year, more municipalities and regional governments adopt climate action plans (CAPs) or similarly named efforts to formalize long-term resilience goals, measure adaptation needs, and outline actionable steps. Utilities, transportation departments, and other infrastructure-focused agencies continue to use updated standards to design more resilient infrastructure such as urban tree canopies, vegetated buffers, and permeable surfaces. Developers and owners of subsidized housing are beginning to systematically assess climate risks across their properties and incorporate climate resilience into both new development and retrofits of older buildings.
The city of San Diego provides a useful case study in how cities are adopting new approaches to climate resilience. Climate Resilient SD) is the city’s comprehensive adaptation plan—an element of the General Plan required under California state law that supplements the city’s mitigation-focused 2022 CAP. Climate Resilient SD includes three vulnerability assessments, uses five overarching goals to anchor 86 recommended interventions, and strategizes how to interweave the recommendations with established policy document such as the city’s General Plan and San Diego County’s Hazard Mitigation Plan. And like every locality in California, Climate Resilience SD ensures the city complies with statewide directives and taps statewide funding resources. The city now actively audits progress against Climate Resilient SD’s goals.
California leads other states in maintaining extensive datasets and dashboards—notably, the state’s Cal-Adapt website—that localities can use for climate action planning. These resources offer considerable depth and breadth of information and are useful for detailed analysis, but may be challenging to interpret for those without technical expertise. For example, Cal-Adapt’s Analytics Engine publishes downscaled data to a 3-kilometer resolution, which does not match the geographic fidelity or data categories of privately published datasets. As we discuss in the recommendations section, providing complex data without clear guidance or technical assistance can reduce adoption by local governments.
Regardless of the specific metro area, every local government will need trusted sources of climate risk information to design effective resilience strategies. Outdated and obsolete flood maps, rainfall reports, wildfire maps, and other risk-related data make it harder for local officials to design effective interventions. Considering the enormous amount of work it will take to adapt metropolitan areas for new weather-related hazards, accurate risk data is an essential input to future climate governance.
Localized climate risk data can better inform community adaptation strategies
High-resolution climate risk mapping is a fast-emerging part of the broader climate analytics industry. As the physical damage and financial costs of natural disasters grow, private sector companies are increasingly investing in data that allows them to better prepare for climate events. Property insurers, institutional real estate investors, financial service companies, and credit rating agencies are among the types of firms that have incorporated small-scale climate risk data into their business practices. Local governments and community-based civic organizations can also use this data to protect homes, businesses, and infrastructure. For example, identifying parks, schools, and bus routes with high heat risk can direct public investments in tree canopies, green roofs, and cooling water features. In the sections below, we will discuss in more detail how specific risks are measured and the types of adaptation strategies local governments might consider in response.
Rapid innovations in environmental monitoring and digitized parcel data are helping modernize earlier climate risk data. Newer data makes it possible to estimate risks of flooding, drought, wildfires, extreme heat, pollution, or coastal erosion for each parcel of land—if not each 10-square-meter coordinate—in the country. Some datasets develop metrics for specific climate risks or future emissions scenarios, while others produce indexes the general public can more easily understand. For example, the Environmental Protection Agency’s EJScreen interactive mapping tool allows users to see risk levels for drought, wildfire, sea level rise, and aggregate flood risk for small neighborhoods (census block groups), as well as pollution from multiple sources.
As local governments consider how to incorporate climate data into built environment planning, they should be aware of some limitations and sensitivities, particularly around communicating with outside stakeholders. Even with the best scientific advances available, modeling weather events and natural disasters is inherently uncertain; predicting exactly when and where a wildfire will ignite or a hurricane will make landfall is effectively impossible. Climate risk data captures the best estimate from a range of possible scenarios, and the risk metrics are expressed in probabilities, which can be challenging to convey accurately to constituents. Disclosing climate risks raises the potential of serious financial impacts, notably property value declines. On the other hand, adaptation infrastructure projects can raise property values. Depending on where risks are concentrated, disclosure could exacerbate economic and racial disparities. And as the next sections of this report will illustrate, climate risk data can be complicated to analyze and interpret, requiring localities to invest in staff technical capacity.
To demonstrate how climate risk data can inform local planning efforts, we analyzed data from First Street Foundation, a nonprofit research organization that specializes in providing information to public sector agencies and academic researchers. First Street’s data is available at multiple geographic scales and levels of aggregation; as we discuss throughout this report, the varying formats offer opportunities as well as challenges for researchers.
One of the greatest challenges in communicating climate risks to a broad public audience is translating an inherently technical and complex subject in terms that non-technical audiences can understand, all while maintaining accuracy. To simplify communication, First Street has developed a set of broad risk indices for four climate risk categories—wildfires, floods, wind, and extreme heat—that are aggregated from multiple finer-grained underlying metrics and disaggregated from global climate models (GCMs).2 The high-level indices range from 1 (low) to 10 (high), streamlining relative risks for non-technical audiences. A dataset containing these indices for all U.S. census tracts can be downloaded free of charge from First Street’s website (users are required to create an account to download the tract-level data). The metrics we use reflect physical risk, but do not directly incorporate social or economic characteristics of communities, such as income, race, or age.
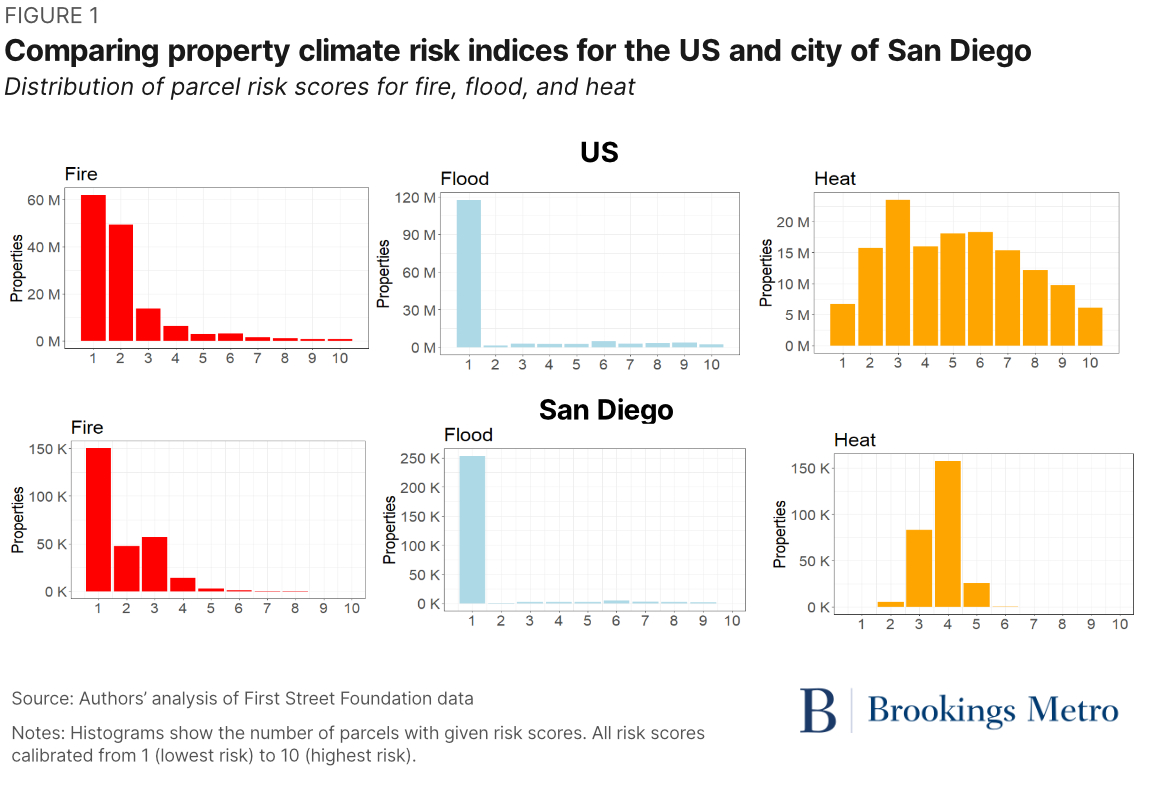
Comparing the distribution of risk for all U.S. parcels shows strikingly different patterns for the three main risk categories (top panel of Figure 1). Around 80% of U.S. parcels have little to no fire and flood risk as modeled (index values 1-2); a score of 1 represents a risk level below the limits of the First Street model.3 The remaining parcels are spread thinly across the middle and higher index scores. Heat risk is by far the most normally distributed: More U.S. parcels are exposed to mid-level heat risk (values from 3 to 7) than either the upper or lower extremes. These patterns suggest that risk mitigation efforts are likely to look different across these three categories—investments to reduce harms from fires and floods will be spatially concentrated, while many more communities will need some efforts to address heat risk.
Parcel-level risk scores in San Diego follow similar patterns, but with a few notable differences. San Diego has relatively fewer parcels in the highest-risk tiers for all three categories, with the largest divergence in heat risk. Some of this reflects an inherent fact of measuring climate risk within a single city: Climate conditions vary less in small geographic areas than across the entire U.S. And while San Diego has some parcels that face very high fire and flood risks compared to the whole country, most parts of the city are less exposed to heat than other U.S. regions. Methodological issues also result in a compressed range of risk index values. The index is created by aggregating several different metrics within each category, and the overall index value is impacted by the direction and strength of correlation between these metrics, as we discuss in more detail later in the report.
While tract-level aggregate indices are available without charge to the public, First Street also compiles parcel-level data, available with a subscription. This is the data that we analyze in San Diego. The tract-level indices are built from individual land parcels—similar to the digital parcel records maintained by local tax assessors, which detail land uses and building types. Most of our analysis is conducted for census block groups—small geographic areas with between 600 and 3,000 residents. This is the smallest unit of geography for which Census Bureau population and housing data is available, and ensures data privacy for households. Some maps also illustrate parcel-level variation in risk within block groups.
For each of the broad risk categories—heat, fire, and flood—First Street offers multiple individual measures that, when combined, create the high-level indices. We selected metrics that capture both physical risks and financial costs associated with those risks. The financial metrics are useful to convey tangible economic impacts—including ongoing operating costs households and businesses pay—and can be compared with the costs of adaptive policy interventions. The physical risk metrics provide a nice complement. For example, the two heat metrics we examine are the number of days with a heat index between 90 and 99 degrees (physical) and estimated annual cooling costs (financial). The cooling cost estimates are calculated based on the size and age of buildings, assume that all structures have air conditioning, set a cooled temperature of 70 degrees, and infer market prices for electricity. These types of standardized assumptions are necessary to construct financial metrics, but introduce additional sources of uncertainty. For example, many of San Diego’s older homes and commercial buildings were constructed without air conditioning due to the city’s historically temperate climate, and may require additional investment in coming years. We provide further details on each category of risk metrics in the following sections.
The primary focus of our analysis is to describe spatial patterns of climate risk across the city of San Diego, and illustrate how geographically granular data can help local governments plan and invest for adaptation. Another type of analysis of interest to local governments is understanding how climate risk intersects with social and economic vulnerabilities. Low-income households and communities typically experience more disruption from climate events; financial resources, access to credit, information, and other resources are critical to a wide variety of adaptive strategies. However, data limitations raise some challenges in San Diego’s context, particularly when considering fire and flood risk. The First Street data includes metrics of heat risk for all neighborhoods in San Diego, but most neighborhoods do not have modeled risk metrics for wildfires and floods. That is, the risk of these events is less than First Street can precisely model.
The absence of risk scores implies relatively lower levels of risk, but readers should be cautious in interpreting “no data” to mean “no risk.” Minimal risk for most city neighborhoods inhibits our ability to examine consistent patterns between fire and flood risk and population characteristics, such as income and race.
Heat is the most prevalent climate risk in San Diego
Extreme heat threatens public health, reduces worker productivity, and increases the demands on city services, such as cooling centers. In this section, we explore spatial patterns of heat at several geographic scales within the city of San Diego, and provide some insights into how heat risk can be especially challenging for low-income communities. Other populations, such as seniors, children, and outdoor workers, are also vulnerable to extreme heat.
We examined heat risk using one physical and one financial metric: days with a heat index between 90 and 99 degrees in 2023 and estimated annual cooling costs. The cooling costs are calculated based on the size and age of buildings, assume that all structures have air conditioning, set a cooled temperature of 70 degrees, and infer market prices for electricity. Both metrics cover all types of properties (residential, retail and office, industrial, and public institutions).
San Diego’s inland neighborhoods face the highest heat risk
All neighborhoods in San Diego face some amount of heat risk in 2023. However, the degree of risk depends on location. Citywide, the median block group experiences four days between 90 and 99 degrees, but the citywide range is zero to 50 days across all block groups. High heat days are strongly correlated with location: Coastal neighborhoods face lower numbers of high heat days than inland neighborhoods.
Most San Diegans will face more severe heat risks in coming years. Figure 3 shows the frequency of high heat days for block groups and parcels today and looking ahead 30 years. Today, two-thirds of block groups experience six or fewer high heat days per year, and only 12% of block groups have more than 20 high heat days. Thirty years from now, slightly more than one in four block groups will have six or fewer high heat days, and over 20% will experience more than 20 high heat days. While spatial patterns of heat do not change substantially over time—cooler near the coast, hotter inland—expectations of more heat make adaptive strategies even more important going forward.
Comparing heat exposure between block groups and individual parcels also illustrates the asymmetric distribution of heat risk: There are many more parcels with unusually high heat risk than those with unusually low heat risk. In 2023, nearly 17% of parcels face 20 or more very hot days, compared to about 12% of neighborhoods. That is, some block groups with more moderate neighborhood-level risk contain parcels with very high risk. Such variation underscores the need to look at small geographic areas to map where risks may exist.
Cooling costs do not show as consistent geographic patterns. While many of the inland neighborhoods with high heat days also fall into the highest range of cooling costs, some coastal neighborhoods with fewer high heat days also have high cooling cost estimates (Figure 3). The median block group citywide has an annual cooling cost of $505, and a citywide range of $174 to $48,300. Estimates of cooling costs depend both on exposure to heat and building structure characteristics—notably, age and size, which vary across the city. Building condition and age are correlated with neighborhood social and economic characteristics, highlighting the need to focus on vulnerable communities. These estimates also incorporate standardized assumptions about the targeted indoor temperature (70 degrees) and costs of electricity.
An important question for policymakers is how many households (or businesses) will have difficulty paying the utility costs of cooling their surroundings, especially during prolonged heat waves. In other words, how expensive are cooling costs relative to income? Unfortunately, that question is difficult to answer consistently across neighborhoods with the available data. For block groups that are entirely composed of single-family homes, it would be feasible to estimate the per-household cooling costs and compare to median household income. But for apartment buildings, it is difficult to estimate per-unit cooling costs—or even to know whether air conditioning is separately provided and metered per household. Older apartment buildings raise potential equity concerns, because they house a large share of low-income renters. Estimating cost burdens is even more complicated for mixed-use block groups that combine residential buildings (often of multiple structure types and sizes) with shops, offices, or other commercial and institutional uses. Additionally, the cooling cost estimates rely on assumptions that do not reflect household choices: Households with tight budget constraints are unlikely to set a consistent indoor temperature of 70 degrees, so their actual out-of-pocket costs almost certainly differ from the estimates.
Heat risk is not strongly correlated with socioeconomic factors in San Diego—a somewhat surprising finding given national research. Compared to cities such as Chicago or Washington, D.C., San Diego has less rigid spatial patterns by race or income (e.g., historically persistent north-south or east-west divides), although actual divides and the perceptions of them do exist. On average, coastal neighborhoods have a higher share of white residents, but with some crucial exceptions. Barrio Logan, for instance, is a predominantly Latino or Hispanic low-income community adjacent to the San Diego Bay and port tidelands. Median household income also varies widely throughout the city, with wealthy neighborhoods located both on the coast (e.g., La Jolla) and in farther inland areas (e.g., Scripps Ranch).
Because high heat days are largely correlated with geographic factors, and socioeconomic factors are not strongly correlated with geography, heat risk is also not strongly correlated with income or race. As shown in Figure 4, there is a weak positive relationship between neighborhood income and high heat days, but the correlation is statistically equivalent to zero. As the graph shows, both high-income and low-income neighborhoods experience widely varying ranges in high heat days. Similarly, there is essentially no statistical correlation between high heat days and neighborhood racial composition.
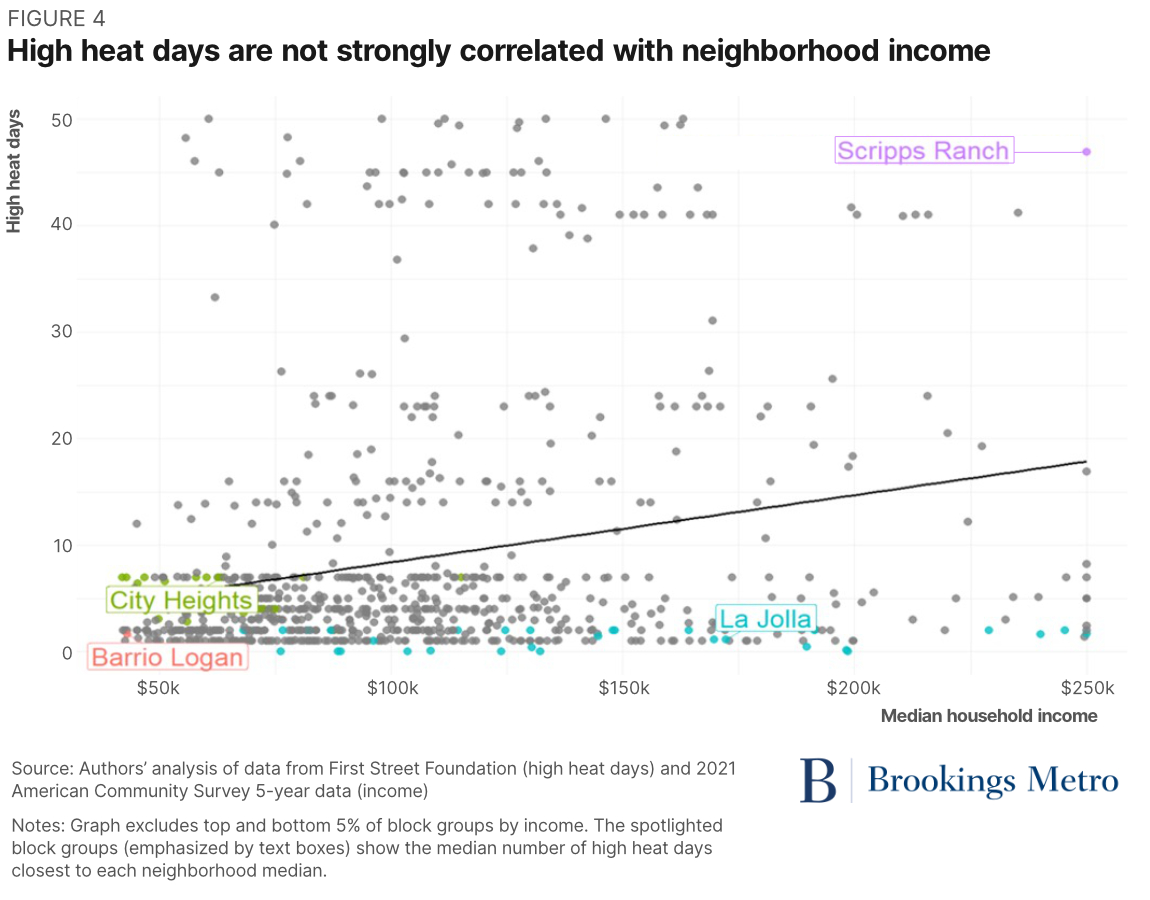
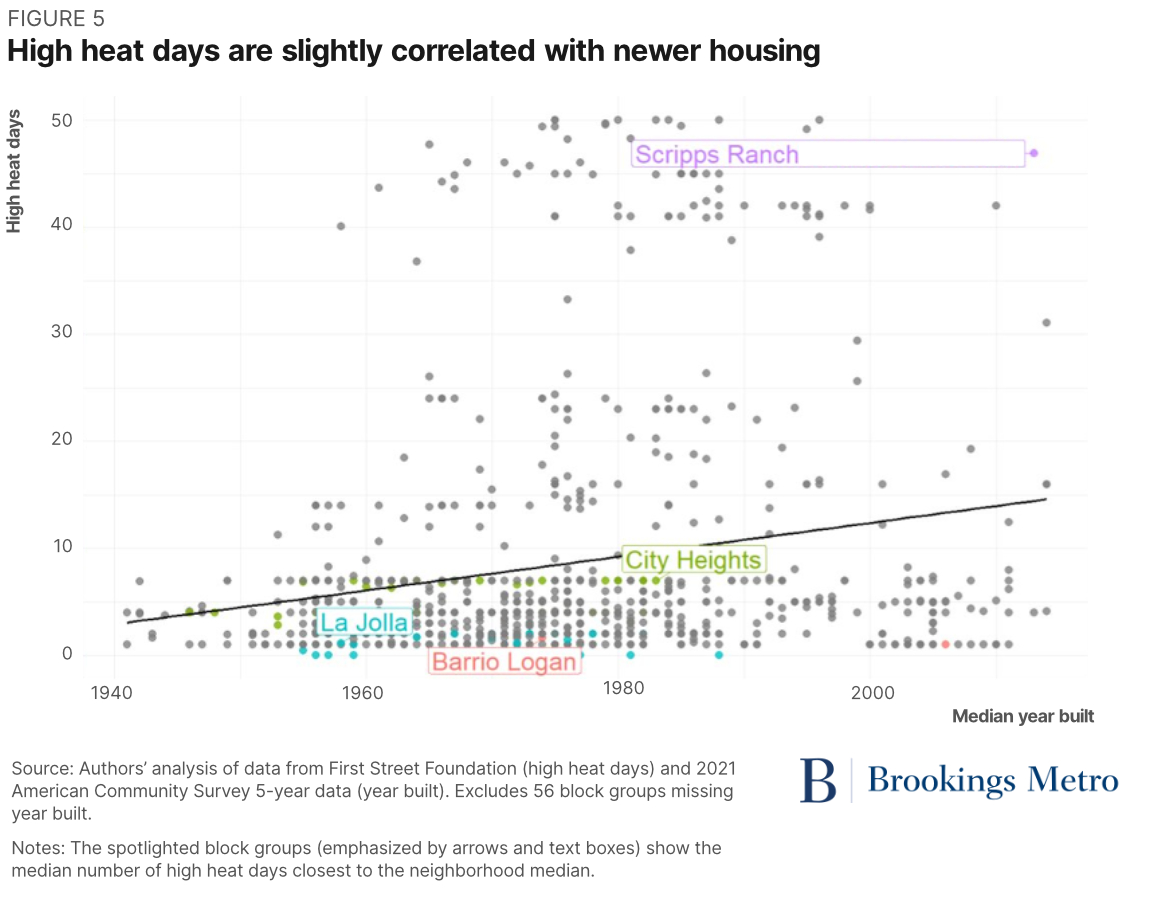
High heat days have a slight positive correlation with the median year a home was built; coastal neighborhoods are among the city’s first developed areas, with most newer housing being built farther inland.
Policymakers may want to consider different types of adaptive strategies for neighborhoods exposed to high heat risk, based on underlying demographic, economic, and physical characteristics. For example, low-income households occupying older homes in high heat areas could benefit from weatherization assistance and utility subsidies. Similarly, neighborhoods with higher shares of zero- and one-car households would benefit from greater public space cooling options such as tree canopies and shaded bus shelters. The concluding section of this report offers more detailed recommendations.
Case study: City Heights
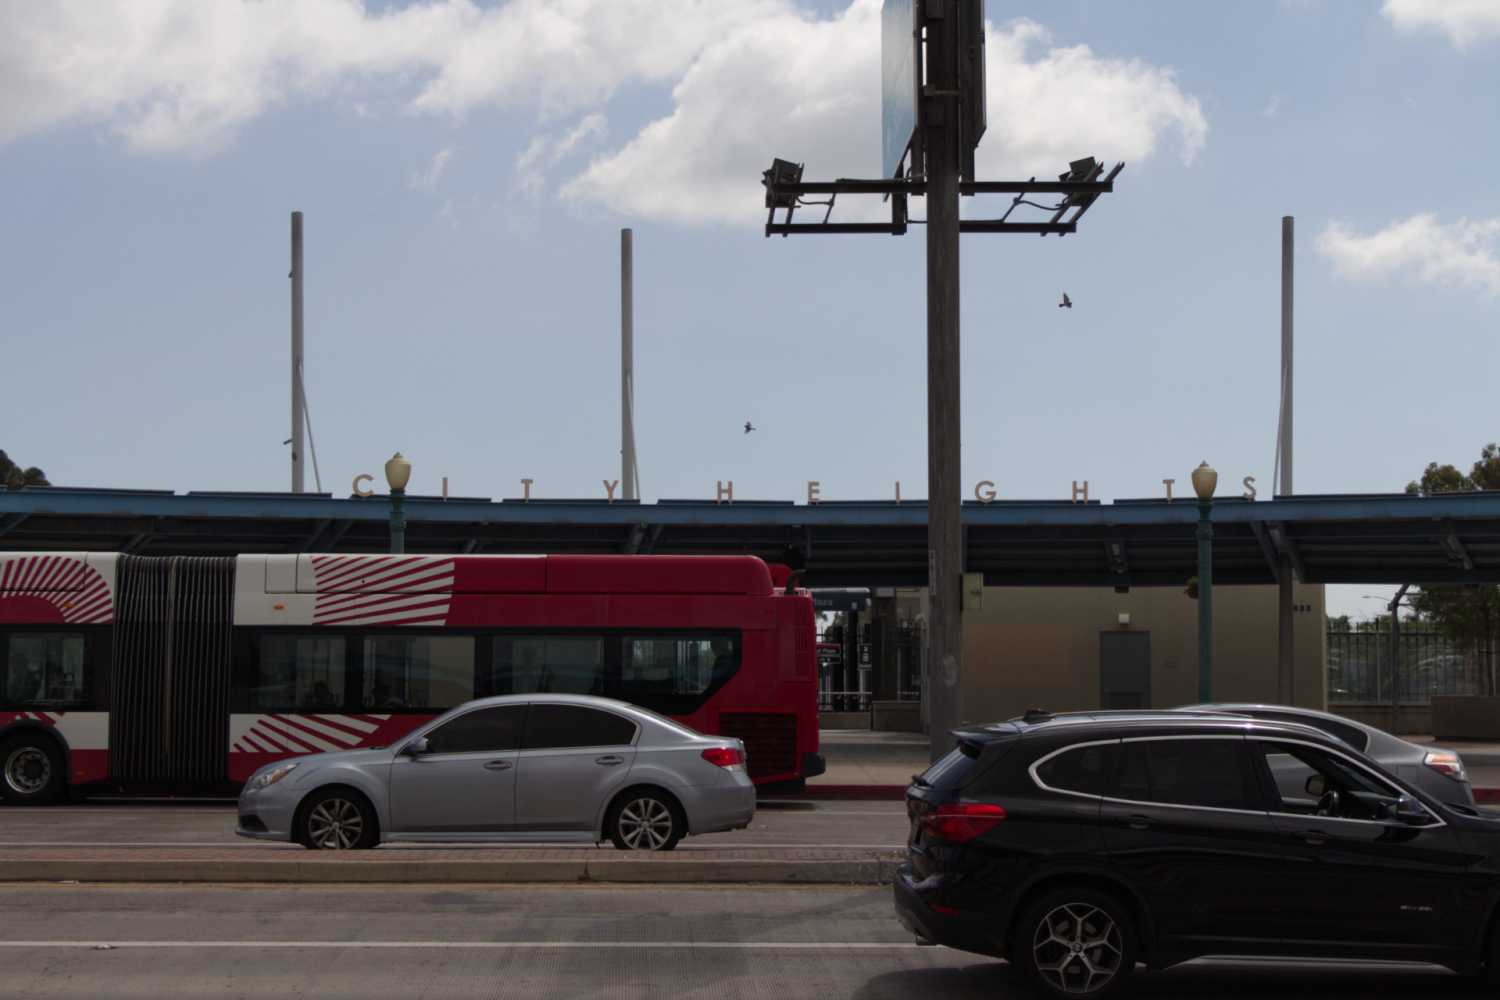
To get a closer look at how heat risk varies at a small scale within neighborhoods, we provide further analysis of the City Heights neighborhood. Located in central San Diego, City Heights is a low-income, racially diverse neighborhood containing a mix of residential and commercial areas across 45 block groups. The median block group in City Heights is 54% Latino or Hispanic—more than 2.5 times that of the citywide median block group (20%). The median City Heights block group has a median household income of $47,299—about half of the citywide median household income block group ($91,932). Homes in City Heights are slightly older than they are in the rest of the city; the median home was built in 1968, which is seven years earlier than the citywide median of 1975.
Heat risk varies across the 45 block groups in City Heights, but on average is higher than for San Diego citywide. The median block group in City Heights experiences 4.9 high heat days annually—about one more day annually than the citywide median. As the lefthand panel of Figure 8 shows, the east side of City Heights has more high heat days than the west side. Cooling costs also vary across block groups, with block groups along the northern edge of City Heights having higher cooling costs (right-hand panel). The median cooling cost in City Heights is $574—about 15% higher than the citywide median cooling cost ($505).
To see how heat risk varies at an even smaller scale, we focus on parcel-level variation for selected block groups. We selected two adjacent block groups: one primarily residential and the other with a mixture of commercial, institutional, and residential uses. Looking first at the mixed-use block group, the number of high heat days ranged from four to seven days across parcels, with the eastern half of the block group having more hot days. The parcel on the lower right-hand quadrant of the block group is an elementary school; providing healthy, comfortable school environments for students is a high priority for city officials. This example also illustrates the need for coordination across government entities: San Diego Unified School District is a separate legal entity from the city government.
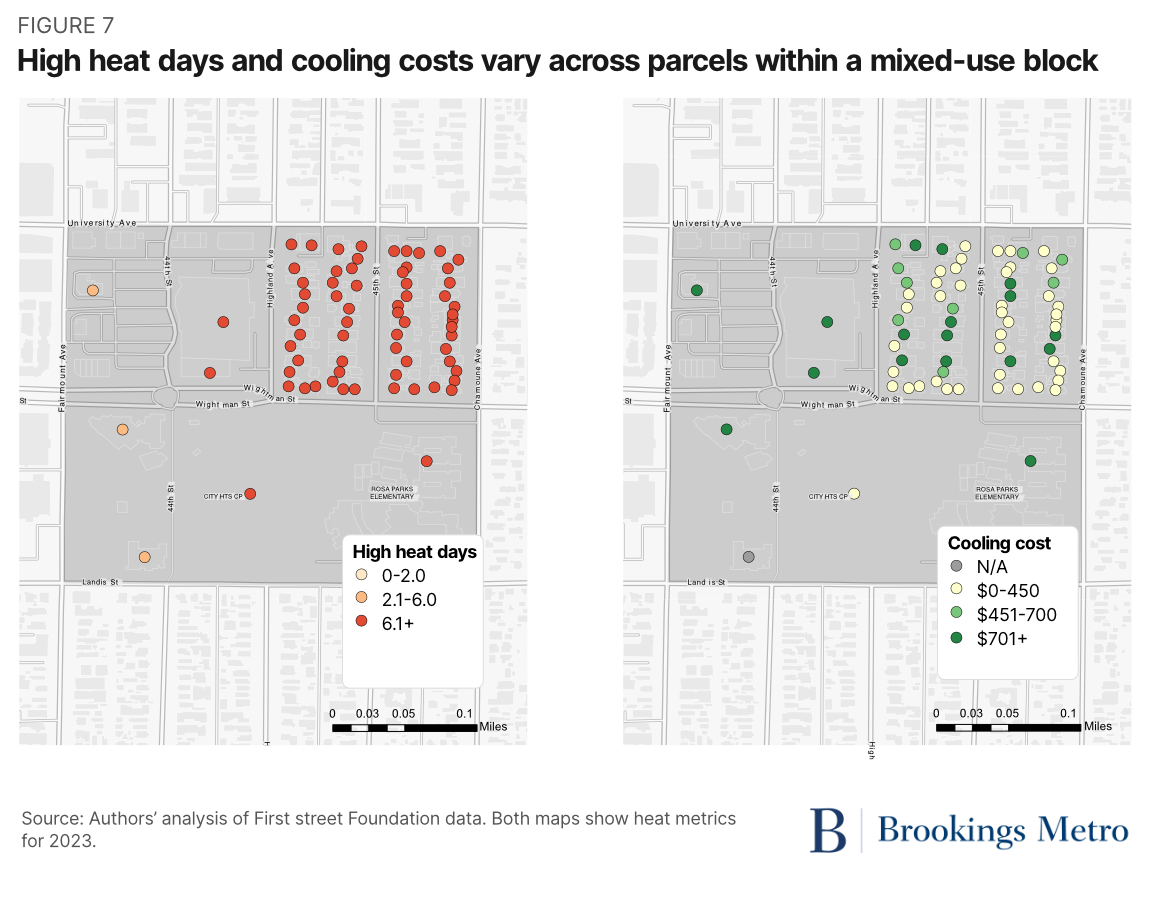
Comparing cooling costs (right-hand panel of Figure 7) to high heat days provides some insights into the relationship between these two metrics. The parcel in the upper left-hand quadrant represents a large commercial building that falls in the lower range of high heat days but has high cooling costs; building size is a key factor in estimating cooling costs. Cooling costs also show more variation than high heat days for the residential portion of the block group (upper right-hand quadrant), likely due to building characteristics.
The residential block group illustrates the equity concerns of heat risk: Even within a low-income neighborhood, this is a particularly poor block group facing high heat risk. The median household income of the block group is $28,000, which is 40% lower than the City Heights median ($47,000) and about two-thirds lower than the citywide median ($92,000). Slightly more than half of the homes are single-family, and 80% of households rent their homes. Low-income households will face the greatest challenge paying utility costs for air conditioning. Renter households also have limited control over whether the home has any air conditioning equipment, insulation, and other features that can mitigate heat. Low-income households typically spend more than half their income on housing costs, including utilities, which often leaves them too little cash to cover other necessities. Developing outreach strategies to landlords and property managers on adaptive investments—including how to access available subsidies—should be a high priority for the city.City Heights also faces increasing heat risk over time. The residential block shown above has zero parcels that experience 20 high heat days in 2023; this increases to 209 parcels 30 years from now. The challenge of how to keep people safe and healthy—as both population and housing stock continue to age—will only become more urgent.
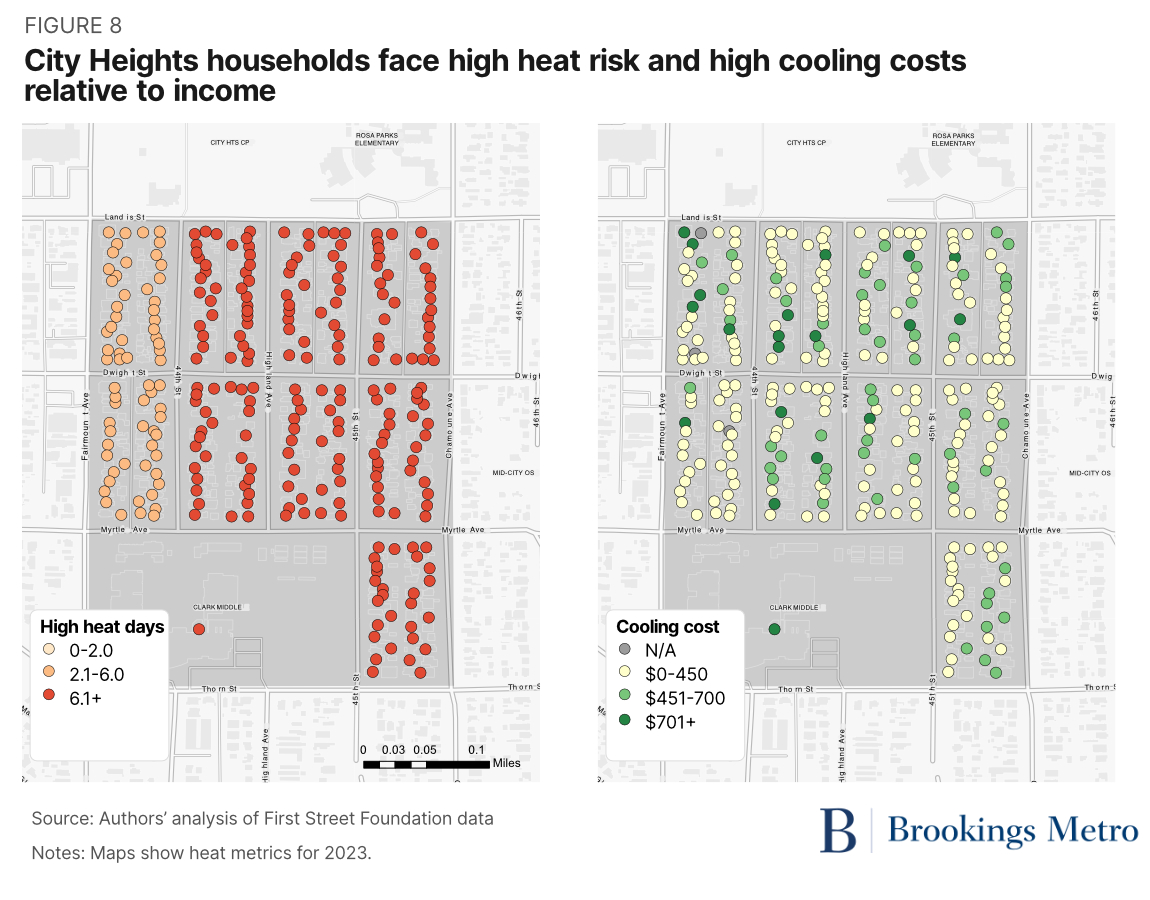
City Heights also faces increasing heat risk over time. The residential block shown above has zero parcels that experience 20 high heat days in 2023; this increases to 209 parcels 30 years from now. The challenge of how to keep people safe and healthy—as both population and housing stock continue to age—will only become more urgent.
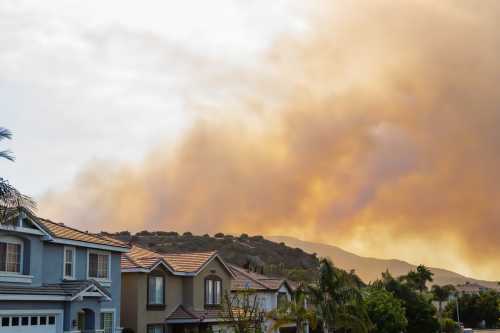
Wildfire risk affects a smaller set of San Diego neighborhoods
Wildfires are a familiar risk in San Diego, as in many Western communities. Because wildfires typically start in undeveloped land in the wildland-urban interface (WUI), the city of San Diego has been less affected to date than unincorporated areas of the county, especially the eastern portion. The San Diego region has made significant investments in wildfire management after devastating 2003 and 2007 wildfires that spread quickly through the WUI and canyons, causing substantial destruction and loss of life in many communities. However, wildfires can spread quickly and cause enormous damage in very little time. Proximity to canyons is a particularly important feature to consider when planning for wildfire resilience, because canyons can initiate or spread fires quickly.
We examined fire risk in San Diego using a physical and financial metric: burn probability in 2023 and cost to rebuild. “Burn probability” is defined as the probability of a wildfire reaching a given property. “Cost to rebuild” is defined as the estimated cost to replace the building, and is not dependent on the extent of modeled wildfire exposure. It is important to note that First Street’s metrics focus on the direct impacts of fires, but wildfire smoke creates health hazards that can spread hundreds or even thousands of miles beyond the burning areas and is not included in either metric.
Fire is the second most prevalent climate risk facing San Diego, but not nearly as widespread as the risk posed by heat. Just over 40% of parcels in the city have modeled burn probability, and about 45% of all block groups have at least one parcel with modeled burn probability. Fire risk is somewhat correlated with heat: Risk increases on average moving inland, just as it does with heat. Because of the limited geographic scope of fire risk, we cannot systematically evaluate the relationship between fire risk and socioeconomic characteristics.
San Diego’s urban periphery faces the highest burn probability
Burn probability is highest in the eastern part of the city, due to proximity to open space and canyons where rugged terrain and fire-prone vegetation allow wildfires to spread easily. Less than half (44%) of block groups in San Diego have modeled burn probability; as noted previously, this should not be interpreted as a definitive absence of risk, but it does imply relatively low risk. By contrast, coastal and downtown areas either have low burn probability or have no modeled risk. Most block groups with modeled risk have very low values that cannot be precisely estimated (e.g., have wide confidence intervals). Therefore, rather than showing exact numbers, our analysis shows block groups by relative risk (lowest, middle, and highest terciles).
The intensity of wildfire risk in parts of the city will increase over time. Unlike heat risk, wildfire risk remains relatively concentrated. The share of block groups facing the highest tier of burn probability rises from about 15% today to 25% in 30 years. The share of parcels in this risk group rises from 20% today to 30% in 30 years. More than half of parcels and about half of block groups still do not have modeled burn probability in the future.
Similar to heat risk, the geographic patterns of physical risk and financial risk from wildfires look somewhat different. The estimated cost to rebuild does not follow the same geographic pattern as burn probability for two reasons. First, some neighborhoods have a modeled cost to rebuild even if they do not have modeled burn probability. First Street models the cost to rebuild for parcels without risk if they are residential properties located near historic fire events. Second, cost to rebuild is simply an estimated replacement cost of the building, therefore unrelated to the extent of fire damage and only dependent on building characteristics, which vary across the city. The median block group citywide has an estimated rebuilding cost slightly above $800,000, but the citywide range is enormous, from around $200,000 to $242 million. This range reflects the wide variation across block groups in the number, size, type, and quality of structures.
Of the three risk categories we analyze, wildfires and floods raise particularly urgent need for adaptive strategies to be undertaken collaboratively with neighboring jurisdictions. The city of San Diego is less exposed to direct wildfire risk than the county and other jurisdictions to the east and north, but spillovers across political boundaries require shared planning and investment. As discussed in the following section, some flood-prone areas are also adjacent to neighboring jurisdictions.
Case study: Rancho Mission Canyon
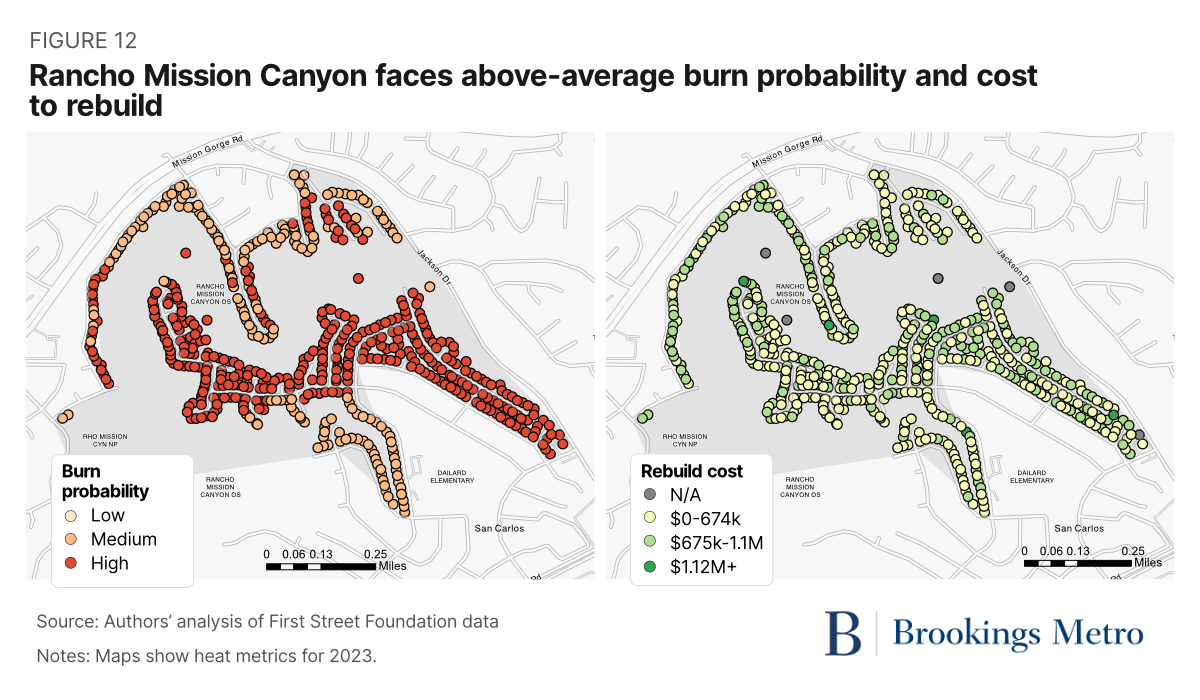
To better understand how fire risk varies at a small scale within neighborhoods, we provide further analysis of a neighborhood encompassing part of Rancho Mission Canyon, near the Mission Trails Regional Park. Located in the eastern part of the city, Rancho Mission Canyon is an affluent residential community with a median household income of $134,000—46% higher than the citywide median household income of $92,000. More than 90% of residents own their homes, compared to the citywide median of just under 50%. More than 60% of residents are white, compared to about half citywide, with a slightly smaller share of Latino or Hispanic residents and a representative share of Black residents compared to the citywide median. This area is close to scenic hillsides and mission trails, but also close to a sand-mining operation.
Crucially, the presence of a canyon in this block group (right-hand panel of Figure 14) adds an additional layer of risk to the neighborhood, since canyons can create a strong updraft in hot air, allowing a fire to burn faster and become more intense. Canyons also frequently have concentrations of unmanaged trees and brush.
Properties in Rancho Mission Canyon face a substantially higher burn probability than the rest of the city. Higher-risk parcels (in red) tend to cluster around the Rancho Mission footpath, where the open space and shrublike vegetation could allow fires to spread quickly (Figure 15). Notably, some of the lower-risk parcels (appearing in a U-shape in the lower half of the map) are separated from wildland by one or more residential streets. The city of San Diego’s Land Development Code Brush Management Regulations require 100 feet of defensible space from inhabited structures to fuel loads. Additionally, the fire department can approve alternative compliance (fire-rated walls) as part of building entitlements. These requirements reduce the risk of wildfire impacts on residential development.
There is a very small relationship between a property’s burn probability and the cost to rebuild (right-hand panel of Figure 15)—rebuilding costs are simply an estimate of the cost to replace the current structure, without considering the likelihood of burning. For context, the median home value in this neighborhood is just under $700,000—roughly the midpoint of estimated rebuilding costs. However, considering Rancho Mission Canyon generally faces far higher burn probabilities than other city neighborhoods, the cost to rebuild underscores the destructive power of wildfires.
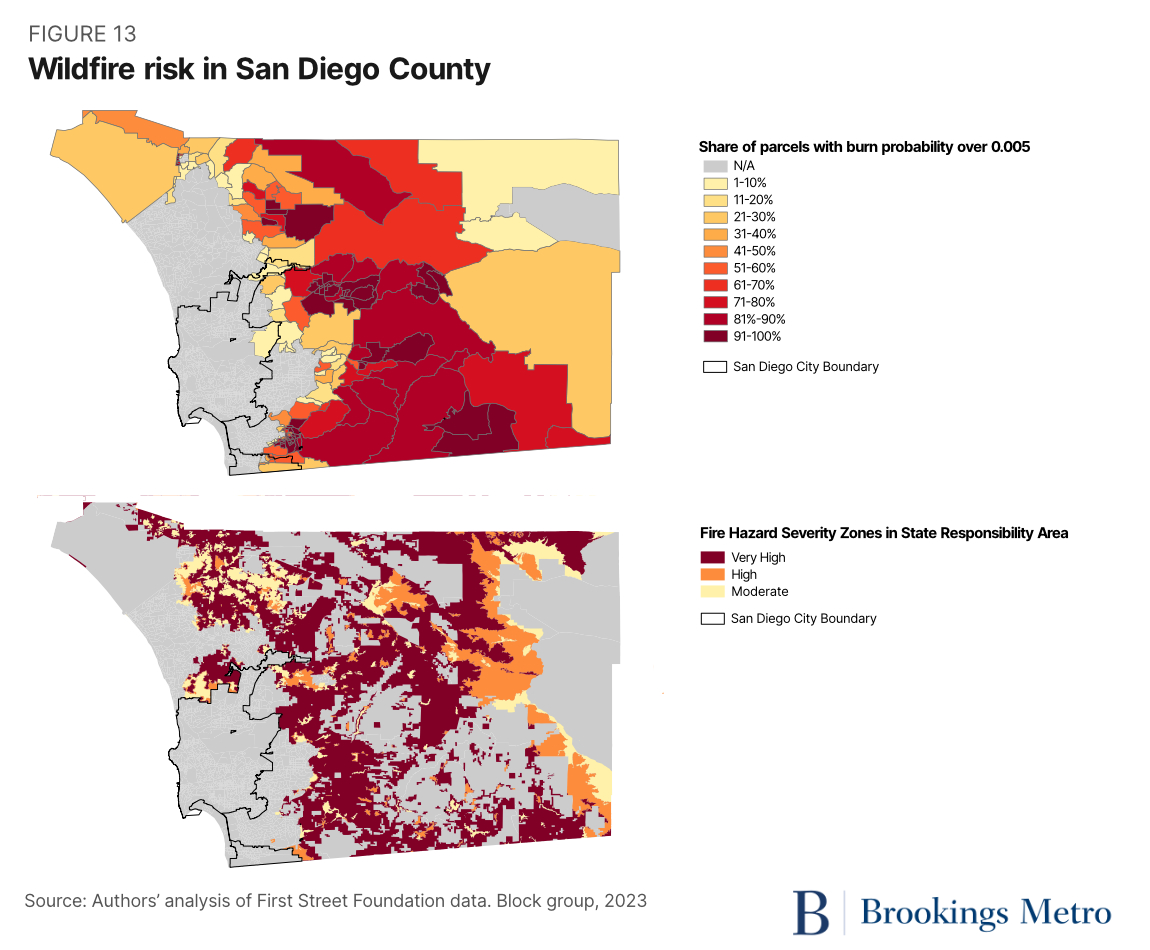
Wildfire risks surge near wildland-urban interfaces—including in San Diego County
Wildfires present enormous risks to California’s built environment. Much like hurricanes along the Atlantic and Gulf coasts, named events such as the Camp, Thomas, and Cedar fires are potent reminders of the damage the state’s wildfires can inflict. Invariably, the most damaging fires in terms of structural burns and public health occur in communities that abut uninhabited land, known as wildland-urban interfaces (WUIs).
As the county with the state’s largest WUI by total land area, San Diego County sees much higher burn probabilities on the eastern edges of its urbanized area than locations near the coast. First Street found more than 189,000 parcels across the county face burn probabilities of at least 0.0005 in 2023. That number jumps to over 284,000 when looking out 30 years—a 50% increase. As Figure 16 shows, the parcels at the greatest risk in 30 years are predominantly located away from the coast and are well aligned with the state’s Fire Hazard Severity Zones.
California government officials clearly understand the risks wildfires pose. From state laws such as SB 1035, which requires updated Safety Elements within General Plans, to coordinated Strategic Fire Plans between the state and local governments, to the county’s federally mandated hazard mitigation plan, there is no shortage of wildfire-focused mitigation and adaptation strategies in place.
However, the county-level wildfire data poses a more fundamental question to the region: How will the region grow safely? Continuing to expand neighborhoods along the current WUI, or even building deeper into uninhibited land, will put more people and structures at higher risk. But the need to supply more housing overall is equally urgent. Small-scale wildfire risk data—especially if combined with capital budgets and projected insurance data—can inform these difficult development decisions going forward.
Flood risk is both diffuse and concentrated
Californians have historically been more worried about having too little water than too much. Flood risk from intense storms is less salient in California’s cities than coastal areas along the Atlantic and Gulf coasts. However, changing climate patterns may bring different types of risk going forward—both the atmospheric rivers of winter 2023 and Hurricane Hilary in August 2023 may be harbingers of the future.
The most common approach to measuring flood risk is to forecast flood depth for specific “return periods,” defined as the average amount of time between flood events of a certain size. For example, a 100-year flood has a 1% chance of occurring in any given year; on average, a 100-year flood will occur once every 100 years. This concept can confuse or mislead people about the frequency of events. For instance, a 100-year flood can occur more than once in 100 years.
We examined flood risk in San Diego using flood depth in centimeters at a 100-year return period for two reasons. First, the 100-year return period is one of the most common return period metrics. The Federal Emergency Management Agency (FEMA), for instance, uses the 100-year floodplain estimate to designate high-risk areas. Second, block groups in San Diego had a lower proportion of parcels with modeled risk for the two-year and 20-year return periods. It’s important to note that FEMA flood mapping for San Diego does not consider the capacity of drainage systems themselves; many older neighborhoods where the drainage systems were built to older design standards and rainfall intensities will experience more frequent flooding, including areas outside the traditional FEMA flood risk areas.
One climate risk adjacent to flooding that we cannot measure with First Street data is coastal erosion. Some beachfront areas in Southern California face substantial risk to homes, businesses, and infrastructure due to erosion.
A handful of coastal neighborhoods face the greatest flood risk
Spatial patterns of flood risk are quite different from those of both heat and fire; flood risk is both widely diffuse and highly concentrated. Most neighborhoods face very low and isolated flood risk: Just 1.3% of parcels in the city have modeled scores for 100-year floods, but those parcels are spread across 61% of block groups in San Diego. The wide geographic spread of only a handful of at-risk parcels suggests that flood risk is important to understand using small-scale, parcel-level geography. Discussing an average risk for block groups (or larger geographies, such as census tracts) is not very useful, since risk metrics are only modeled for a few parcels in most block groups. On the other hand, about 2% of block groups in San Diego have relatively high neighborhood-level risk: There are 22 block groups where at least a quarter of all parcels have modeled flood risk. Most of these block groups are located near the coast, in areas such as Mission Beach (shown in Figure 14). In addition to these areas, certain older neighborhoods will experience more frequent flooding due to drainage system capacity limits.
While fewer than 5% of parcels have modeled flood risk, these parcels are widely dispersed: About 60% of block groups and 88% of census tracts have at least one parcel with modeled risk. Calculating tract- and block-group risk scores for neighborhoods that have only a few parcels with modeled flood risk but high estimated risk can give the impression of entire neighborhoods being at high risk. Planners working to develop adaptive strategies therefore need to consider whether to focus on individual parcels or identify neighborhoods with concentrations of high-risk parcels.
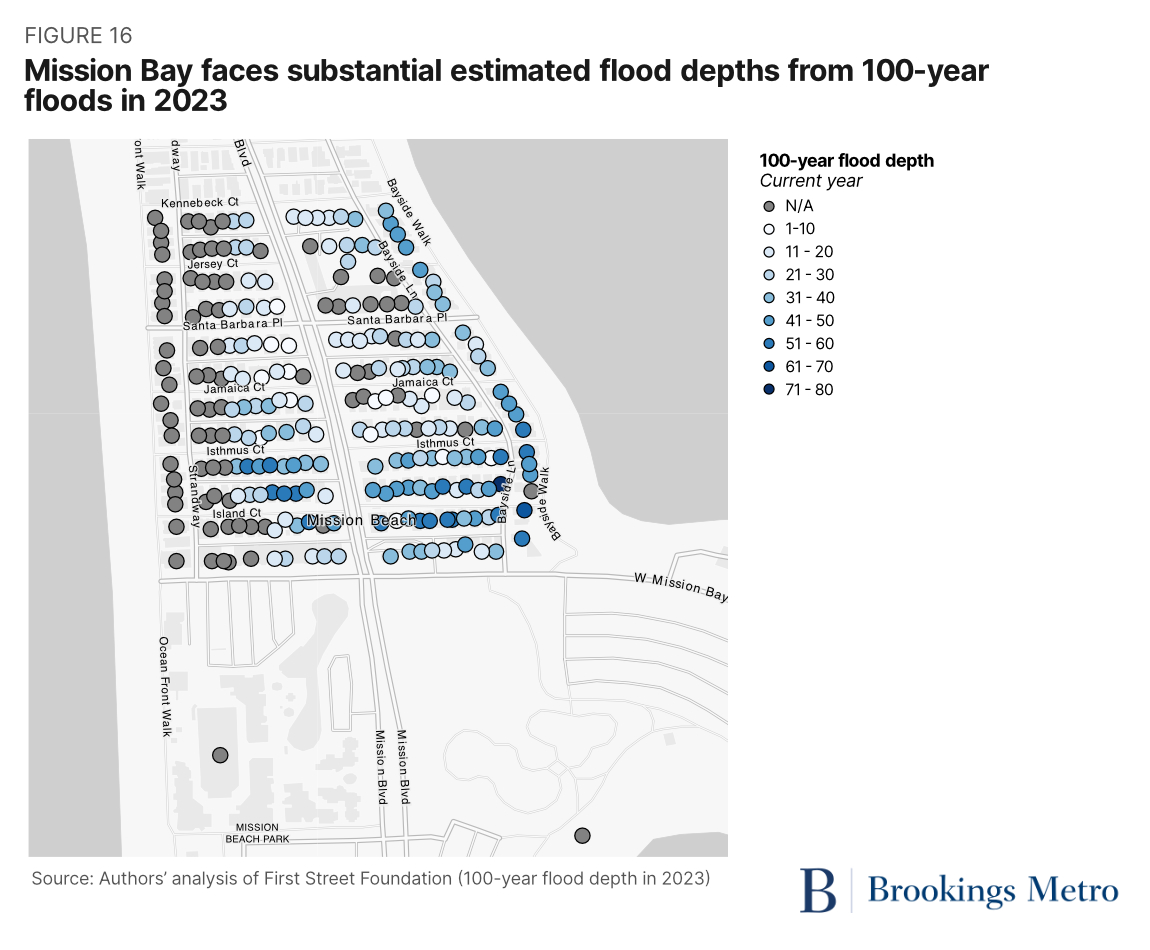
Case study: Mission Bay
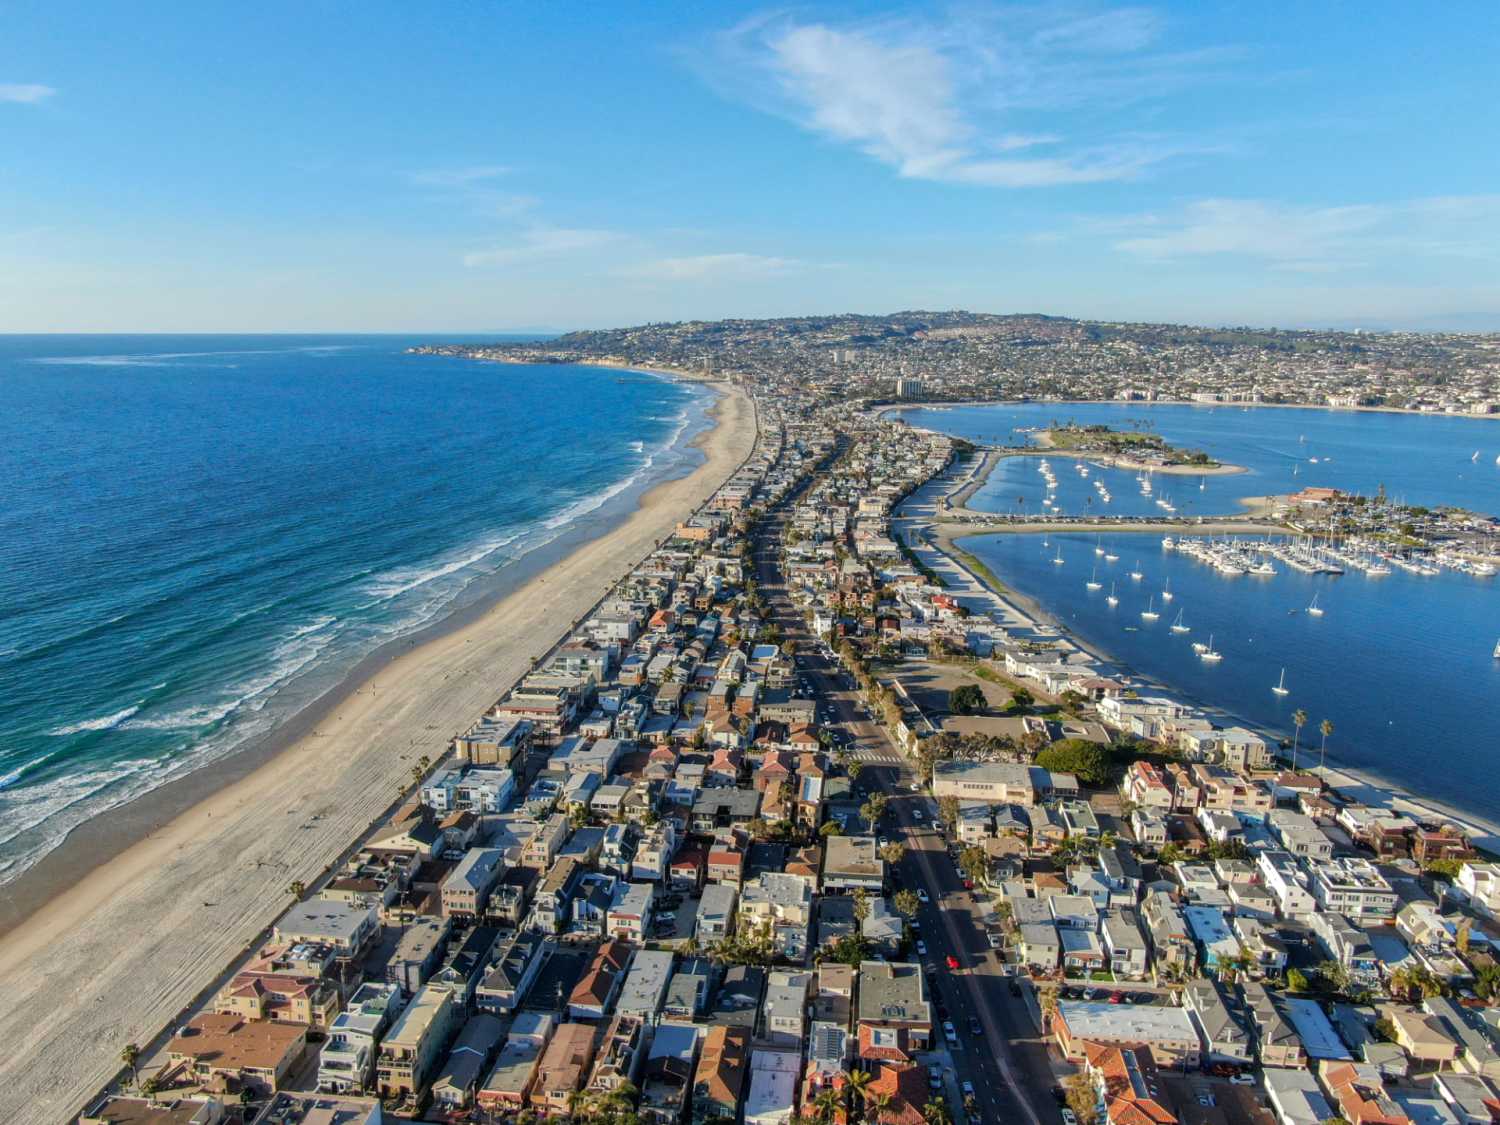
Mission Beach is one of the neighborhoods with the highest concentration of parcels with modeled flood risk. The neighborhood is surrounded by water, with Mission Bay to the east, the San Diego River to the south, and the Pacific Ocean to the west. The neighborhood’s median household income (here measured as the census tract) was nearly $98,000 according to the 2021 American Community Survey—higher than the citywide median.4 Ten percent of residents are Black, compared to about 6% citywide, with a smaller share of Latino or Hispanic residents and an over-representative share of white residents. Only 21% of households own their home, compared to a citywide rate of 48%.
Two-thirds (67%) of parcels in this neighborhood face modeled 100-year flood depth, making it the block group with the highest proportion of modeled risk in San Diego.5 While a larger proportion of properties in this neighborhood face modeled risk, properties face lower 100-year flood depth levels (median 29 centimeters) than the rest of the city (median 87.8 centimeters). Parcels range in their expected flood depth from 5 to 71 centimeters within the neighborhood. A higher proportion of parcels east of Mission Boulevard, on the Mission Bay side of the neighborhood, face modeled risk, largely from king tides.
In 30 years, the proportion of parcels facing modeled 100-year flood depth increases to 74%. The upper range of modeled risk increases, with modeled flood depth ranging from 5 to 89 centimeters. The median flood depth increases by more than one-third, to 42 centimeters, while the citywide median only increases by 1% (89 centimeters) in the same period. The proportion of parcels in this neighborhood facing modeled risk remains the same.
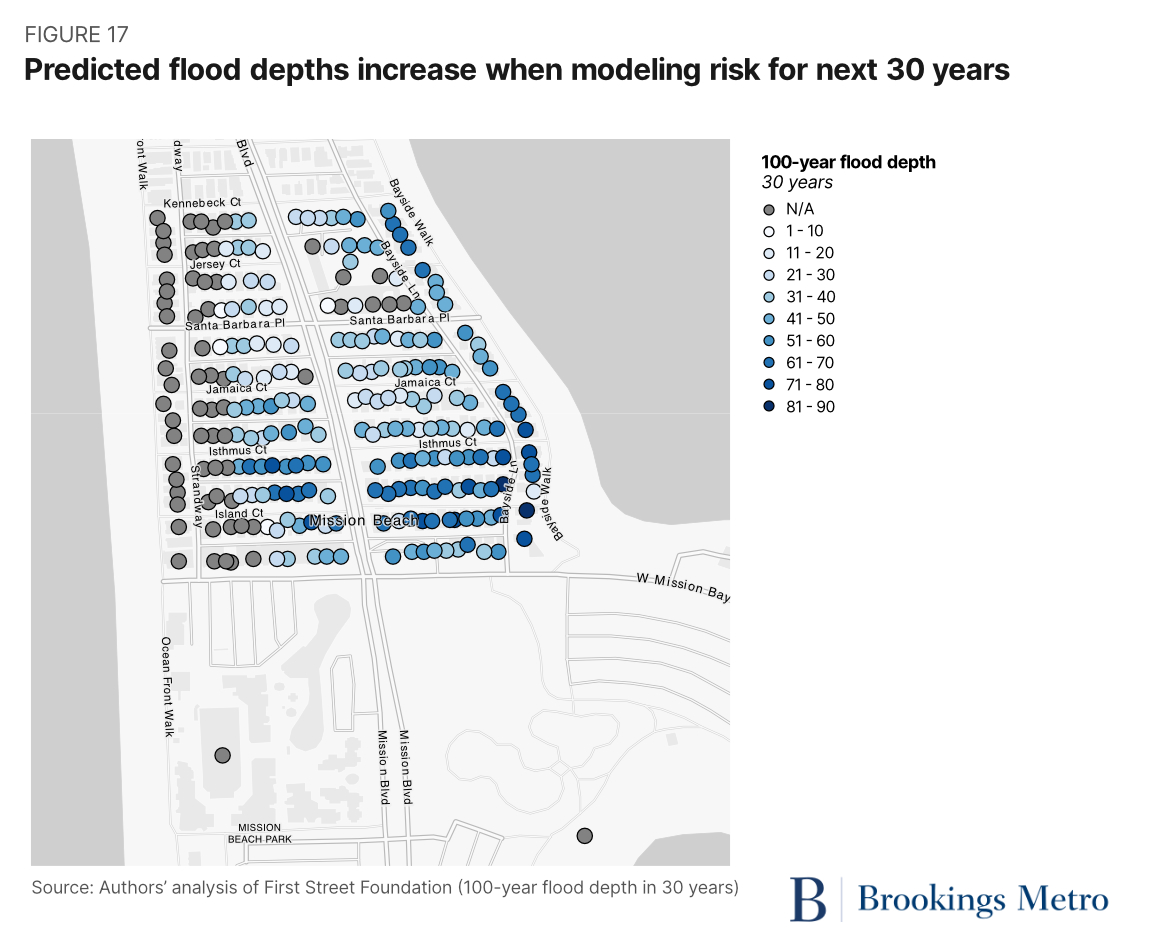
Analyzing spatial patterns of flood risk raises different challenges than heat and wildfire because of the unusual distribution of risk across the city. As with other types of risk, planners will want to consider the overlap between physical risk and social or economic vulnerabilities, as well as exposure of publicly owned infrastructure and assets. In the case of Mission Bay, city officials and property owners will need to consider what it will take to maintain evacuation routes over the coming decades and how to compare investment costs of various adaptive strategies, including improved seawalls, stormwater drainage, and individual property barriers. Nature-based adaptive solutions—such as bioswales, rain gardens, and trenches—are becoming increasingly common in urban environments.
High-resolution climate risk data can improve how local public officials prepare for weather-related hazards. Understanding different types of climate risk at a small geographic scale can enable governments to better target adaptive strategies for communities that face both physical and social vulnerabilities.
The practical challenge facing local governments is finding ways to effectively analyze and interpret the data. Climate data is notoriously complex, requiring a mix of statistical skills and subject matter expertise to accurately interpret. Governments will need to integrate climate data with other geographically granular information on income, demographics, property conditions, and other physical and economic features. High-resolution data is also relatively expensive to purchase. Localities and regional governments will need enough staff capacity to make the upfront investment worthwhile—another piece of the green jobs challenge.
Local leadership is also necessary to translate the findings into effective public action. Municipalities and regional entities will need robust climate action plans, and then find ways to apply the results from high-resolution analytics to sharpen specific interventions. Community representatives must be central to any conversations that prioritize the needs of specific groups and neighborhoods. Local, regional, and state policymakers will need to engage in collaborative, innovative thinking to respond to growing insurance costs and loss of coverage. Finally, policymakers, community groups, advocates, and the media all need to develop new communication methods to explain risks to people in more intuitive ways.
Because weather-related hazards and governing structures vary widely from region to region, it is impossible to craft comprehensive recommendations that would apply to any municipality or metro area. Instead, we recommend three broad areas for action, with more specific recommendations for San Diego that build on the city’s established climate adaptation strategies and actions.
Regional or state governments should take the lead in managing geographic climate risk data
Weather-related hazards don’t stop neatly at political borders, with both extreme and chronic events likely to impact multiple jurisdictions at the same time. The combination of unpredictability and geographic fluidity only reinforces the need to understand physical risks and potential interventions across entire metro areas.
At the same time, local government staff are already experiencing challenges in managing climate-related data and resilience planning. Many cities and counties simply don’t have the technical expertise, staff bandwidth, or fiscal resources to undertake the type of analysis illustrated in this report. And even when larger, better-resourced localities find it easier to expand their technical capacities, such an investment creates an uneven playing field to confront hazards that could impact an entire region.
As a result, regional agencies—such as metropolitan planning organizations or councils of governments—and state partners should serve as the lead governing agencies to manage high-resolution climate risk data. There are clear economies of scale to centralizing climate informatics, including sharing large upfront acquisition costs, training and retaining expert staff, and lower marginal costs to apply data-informed lessons in every municipality. We recommend the following action steps:
- Designate a centralized climate data office. One regional agency should serve as the primary repository for climate risk data, employ staff with appropriate technical expertise, and manage interrelated datasets. This agency can also be a clearinghouse for information about programs to help households and communities build climate resiliency.
- Prepare and share complementary data. Many cities and counties already maintain property records that will make climate data more useful. Within their available capacity, localities should ensure their property databases are accurate—including land use and structural details for privately owned and municipal assets—and then share the data with the regional entity. Investing in asset management systems, data portals, and data visualization software will be important for local jurisdictions to use the climate risk data effectively.
- Pool information management funds. Pooling funds—based on a democratically determined method—will allow a region tap into the available economies of scale. Partnerships should include enough durable revenue to support data procurement, database management, analytical capacity, and communication time with local municipal staff.
San Diego recommendation
Either SANDAG or San Diego County should serve as the primary manager of climate risk data, and as a clearinghouse of information about adaptive strategies for households and communities. To start, both entities—whose jurisdictional boundaries perfectly align—already serve as regional hubs for data, modeling, and analysis. Both entities also continue to make climate resilience a planning commitment. They are natural actors to serve as touchpoints for municipal action. They also could build such an entity in collaboration with the San Diego Regional Climate Collaborative, which already brings together the county’s local governments around shared climate needs.
The regional database should include climate data and other complementary data. For example, it would make sense to include air quality data alongside parcel-level risk metrics for heat, floods, and wildfires. Likewise, offering public agencies a regional clearinghouse of relevant property information—including assessed values, physical features, and land use—would enhance the scope of analysis that could be conducted at the regional or local scale.
The office should also support local applications of risk data. For example, Cal-Adapt publishes downscaled 3-kilometer data—what’s also known as a raster data format, or measurement along consistent spatial grids—to inform the state’s Fifth Climate Change Assessment. Using this data within a locality’s housing or public works department will require training. Similarly, local practitioners may want help comparing Cal-Adapt data to parcel-driven data, particularly when some datasets offer building-related estimates and others focus strictly on weather-related data.
Identifying and securing funding for this office should be an immediate priority, alongside staffing and other process needs. The San Diego region has used community benefits agreements—for example, a past franchise agreement with San Diego Gas and Electric—to create pooled revenues for climate-related activities. If a durable agreement can be brokered between governments and private sector partners, then the community benefits model could create the kind of equitable revenue streams to ensure all municipalities receive equitable benefits.
Local governments should integrate findings from climate risk analysis into their resilience plans and adaptation strategies
Cities and regional agencies are continuing to improve their resilience plans, from regularly updating climate action plans with long-term goals to adding specific adaptation tactics. Granular local climate risk data can be a valuable input when developing resilience plans—with several assumptions. Does the staff know how to assess the uncertainty inherent in climate modeling? Are there processes to consider spillover effects from integrating risk data into investment models?
Consider a scenario in which physical and financial vulnerabilities overlap: Neighborhoods that face high heat risk are occupied by residents or businesses with limited financial resources to undertake adaptative strategies. Even if a government used small-scale risk data to install or subsidize purchase of cooling systems, households and businesses might not be able to afford higher utility bills or maintain equipment. Similarly, running significantly more cooling equipment could stress local electricity grids without complementary load management.
Integrating granular climate risk data into resilience plans does offer benefits—but we also recommend caution when initially crafting strategies. Officials should first consider piloting and testing these strategies before adopting at scale:
- Integrate climate risk data into capital budgeting. Each year, local governments expend considerable energy and money both constructing new infrastructure projects and operating and maintaining past assets. Municipalities across the world are now adopting various forms of climate accounting within their capital budget programs, including features such as climate budgeting and climate smart capital investment planning. Granular climate risk data could refine judgements over which projects—and in which targeted neighborhoods—offer the greatest return on investment or capacity for positive impact. For example, climate risk data can inform which specific assets or infrastructure types need to be assessed, hardened, moved, or abandoned. Failure of these assets can often be major threats to health and safety.
- Conduct “justice audits” to refine designations of climate vulnerability. Mapping climate-related burdens is a growing field—from the federal level down to states and cities—and increasingly used to design consumer-facing policy interventions. But since these justice-related analytics rely on data at the neighborhood level, smaller-scale data could help illustrate within-neighborhood variation in physical risk. For example, estimates of large geographic areas may fail to capture particularly at-risk individuals or businesses within otherwise less risky tracts or block groups. Climate- and equity-focused officials should explore where variations exist and how those could impact policy design.
- Explore ways to address property insurance availability and costs through local development policies. Insurance firms are forcing the public to grapple with the changing financial costs of protecting private property. Federal and state agencies are debating changes to industry-scale insurance regulation using their available policy levers. Localities have limited direct influence over rates, but they should consider where they allow new development—and redevelopment—in light of increasing insurance costs borne by households and businesses.
San Diego recommendations
- Incorporate parcel-level data into the city’s Climate Equity Index (CEI). The city uses the CEI tool “for targeting CAP implementation and other City investments in Communities of Concern that historically experienced lack of investment.” Parcel-level data can provide further nuance to the tract-level CEI, such as locating within-tract concentrations of need or determining where risk spillover could further impact communities of concern. One immediate step could be testing how certain performance measures vary between tract- and parcel-level datasets.
- Blend granular risk data into the Capital Improvement Program’s (CIP) evolving climate rules. As the city moves forward on climate-related evaluations of annual and five-year plans, granular risk data could improve project scoring. Future-years data should be incorporated into net present value calculations that help inform and prioritize spending decisions. For example, tree canopy investments could be situated along street blocks where households are least likely to have or afford in-home cooling. Similarly, combining raster risk data–which follows a spatial grid, not parcel or jurisdictional boundaries—with the location of infrastructure assets would enable actions such as adding shade structures to bike lanes, pedestrian throughfares, and public buildings.6 Parcel and raster-based risk data could inform where older stormwater pipes should be prioritized for replacement or repair and where to install cool-pavement materials.
- Use granular risk data to prioritize specific parcels where property owners can qualify for targeted assistance programs or other code adjustments. City incentives around rooftop solar photovoltaic installations could use parcel-level data related to high heat risk and potential energy cost burdens. The city’s cool and green roof code adjustments could be piloted in city blocks with the greatest need; the same data could also be cojoined with an exploration of financing pilots. The city’s building decarbonization roadmap could also use parcel-level data during the strategy-making phase. Finally, the city’s Building and Housing Stock Analysis could be augmented with new climate risk data to unlock new analytics for program staff.
Public officials and civic leaders should develop better ways to explain climate risks to general audiences
Building community resilience benefits everyone in every U.S. region. Therefore, it is essential for public officials and community leaders to communicate clearly with constituents to explain both the underlying risks and risk-reduction strategies in ways that are easy to understand and maintain scientific accuracy, as a recent Treasury Department report reinforces. For example, the First Street Foundation is using a 1 to 10 scoring scale to bridge the gap between technical experts and consumers. However, as our analysis found, aggregated risk indices or broad-brush geographic measures can obscure much of the nuance needed to design interventions. Even wording choices such as “burn probability” and “combustion probability” are hard to grasp.
The task is made even more difficult when considering sensitive issues around the uncertainty of weather predictions, fraying trust in public institutions, rising insurance costs, and unequal abilities to pay for adaptation. Constituents need honest assessments of the risks their properties and businesses may face, but it’s easy to imagine scenarios in which people bristle against unwelcome news, blaming the messenger instead of processing the message.
Since models only predict climate hazards and adaptation costs to grow in the coming decades, now is the ideal time for public officials to test new messaging techniques. Recommendations include:
- Conduct outreach to property owners in high-risk communities. Public agencies have wide discretion to make resilience investments in publicly owned infrastructure, such as transportation and water infrastructure, schools, and parks. Encouraging resilient investments in privately owned real estate—such as housing, offices, retail, and industrial buildings—will require outreach and coordination with numerous individual households, businesses, and other organizations. Many large institutional investors are already using local risk data, but local governments will need to develop strategies to work with smaller landlords and homeowners. Parcel-level data can help geographically target outreach efforts. City or regional agencies may also consider setting up “one-stop” centers that help constituents navigate multiple different funding programs.
- Experiment with colloquial language and framing around direct impacts to reach targeted audiences, focusing on household finances when possible. Explaining climate hazards to a general audience is already difficult, since humans struggle to understand environmental risks. The task is only made harder due to the politicization of climate issues. Officials should experiment with public information campaigns that try to break down these barriers. One promising area is to focus on household finances, such as the repair costs of flood damage or long-term health care costs from heat-related illnesses.
- Work with state and federal regulators and the insurance industry to address pricing and coverage challenges. The availability and cost of property insurance is undergoing rapid changes as a result of the changing climate, reflecting complex market structure and regulatory issues that go well beyond the scope of this report. As state and federal entities continue to address instability within property insurance markets—including a push by the Treasury Department to publish locally aggregated insurance data—local governments need to be part of the conversation on how to address these concerns.
San Diego recommendations
- Identify trusted intermediary groups that can conduct outreach. For example, the city of San Diego is working with business improvement districts to encourage frontage improvement programs to increase shade along sidewalks. The city should continue conducting neighborhood meetings to gather input from residents on priorities and needs, which are then shared with the Climate Equity Working Group. Additionally, working with community-based organizations can help implement some incentive and rebate programs for home energy retrofits in communities of concern, as well as conduct outreach to inform the decarbonization roadmap.
- Identify and undertake community-based interventions that can reduce insurance costs. For example, the city’s Stormwater Department joined a federal program to incentivize flood preparedness while saving residents money on insurance. Due to the city’s successful enrollment in FEMA’s Community Rating System (a federal rewards program), all National Flood Insurance Program policies receive a 15% reduction in premiums. The program offers discounts directly to property owners in communities that surpass the minimum floodplain management standards. This year, the city entered the program at a Class 7 and is committed to continuously improving its Floodplain Management Program.
For too long, climate adaptation and mitigation investments have been framed as “costs” relative to the status quo. As climate events become more frequent and intense, there is growing public awareness of the economic, social, and human costs of not adequately protecting our communities. Public officials at all levels of government, business leaders, and civic organizations need all the tools they can get—including better data, analytical capacity, and political leadership—to design and implement effective resilience strategies.
-
Acknowledgements and disclosures
The authors are grateful for thoughtful comments from staff from the First Street Foundation, Office of the Mayor of San Diego, San Diego Regional Policy Innovation Center, as well as our colleagues Chris Severen, Joseph W. Kane, and Mannan Donoghue. All remaining errors and omissions are the sole responsibility of the authors.
Brookings Metro would like to thank the San Diego Regional Policy and Innovation Center and the San Diego Foundation for their generous support of this analysis. Brookings Metro is also grateful to the Metropolitan Council, a network of business, civic, and philanthropic leaders that provides both financial and intellectual partners of the Program.
-
Footnotes
- While local officials must take a leadership role around adaptation, state and federal officials are vital partners. For example, the National Climate Resilience Framework, released in September 2023 by the White House, is an important step in outlining a broad set of national strategies to improve resilience.
- This analysis does not examine wind risk data, because San Diego is outside the bounds of the model’s range (essentially minimal risk).
- It’s critical to note any geographic entity—parcel, census block, or larger—with a score of 1 still carries some risk.
- The 2021 5-year American Community Survey dataset does not include data for this specific block group. The reported numbers represent tract-level statistics.
- Not including a block group that is modeled as a single parcel facing high flood risk. In First Street’s data, some homeowners’ associations show up as a single parcel, although they include hundreds or thousands of homes. HOAs are less common in the city of San Diego than in suburban jurisdictions and unincorporated parts of San Diego County.
- First Street does publish raster-based risk data, but it is not analyzed in this report.
The Brookings Institution is committed to quality, independence, and impact.
We are supported by a diverse array of funders. In line with our values and policies, each Brookings publication represents the sole views of its author(s).