Four key takeaways from the Gallup Poll (2001-2026):
-
Democrats’ satisfaction with the system of government is at a historic low for either party. A mere 12% of Democrats are satisfied with the system of government, compared with 24% of Independents and 52% of Republicans. This is the first time in the past 25 years that any party dipped below 20% satisfaction.
-
Americans’ satisfaction with their quality of life is at a historic low. Just 64% of Americans are somewhat or very satisfied with their overall quality of life. This is an all-time low for the nation and also masks a 46 percentage-point gap between Republicans (88%) and Democrats (42%).
-
Americans’ satisfaction with the opportunity to get ahead by working hard has become extremely polarized. Only 24% of Democrats are somewhat or very satisfied with the opportunity to get ahead by working hard, compared to 85% of Republicans. The second largest gap was 40 percentage points in 2019.
-
On multiple dimensions, Republicans’ and Democrats’ satisfaction is highly sensitive to whether their party controls the White House. Democrats have displayed an especially sharp drop in satisfaction during President Trump’s second term.
While there has been much attention to current events in the past months, ranging from the cost of living to the war in Iran to the upcoming midterms, there has been less focus on how people feel they are faring overall and how they feel about the state of the nation. We look at how people feel about their lives and how they feel about the country in January of 2025 and 2026 compared to the previous two decades. The data come from the Gallup Poll Social Series (GPSS), a monthly, nationally representative public opinion poll.1 We report trends in personal life satisfaction, satisfaction with how things in the US are going in general, and overall quality of life. We also report on satisfaction with several specific domains: our system of government, the moral and ethical climate, the size and role of big corporations, and opportunities to get ahead in life based on hard work.
In general, respondents’ answers to many of these questions depend on whether their party is in power. While this is especially true for the question “Are you satisfied with the way things are going in the U.S.?” even responses to questions about how people feel about their own futures have historically varied along party lines, with respondents reporting higher optimism when their own party is in power.
Historically, aggregate optimism among Americans has remained relatively stable, with losses in optimism among the out-group offset by gains among the in-group. Another Gallup poll released in early 2026, however, showed unprecedented drops in optimism among Democrats and independents that were not balanced by increases in optimism among Republicans. The survey data we examined suggests a similar departure from the past among Democrats and independents but not Republicans.
In 2026, Democrats’ satisfaction is at an all-time low since Gallup began asking these questions on all eight satisfaction variables we looked at: personal life (80%), overall quality of life (42%), opportunity to get ahead by working hard (24%), system of government (12%), moral and ethical climate (10%), size and influence of major corporations (9%), income and wealth distribution (6%), and the way things are going in the U.S. (3%).
Three variables showed particularly dramatic changes in satisfaction levels and polarization over time.
1. The system of government
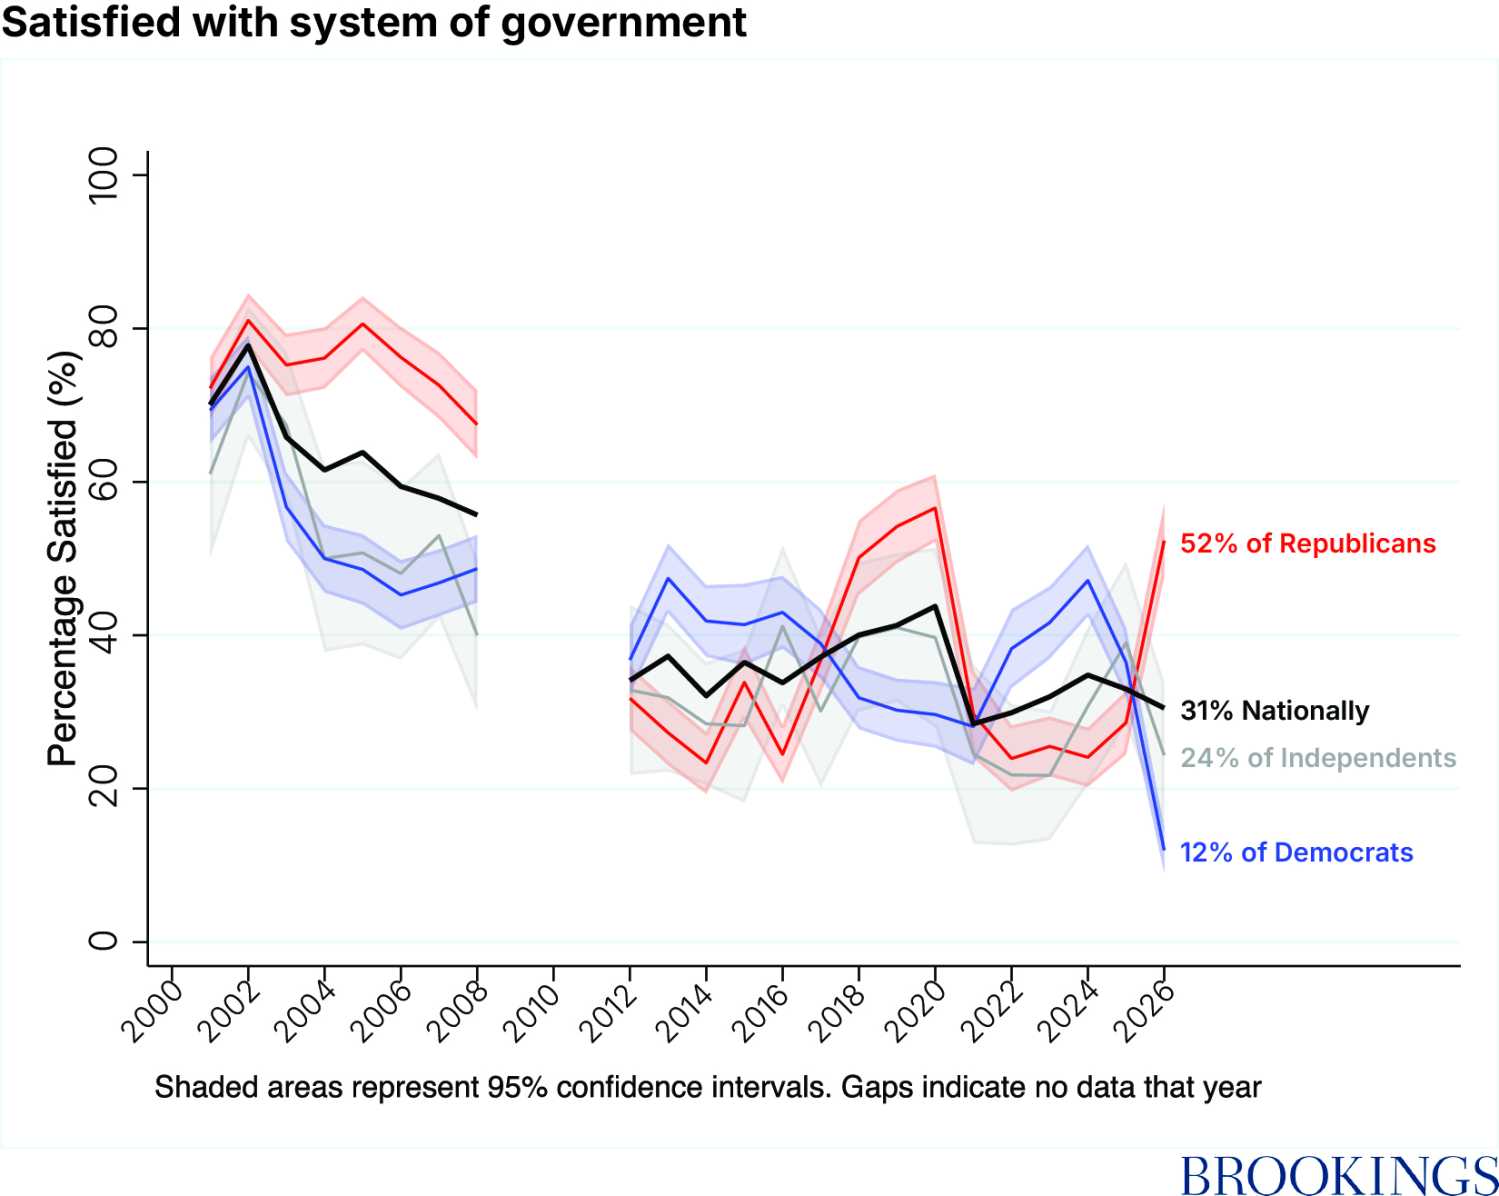
The share of Americans satisfied with our system of government has been between 30 and 40% for the past 14 years. It has typically been higher among respondents whose party is in power. In 2026, 12% of Democrats are satisfied with the system of government, compared with 24% of independents and 52% of Republicans. This is the first time in the past 25 years that any party dipped below 20% satisfaction. These trends again reflect the country’s increasingly extreme levels of polarization, which (not surprisingly) are significantly more pronounced in peoples’ evaluation of the government than in aspects of their personal lives. There is now a record 40-point gap between Republicans’ and Democrats’ satisfaction with the system of government. It remains the case that, as the chart below shows, the party in power is almost always happier with the system of government—but today, more than ever.
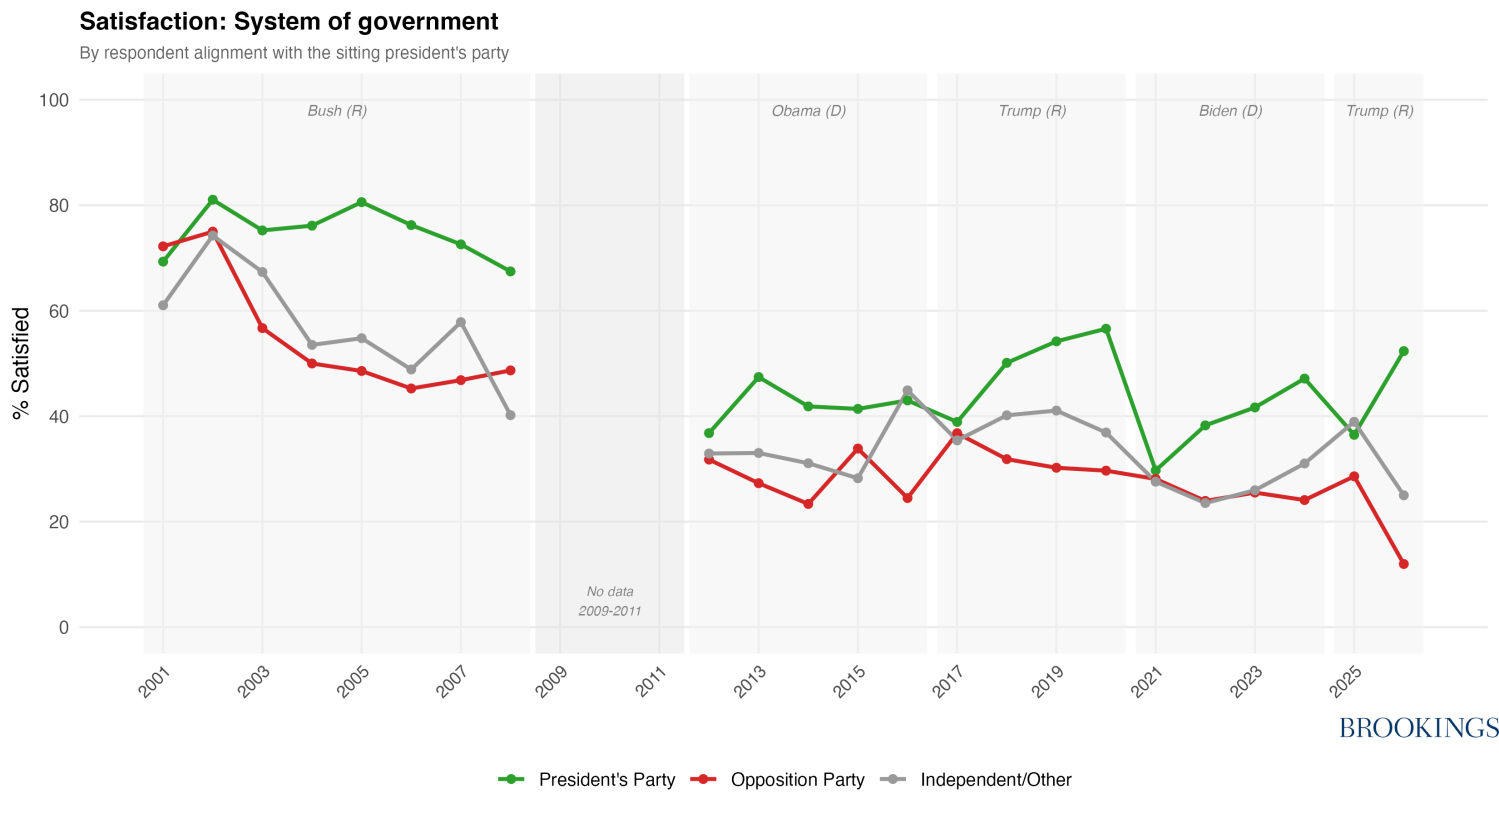
On average, satisfaction in the system of government was falling even before the Great Recession. No group has returned to pre-2008 satisfaction levels since.
2. Overall quality of life
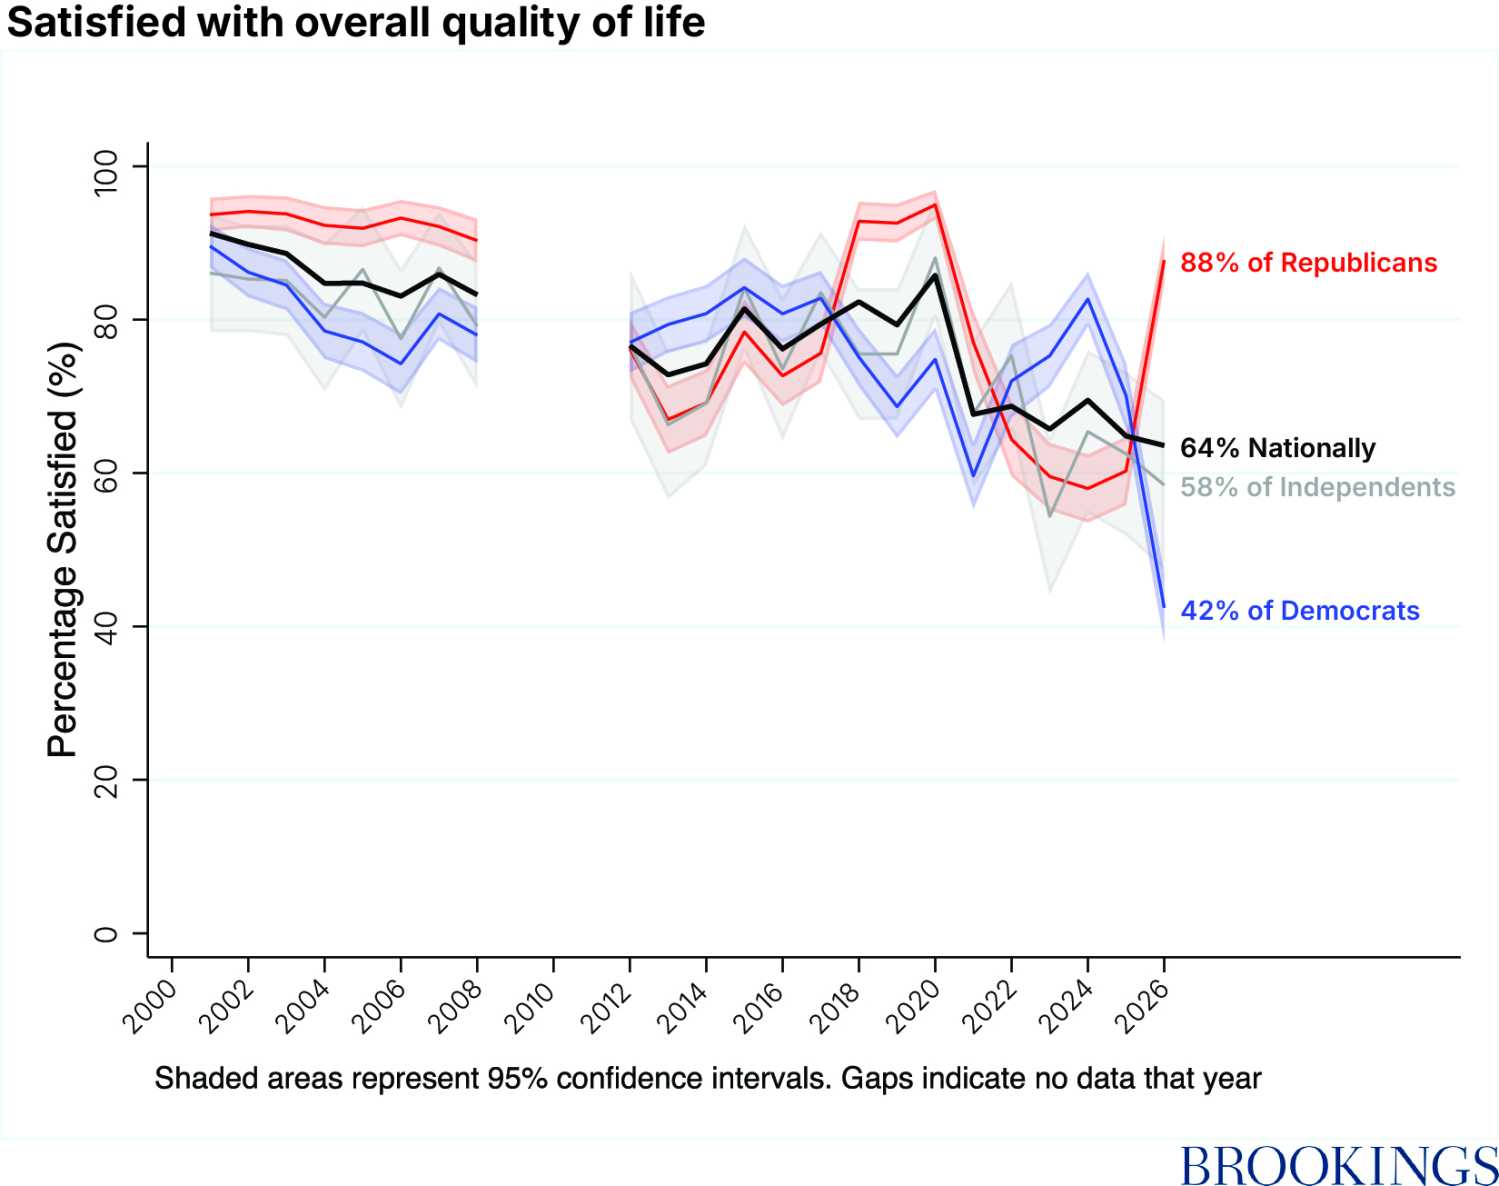
There is now a 46 percentage-point gap between Republicans’ and Democrats’ evaluations of their quality of life. This exceeds any prior partisan gap in evaluations of quality of life. There seems to be a strong protective effect based on whether one’s political party is in power.
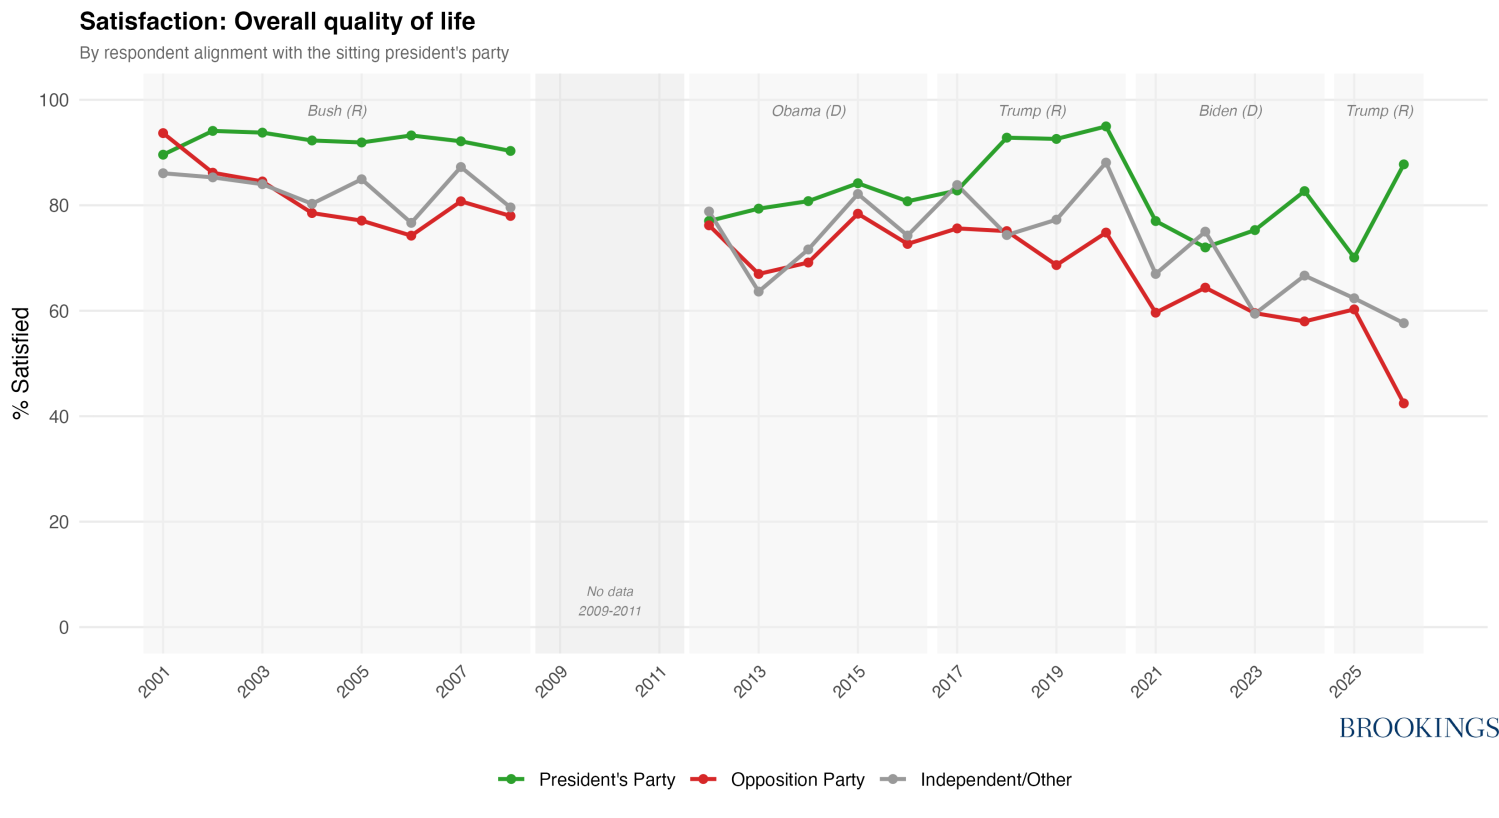
Despite the fact that 88% of Republicans report being satisfied with their overall quality of life, the national average is at an all-time low because Democrats and independents are very dissatisfied.
3. Opportunity to get ahead by working hard
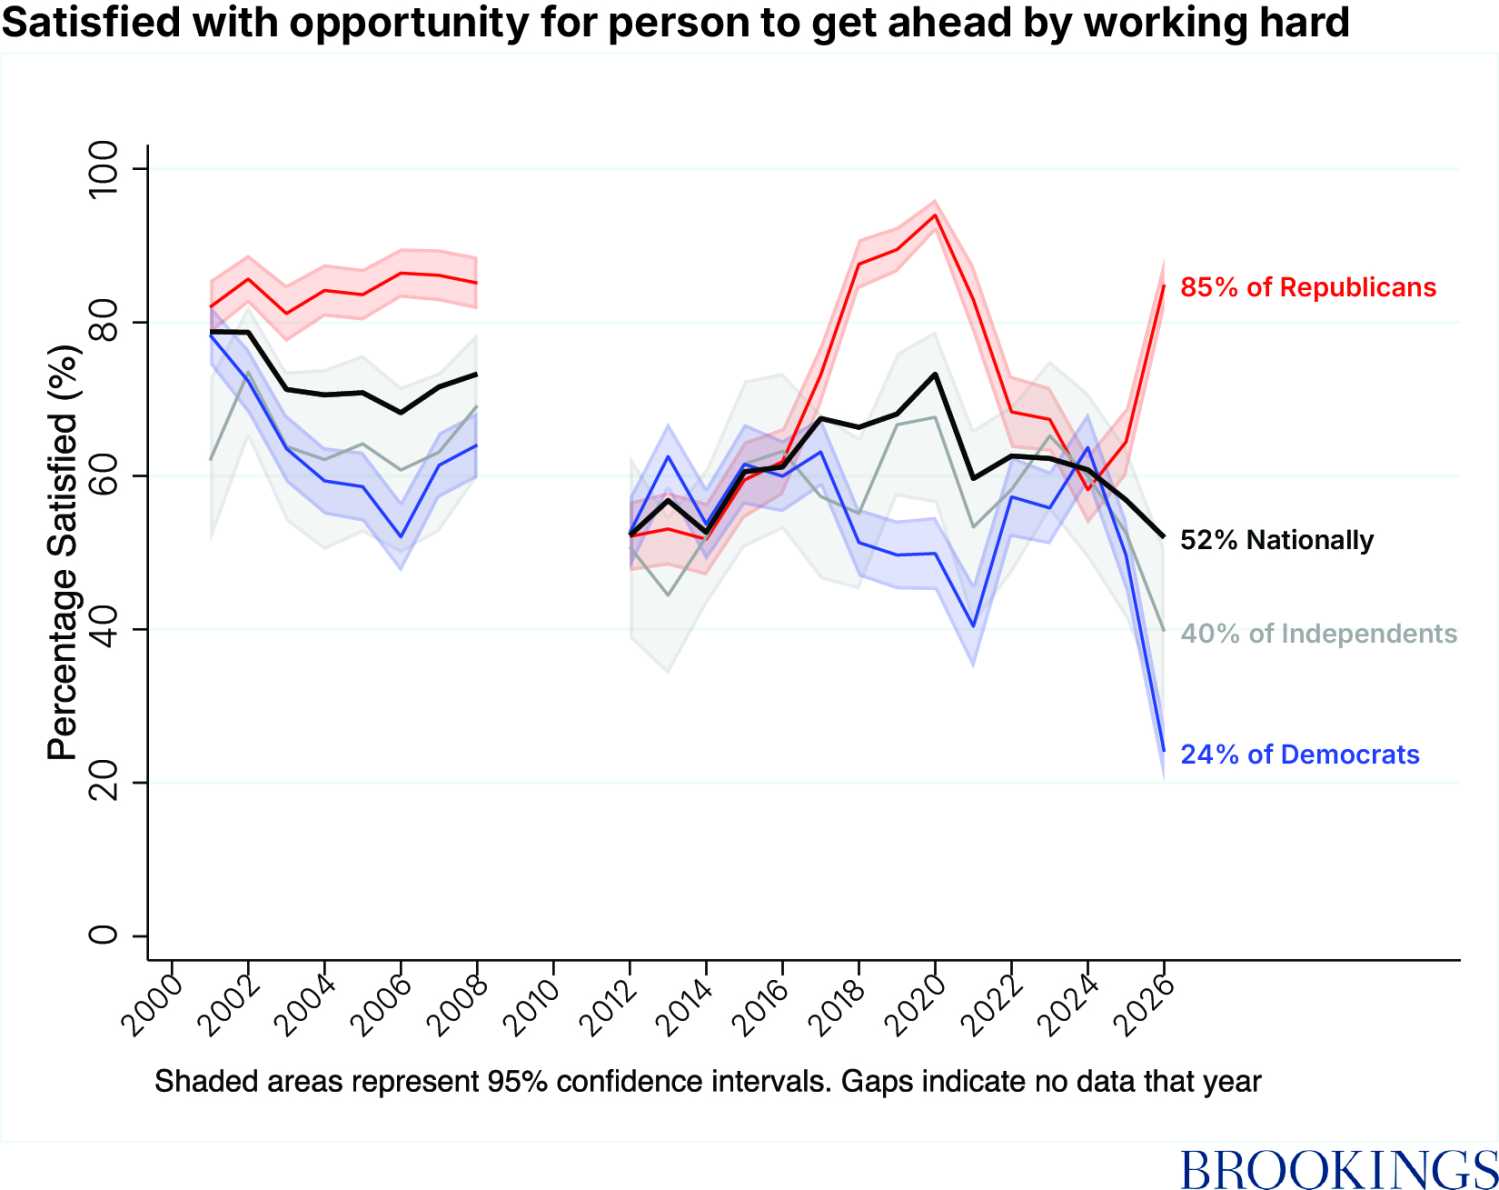
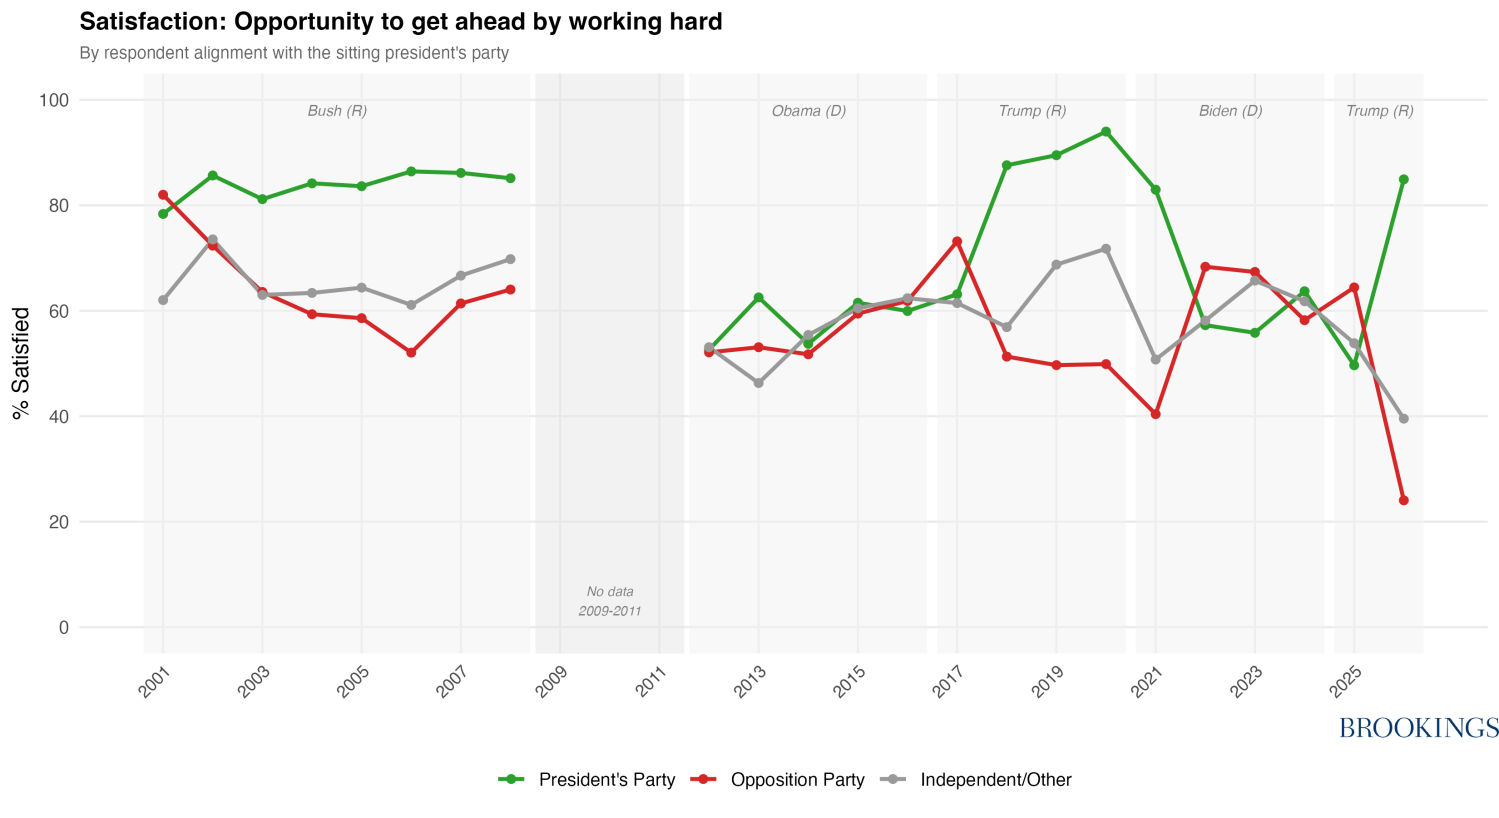
After the 2008 financial crisis, there was a large drop in satisfaction with the opportunity to get ahead by working hard—from 75% satisfied to 51% satisfied. In 2021, the level dropped again and does not seem to have recovered, remaining at 52% in 2026. Republicans are more positive in their responses to this question than Democrats or independents, particularly when the president is Republican. There is now a 61 percentage-point gap between Republicans’ and Democrats’ satisfaction with the opportunity to get ahead by working hard. The second biggest party gap prior to 2026 was 40 points in 2019. Interestingly, the partisan gap in satisfaction with opportunity was much larger under President Trump than under Presidents Bush, Obama, and Biden. In that respect, Trump appears to be a uniquely polarizing figure.
4. Moral and ethical climate
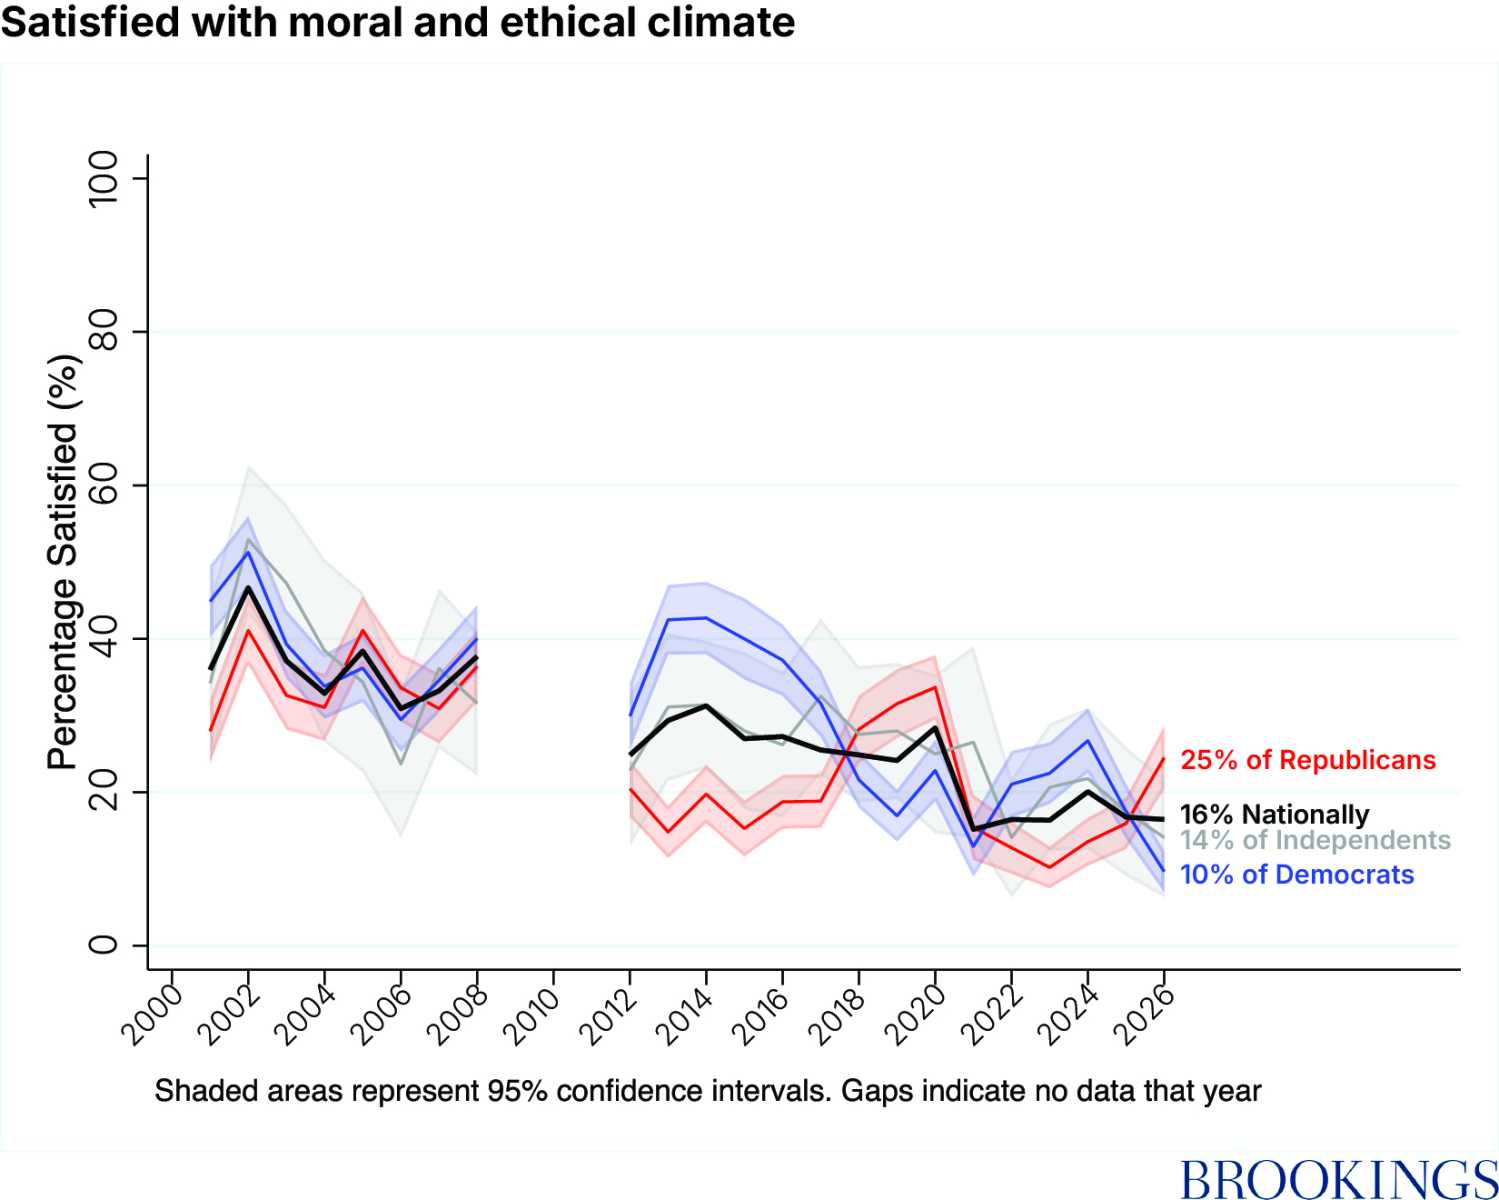
Satisfaction with the moral and ethical climate in the country, meanwhile, is even lower, with only 16% of respondents either very or somewhat satisfied. Prior to 2008, Democrats and Republicans tracked similarly on this question, but after 2012 views of the moral and ethical climate varied much more by which party is in the presidency. That said, since the turn of the century, satisfaction with the moral climate has declined across the board.
5. Size and influence of major corporations

Respondents’ views of the influence and size of major corporations in the U.S. took a hit in 2020, driven by Republican satisfaction dropping from 60 to 30%. Today only 25% of respondents nationally are very or somewhat satisfied with the size and influence of major corporations. Between 2012 and 2024, Democrats’ satisfaction with corporations’ size and influence held steady at about 20%, but in the past two years it dropped to half of that: 9%. This corresponds with the influx of corporate CEOs as political appointees in the Trump administration.
6. Income and wealth distribution
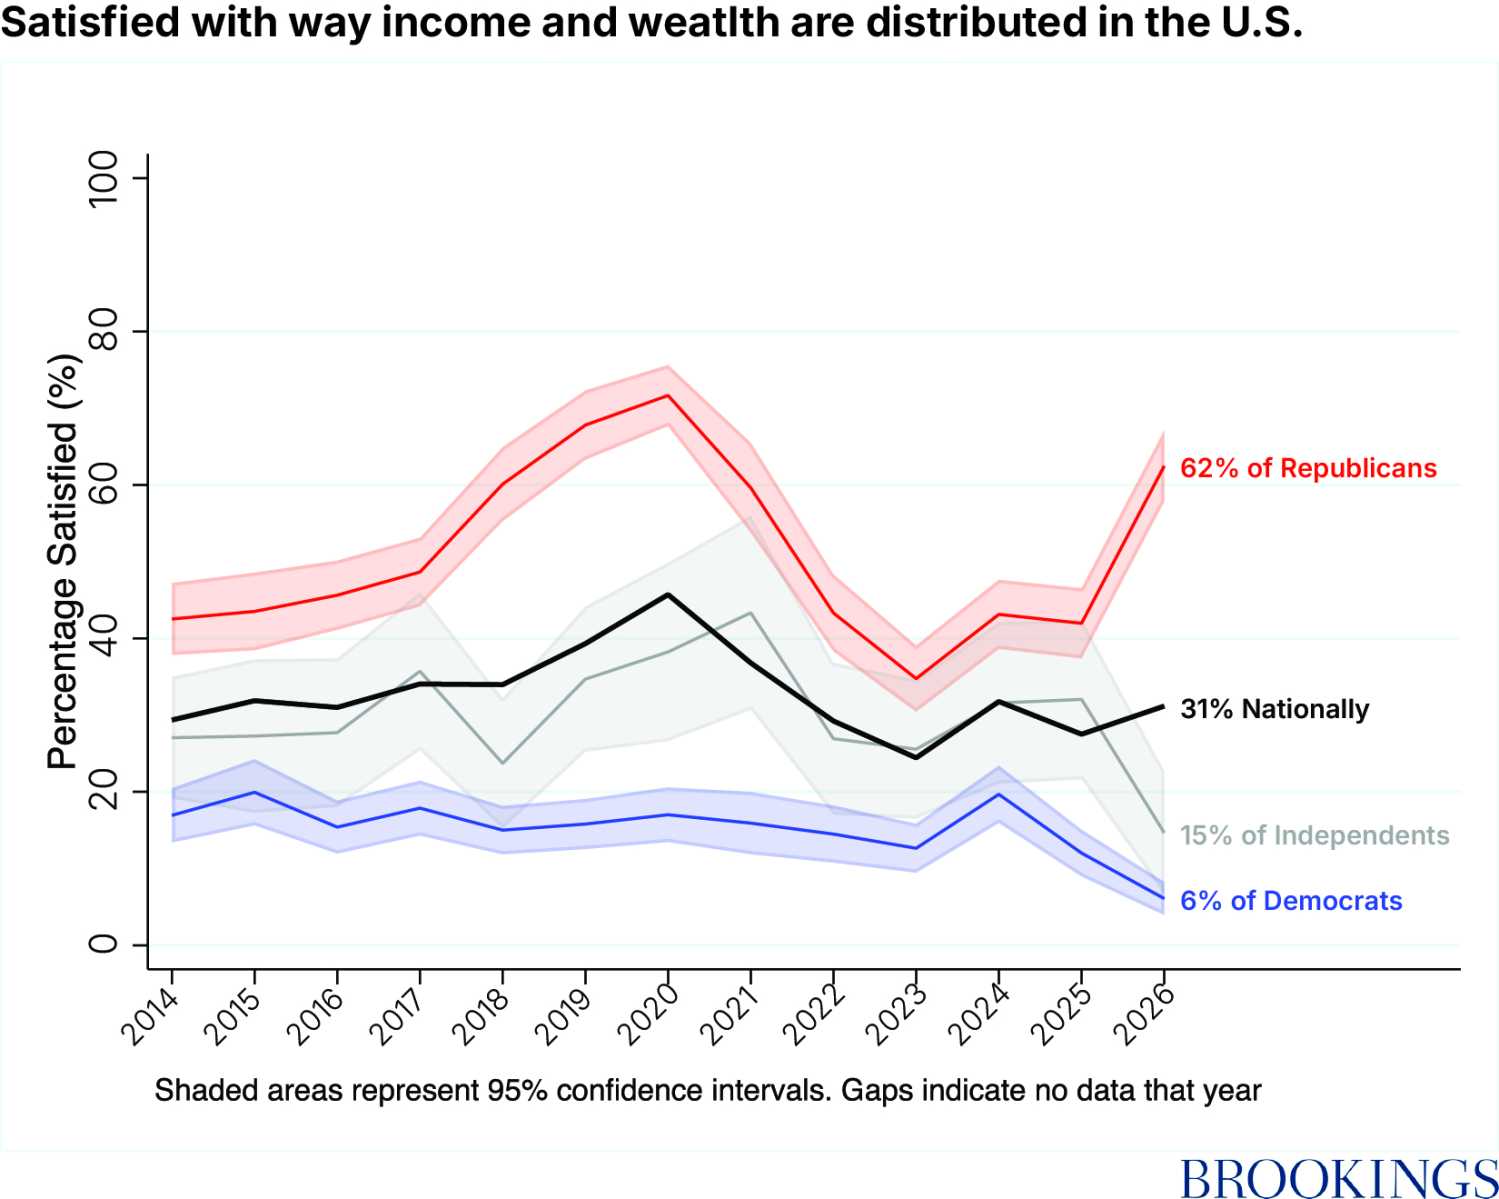
Satisfaction with the distribution of income and wealth has similarly declined in recent years among Democrats and independents, while it has increased among Republicans. Just 6% of Democrats are satisfied with the way income and wealth are distributed in 2026, compared with 20% in 2024. Independents experienced a similar drop, from 30% in 2025 to 15% in 2026. On this dimension, Republicans have been more sensitive than Democrats to party control of the White House (perhaps because Democrats’ satisfaction with income and wealth distribution was so low to begin with). [Note: Gallup began asking this question in 2014].
7. Personal life
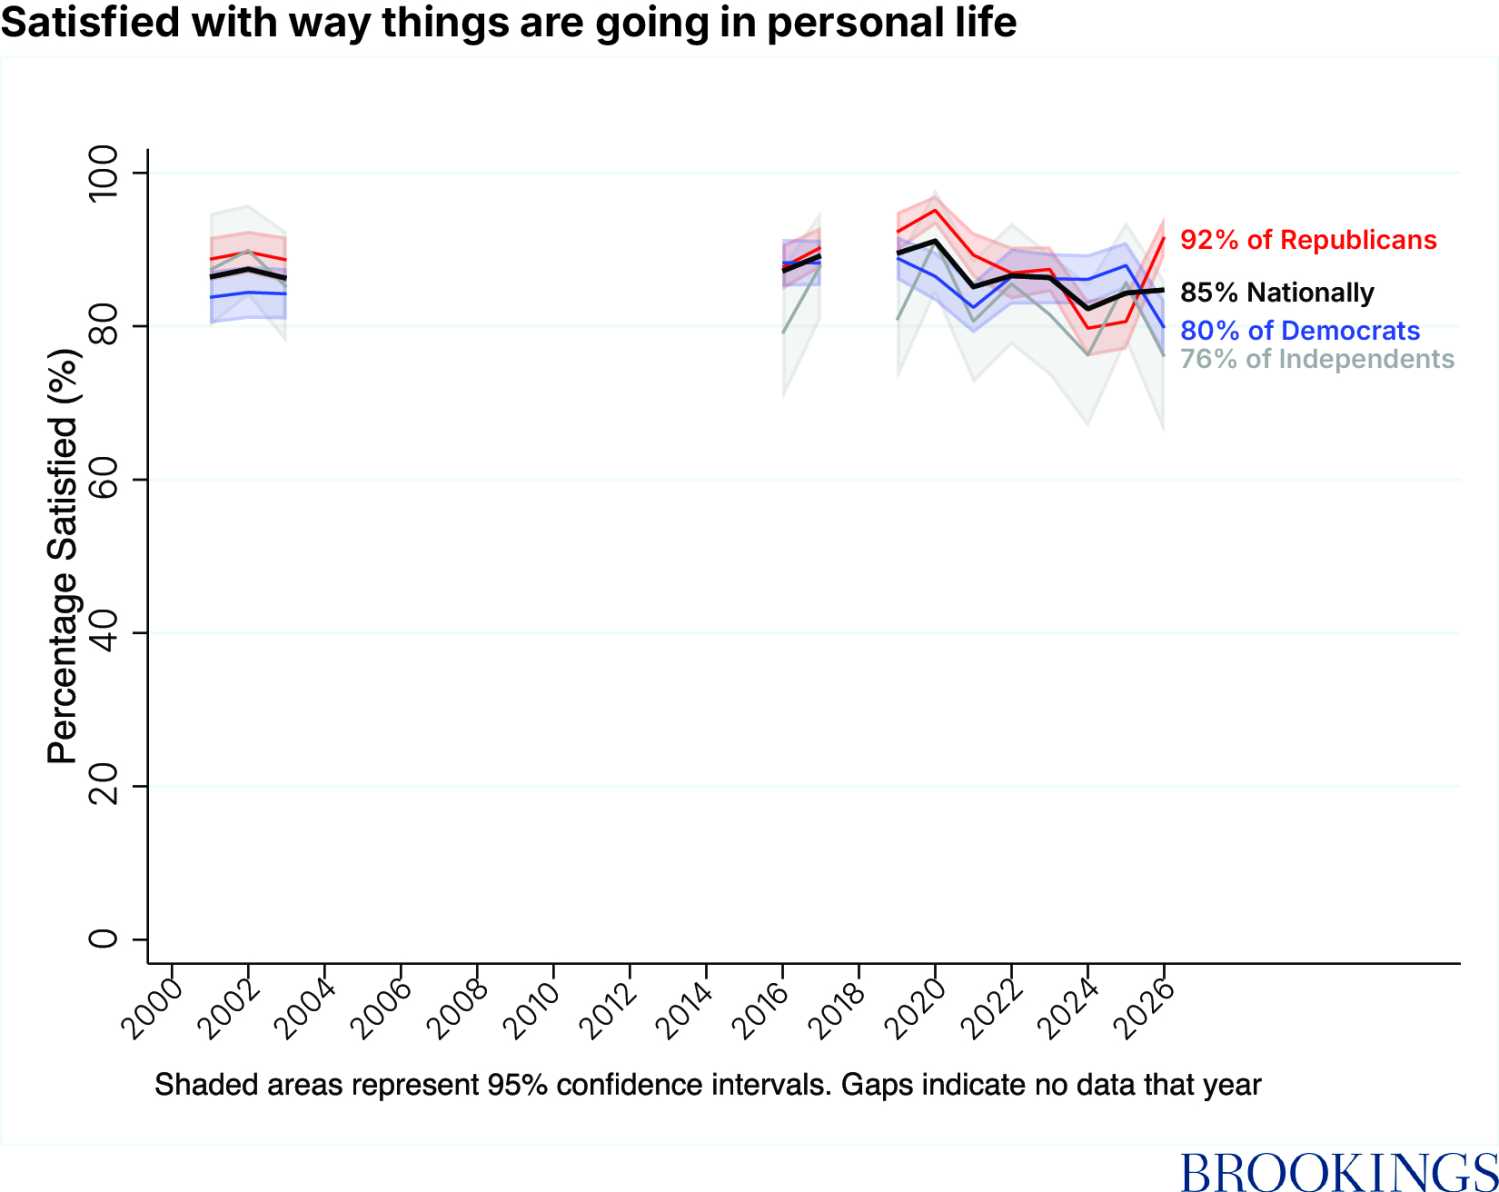
While usually personal life satisfaction and assessments of overall quality of life track closely together, in these times of extreme polarization, answers to the more focused question of personal life satisfaction are beginning to show partisan trends. When the question was asked in 2016-2017, the groups were closer together: 89% of Republicans were satisfied with their personal life, compared to 88% of independents and 84% of Democrats. Today, there is a 12-point gap between Republicans and Democrats’ satisfaction with their personal life. And responses track with which party is in power, reflecting the concept that the personal is political. More than in the past, partisanship influences people’s views of their personal lives—though less on this dimension than on others.
8. The way things are going in the U.S.
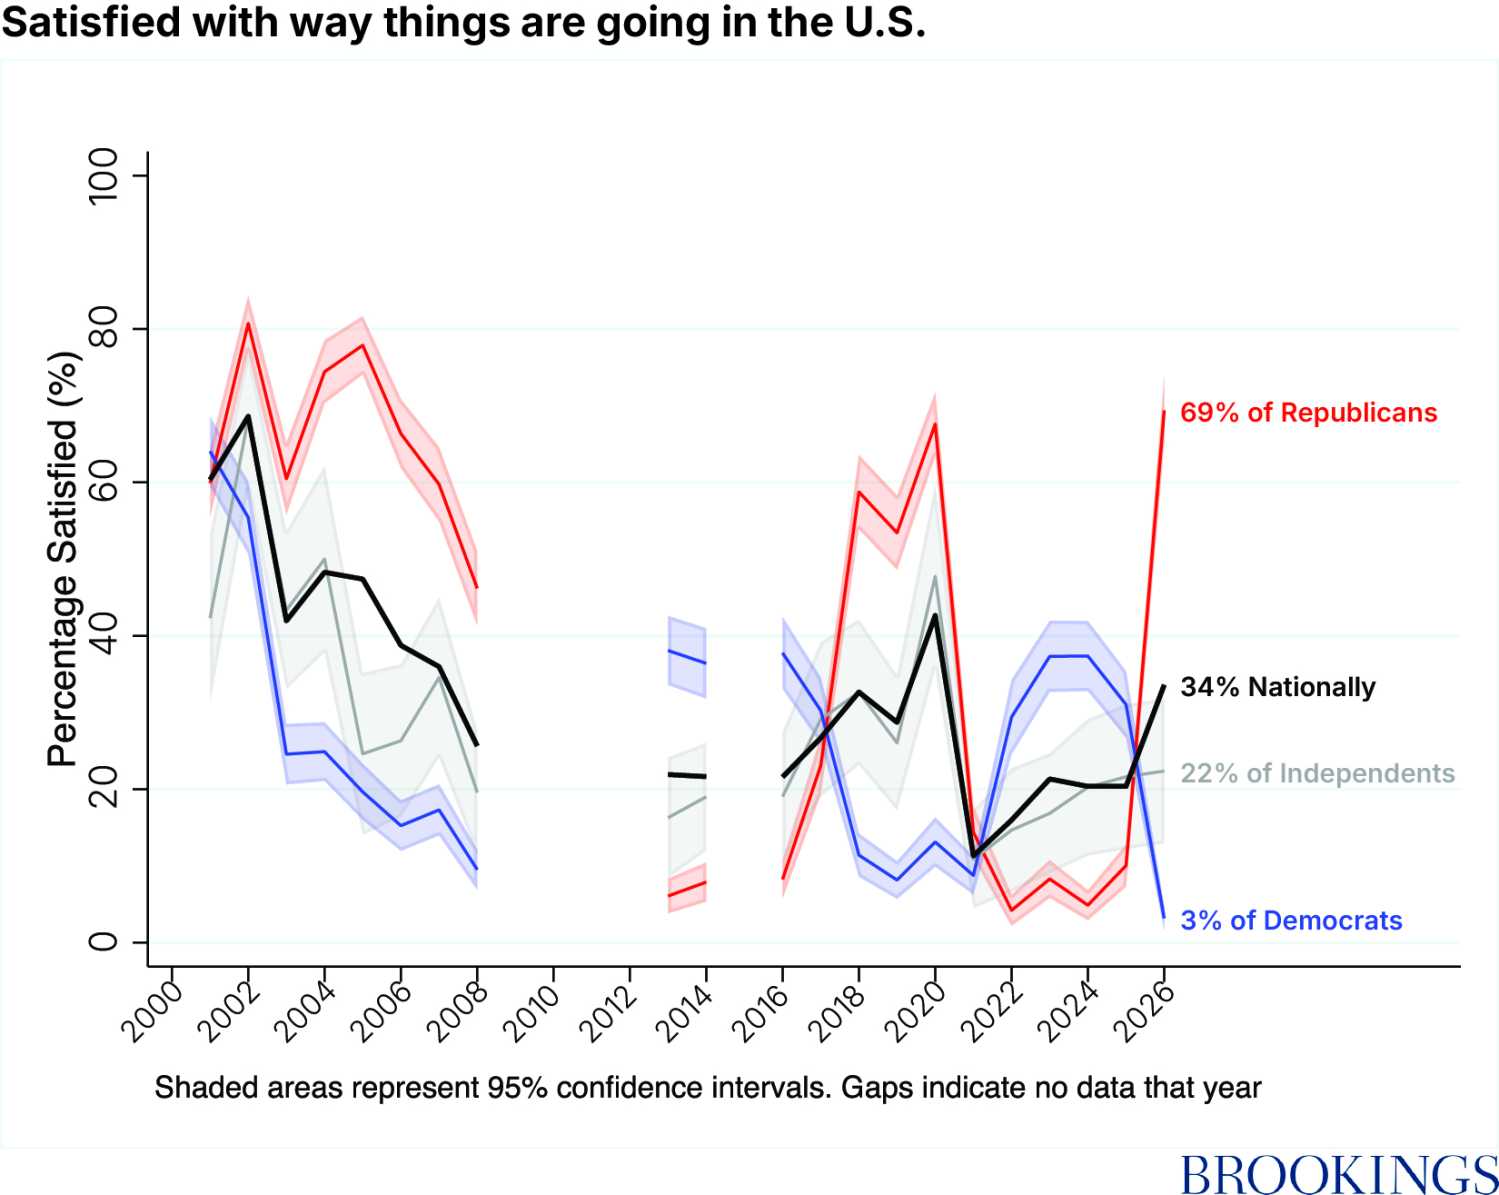
Satisfaction with how things are going in the U.S. began to drop in 2003, reaching an all-time low in 2021, the height of the COVID epidemic. Since 2021, less than 30% of respondents report they are very or somewhat satisfied, although levels have increased from 2025 to 2026 to 34% nationally.
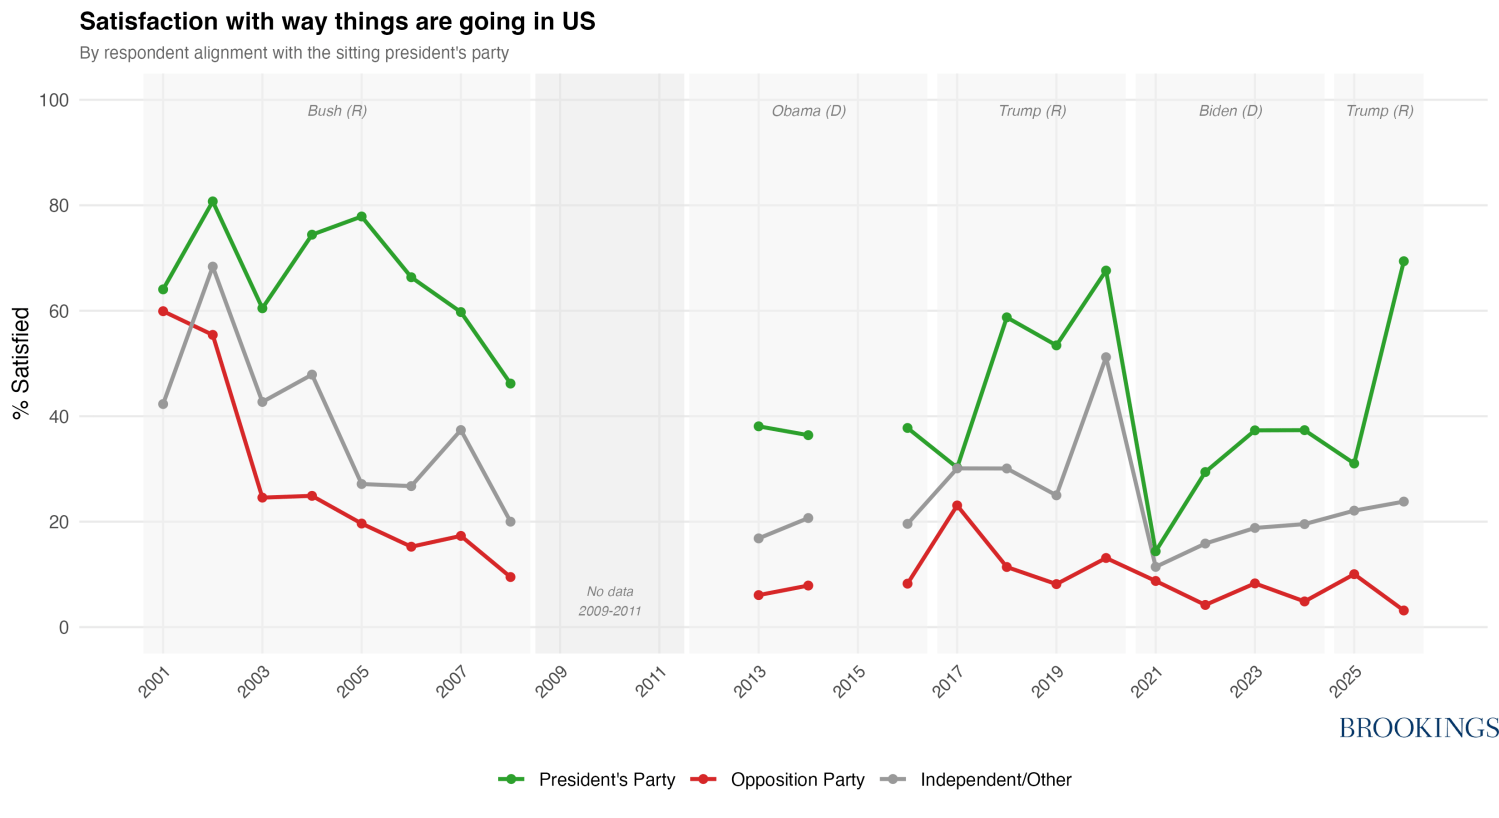
It’s notable that the two Obama years for which data are available are nearly as poorly evaluated as the Covid and Trump years.
When we decompose these trends by party affiliation, we can see that the long-term drop in satisfaction is evinced by all parties, although satisfaction is highly dependent on who is in power—increasingly so as the country has gotten more politically polarized (see our first blog post Extraordinary or not so extraordinary times?). Note that the uptick in satisfaction from 2025 to 2026 is entirely driven by the Republican party—while Democrats’ satisfaction in the U.S. has plummeted.
Although none of these trends can be attributed to any one administration or leader, what stands out is a steady trend of increasing dissatisfaction with the country’s key institutions, and growing skepticism of the cornerstone belief that people can get ahead if they work hard. Unsurprisingly, that is accompanied by an increase in skepticism of the organizations that are supposed to drive and preserve the availability of opportunities, such as businesses and moral and ethical norms.
Growing dissatisfaction with the way our country and our key institutions are working reflects a steady decline of trust in government, the media, and other institutions. Yet many of those trends have been severely exacerbated by negative rhetoric, by weaponization of the law against those who disagree with or are critical of the current administration, by attacks on federal agencies that ground policy in nonpartisan data and analysis, and by the erosion of civility in public discourse. Those trends contribute to social fragmentation and high levels of despair, uncertainty and poor mental health (especially among the younger generation)—and, ultimately, they threaten the viability of our democracy.
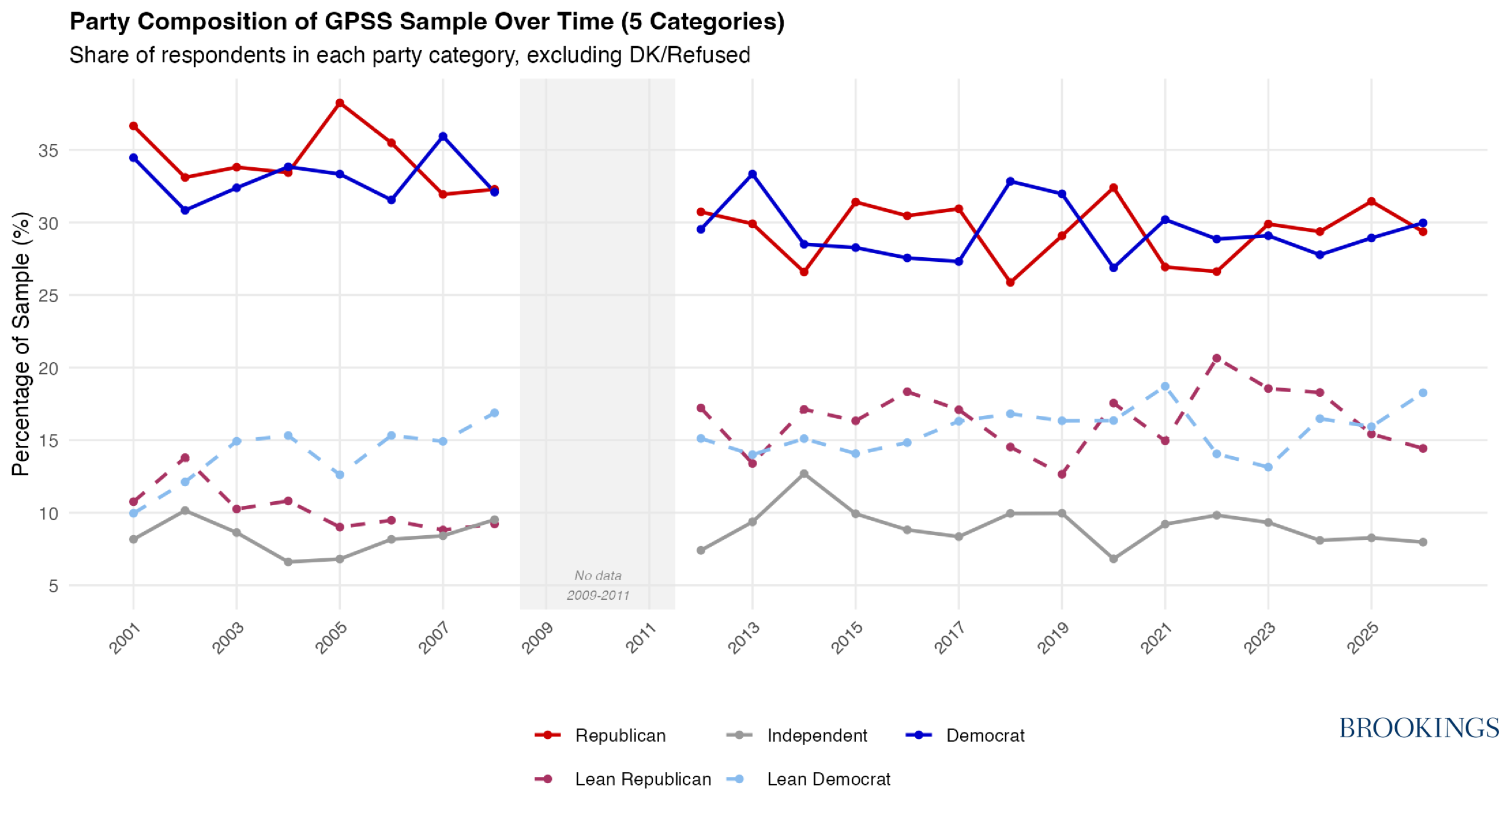
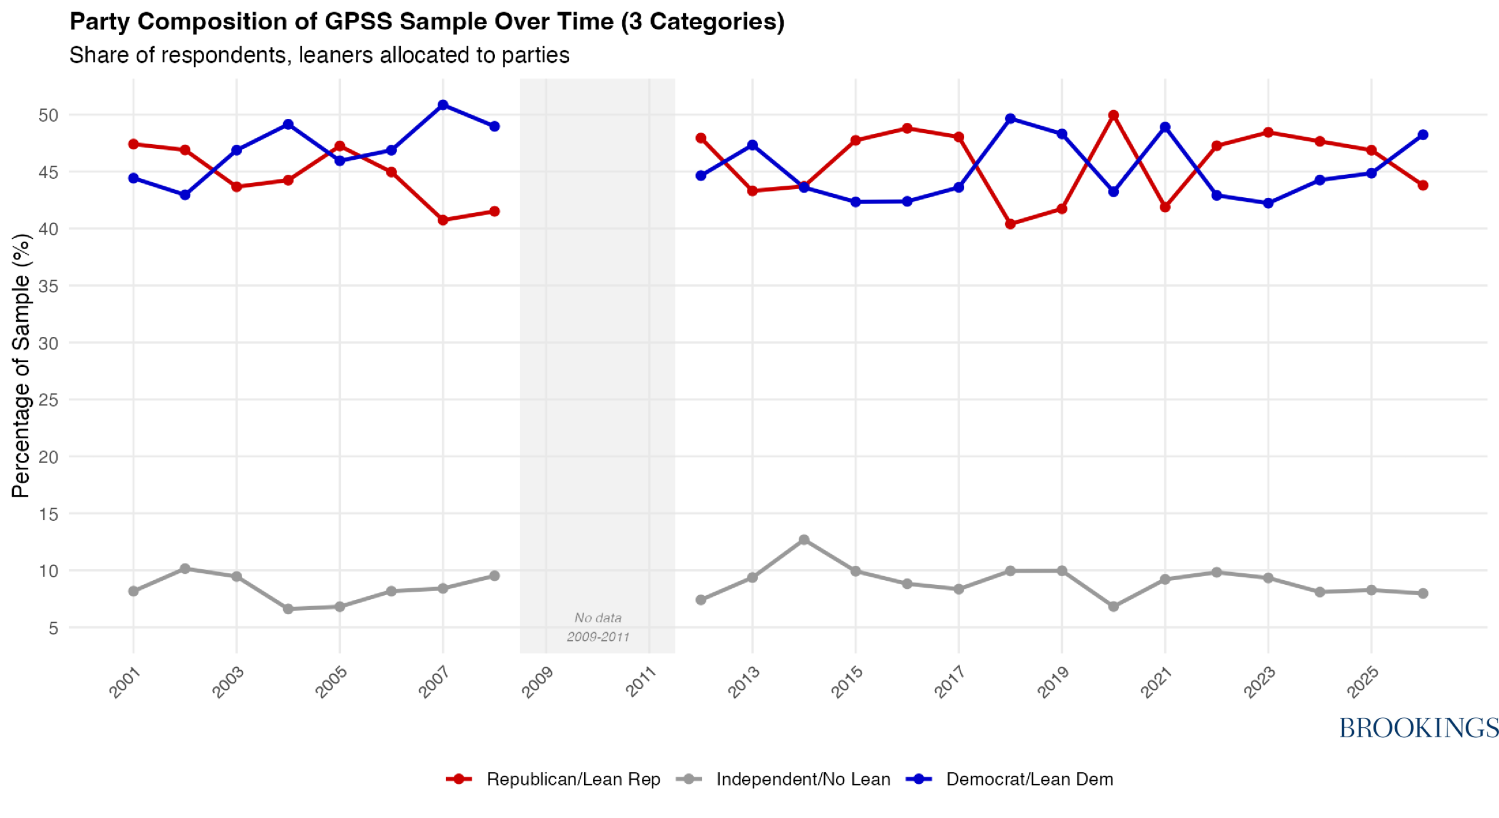
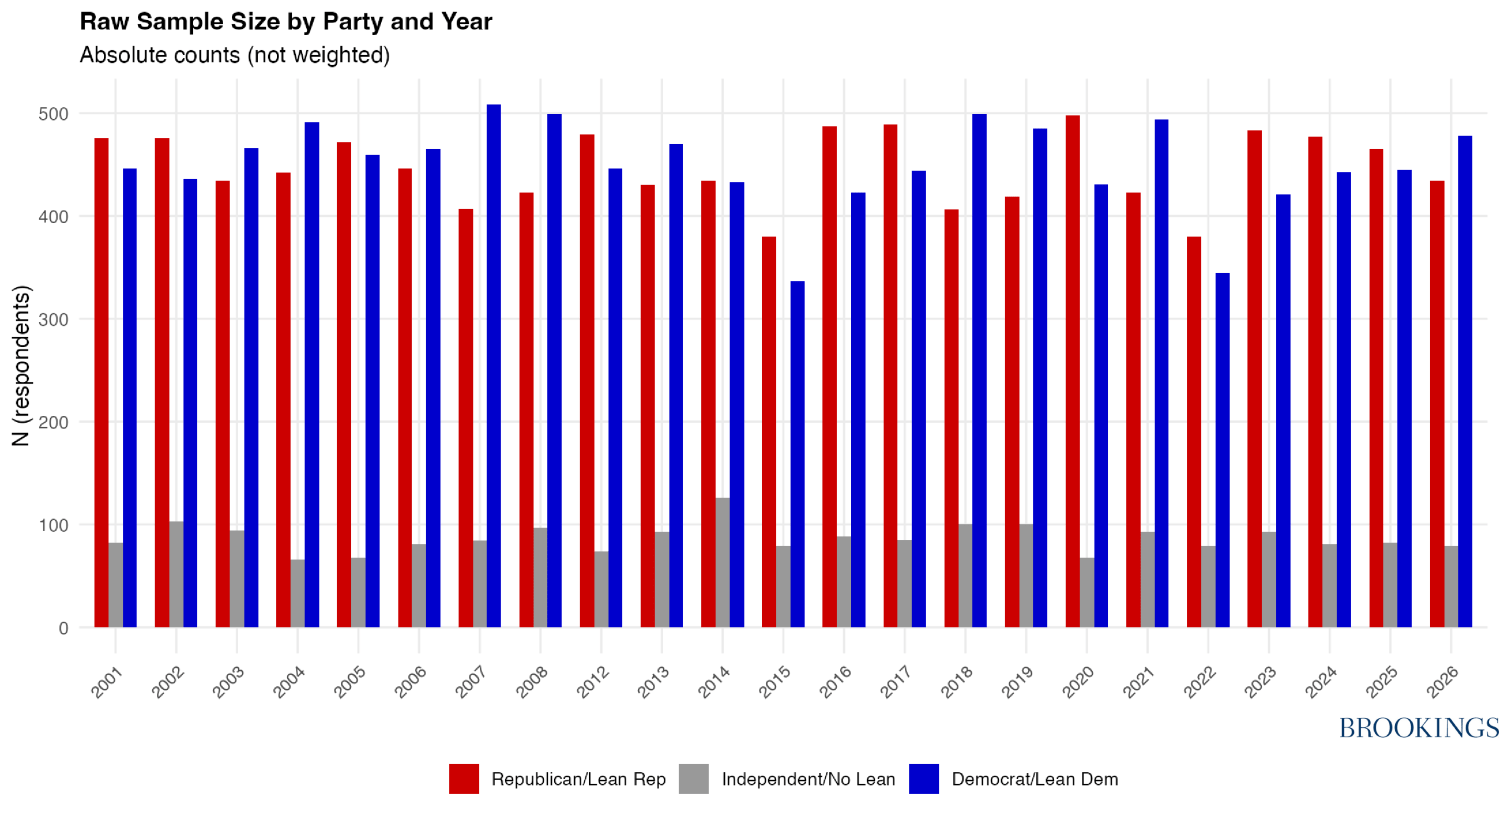
Appendix: Sample details
Authors



-
Acknowledgements and disclosures
The authors thank Jonathan Rauch for very helpful comments and Chris Miller for editing the piece.
-
Footnotes
- The GPSS is a nationally representative, cross-sectional survey administered monthly by Gallup. Participants are recruited via random-digit-dialing and respond to the survey by landline or mobile phone interviews. Each month, at least 1,000 adults complete the survey and the topics vary monthly. January covers satisfaction with various aspects of US society. Carol Graham has access to the data through her advisory capacity as a senior scientist at Gallup.
The Brookings Institution is committed to quality, independence, and impact.
We are supported by a diverse array of funders. In line with our values and policies, each Brookings publication represents the sole views of its author(s).



Commentary
Historic polarization and historic lows in satisfaction with government, quality of life, and opportunity to get ahead
July 9, 2026