Editor’s Note: This briefing note was prepared for a retreat convened by the Independent Research Forum on a Post-2015 Sustainable Development Agenda (IRF2015).
Until the year 2000, investments by developing countries hovered around 4.5 percent of global output, while savings were around 4 percent. The gap between these was the needed external finance for development. It averaged $40 billion per year in the 1980s and $80 billion in the 1990s. Since 2000, however, developing countries as a group have had higher savings than investments, generating a surplus of over $340 billion per year. In most assessments, this surplus is expected to continue into the future.
The developing world, however, is not a homogeneous group of countries so simple aggregate figures can mislead. Sub-Saharan Africa, Latin America and the Caribbean, and emerging and developing Europe currently need large amounts of external financing and are projected to need additional financing in the future, with the financing need in sub-Saharan Africa being most acute. In other regions, domestic savings are more than sufficient to cover investment financing needs.
Similarly, in some countries and regions, government revenues are more than sufficient to provide for basic public services, like health and education, while in other countries and regions, even where there is an external surplus, there is a public sector deficit that needs direct external financing.
Financing for development must address these twin issues: the adequacy of financing to provide for sufficient public expenditures to meet desired social and economic investments, and the adequacy of long-term financing to allow economies to grow and develop to their full potential.
The UN has suggested ranges of 15 to 20 percent of GDP for government expenditure needs in developing countries, or about $8 trillion for all emerging and developing economies by 2019. Looking at needs another way, between 2000 and 2010, domestic and external investments in emerging and developing countries quadrupled from $1.6 trillion, to $6.9 trillion, and, according to the International Monetary Fund (IMF), they will double again to $13.8 trillion by 2019. While the magnitudes are smaller, the trends for Africa are similar: a tripling of investment between 2000 and 2010, and approximately $0.5 trillion in investment is forecast for 2019.
Of course, financing needs, whether for government expenditures or for investments more broadly, depend heavily on policy frameworks. The development outcomes that public expenditures and investments seek to generate can be improved when sensible policies are put in place. So any discussion of financing is incomplete without a country-by-country assessment of the potential for policy reform. But in the right policy environment, more financing can help accelerate development.
Regardless of the level of external financing needs, the major source of external financing is now private capital, especially FDI.
Development financing can be defined as sources of finance separate from the domestic private sector. It can be broken down into four components, each of which contributes to both objectives of meeting needed public finance and external financing for growth:
- Revenues of developing country governments themselves (these also reduce external financing needs when public savings go up);
- Concessional development assistance, both external grants and concessional credits, that may fund public or philanthropic expenditures, or catalyze growth-enhancing private financing;
- Non-concessional loans taken out by (or guaranteed by) developing country governments, from international financial institutions or private sources, typically used for infrastructure or other revenue generating projects;
- Private external finance, in the form of foreign direct investment (FDI) and other portfolio flows, mostly targeted to growth objectives rather than social objectives.
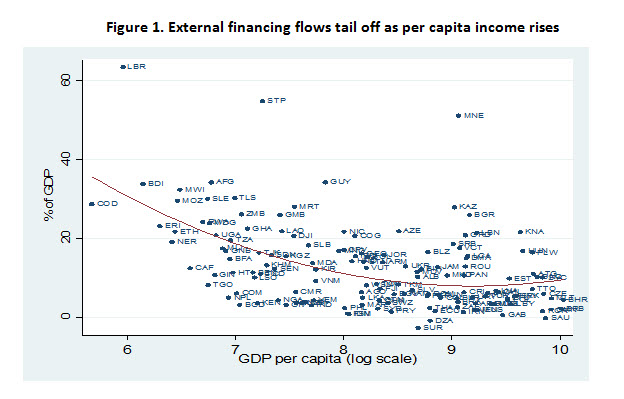
The range of country external long-term financing (components 2 to 4 in the list above), expressed as a share of its GDP, is shown in Figure 1. Each data point represents the annual average of total long-term financing flows to a country over the period 2000-09 expressed as a share of its average GDP over the decade. The figure also shows a best fit curve. The general pattern that emerges is that many low income countries receive considerable external financing support, often amounting to over 20 percent of GDP, but that financial flows tail off as country per capita income levels start to rise. This general pattern, however, conceals many individual country differences.

Regardless of the level of external financing needs, the major source of external financing is now private capital, especially FDI. Grants and other private financing for social financing, like external health financing, also make a notable contribution for the 20-25 low income countries where FDI is minimal. But private capital has accounted for over 80 percent of long-term flows to developing countries since 2000. It is the dominant source of external capital for middle income countries, and now even in low income countries FDI is larger than concessional development assistance (CDA) in 30 percent of the cases.[1] Development finance must take into account this changing global context:
- The scale of investment needs is sharply higher than ever before and growing at a rapid rate;
- Developing country circumstances vary greatly, with some requiring large flows of external capital, while others self-finance their development. Similarly, some countries require substantial assistance to fund public expenditure needs, while others generate enough of their own revenues, while still needing external finance to take full advantage of growth-enhancing investments;
- Financing flows fall off sharply as countries move into lower middle-income status;
- CDA remains in financing public expenditures and external deficits for selected low income countries;
- Private capital is now the dominant source of filling external funding gaps for most countries.
Sources of Development Financing
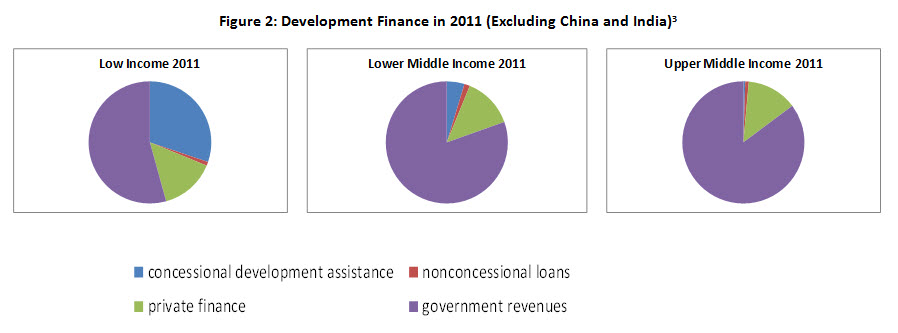
In 2011, developing countries (excluding China and India, which are each treated as sui generis in the analysis below) mobilized around $2.8 trillion of development financing[2], of which $2.3 trillion was through the domestic revenue mobilization of their own governments. As Figure 2 below shows, there is a consistent pattern in the changing financing structure as countries grow richer.

- Low income countries relied on external financing for just under one-half of their total development financing, and the share gets progressively lower as countries get richer;
- CDA is of considerable importance in low income countries, but becomes progressively smaller as a share of finance as countries get richer;
- About half of CDA goes to low income countries; but even upper middle-income countries receive substantial amounts of CDA ($11 billion in 2011);
- All country groupings receive significant amounts of private finance. There is no indication that relative shares of private finance change much as countries get richer over time;[3]
- Within private finance, FDI is the most important component for all countries, and most countries, including many low income countries, receive significant flows of FDI;
- Public and publicly guaranteed loans from all international financial institutions and other sources are comparatively small in every income category.
Trends in Development Finance, 1990-present[4]
Over a fifteen year period from the late 1990s to 2010/11, financing has more than doubled in real terms for all of the four components identified above. In the analysis below, we summarize trends by category of finance.
Government revenues are the largest source of development financing and prospects for continued increases are good.
Government Revenues. Government revenues have been the fastest growing category of financing to a level in 2010/11 that is 2.5 times as high as in the late 1990s in real terms. The ratio of government revenues to GDP has risen at all income levels, but most strongly in low income countries where the share was lowest to start with.
Government revenues are the largest source of development financing and prospects for continued increases are good, based on strong economic growth projections in developing countries and large natural resource revenues in many countries in sub-Saharan Africa in particular. Middle income countries typically have revenue shares in GDP that exceed 20 percent, providing a solid financial basis for most required development investments.
Concessional Development Assistance. CDA has risen fast, by about 240 percent over fifteen years, driven by an expansion of grants. This is consistent with the Development Assistance Committee (DAC) finding that not only has ODA risen rapidly since the late 1990s, but the share of what is called country programmable aid (roughly corresponding to the actual aid that crosses borders to reach developing countries) has also increased.
Table 1: Top 25 countries by share of net ODA disbursements in GDP
The rise in grants is partly a substitution as donors have shifted their operations from concessional credits to outright grants. In the 2000s, bilateral concessional credits had fallen to very low levels, before rebounding as part of the crisis response measures undertaken by donors that became effective in 2010/11. In fact, most of the concessional assistance received by upper middle-income countries has taken the form of credits, rather than grants.
Financing for low income countries is substantial, but there are large differences as to how much countries receive. The problem of “donor orphans,” identified by the DAC, is brought out by the between-country differences in this data.
Non-concessional public and publicly guaranteed loans. Non-concessional loans from public bilateral and multilateral financial agencies, along with public and publicly guaranteed loans from private capital markets, have become a counter-cyclical funding source rather than a source of financing for long-term investments. In terms of net disbursements, non-concessional loans amounted to 14 percent of total external financial flows to developing countries in the 1980s, but then turned negative in the 1990s and 2000s, before rebounding as part of the crisis response in 2010/11.
Lower middle income countries have seen particularly large swings in their access to public non-concessional financing. This may be associated with demand factors (many countries have expressed dissatisfaction with the speed of loan processing by international financial institutions (IFIs), and by the burdensome criteria sometimes attached to loans), or supply factors (many institutions have caps on total amounts or individual country ceilings for risk reasons, and there is no systematic approach to expansion or recapitalization of these institutions).
There have also been swings in public and publicly guaranteed loans from private capital markets, although these have been less severe than the swings in flows from IFIs.
Private capital. Private capital flows have surged, especially FDI. All country groups now receive over 5 percent of their GDP in private capital flows, including low income countries. In addition to FDI, private companies in low income and lower middle-income countries have started to be able to access global debt markets to a significant degree. These flows, of private non-guaranteed loans, have now become more important in each country grouping than public and publicly guaranteed loans.
The growth of private financing to countries that were low income has been especially strong. It is up eight-fold since the 1990s. Part of the trend of globalized capital markets has been the willingness of private capital to flow to more and more countries.
Issues for Discussion on Overall Trends in Financing
- What are the “needs” for each type of finance for different categories of countries? What “should” the pies look like and how can they all be increased simultaneously?
- Is it useful to integrate discussions on the four major instruments of financing more closely with each other? For instance, aid-for-tax administration is a topical issue. Less than one percent of aid is devoted to tax administration and potential pay-offs are huge. Catalytic aid, or domestic financing, could be used to stimulate private finance in a range of sectors, like agricultural value chains, infrastructure public-private partnerships (PPPs), natural resource extraction ventures, and social entrepreneurs. Greater government revenue improves creditworthiness that then permits more access to external private financial flows. These examples suggest that there are complementarities between different financing sources, a different perspective from the present narrative that often views financing from different sources as substitutes.
- Has too little attention been paid to public non-concessional lending, especially for the growing number of lower-middle-income countries? In the past, public non-concessional lending has acted as a bridge between aid and private finance. Even without that bridge, private finance is becoming more important in low income countries, but could that be accelerated and strengthened if public non-concessional finance was available to leverage private finance?
- The overall development impact of aid is reduced when alternative sources of finance become available. Therefore, it is important to think about the maximum effect of aid in the context of all other financing. Aid can make a large difference in a few small countries where it is critical in the provision of public services. But in other places, the likelihood that aid might substitute for domestic revenues must be considered.
- Empirical evidence suggests that “fungibility” of aid is the norm rather than the exception. Doesn’t this imply that finance should be thought of in the context of overall development needs, rather than disaggregated into “needs” for specific sectors? How would this link with the reality that many of the gains in aid transparency and linking financing to measurable outcomes have come through new sector-specific institutions? If there is an overall envelope, should it not apply to development and climate finance together?
The author would like to thank Christine Zhang for her assistance.
[1] Of course, as upper middle-income countries are richer and mobilize more resources from all sources, the amount of FDI they receive is higher even if the share of FDI in total financing remains constant.
[2] Analysis based on a sample of 89 developing countries for which data is available for the 1990s.
[3] The term Concessional Development Assistance is used here instead of Official Development Assistance (ODA) as the source of the data is the balance of payments rather than reports by donors. Conceptually, CDA should include all grants (public and philanthropic), as well as net disbursements on concessional aid. The inclusive concept of grants also covers peacekeeping and other forms of assistance that may not be treated as “developmental” for the purposes of defining ODA.
[4] All data are converted to and expressed in 2005 US dollars.
The Brookings Institution is committed to quality, independence, and impact.
We are supported by a diverse array of funders. In line with our values and policies, each Brookings publication represents the sole views of its author(s).


