During the 2021 Leaders Summit on Climate, President Biden pledged that, on the road to economy-wide net zero emissions in 2050, the U.S. power sector would be carbon pollution free by 2035 (White House 2021). Meeting these goals requires building clean energy infrastructure at an unprecedented speed. Permitting reform—that is, changing the processes for obtaining government approval to build and operate energy generating, energy transmitting, and energy storage systems—has attracted notice because permitting-related bottlenecks have stymied both the speed and the scale of the clean energy transition. In this set of facts, The Hamilton Project highlights key economic facts about the state of permitting reform and where attention should be focused to accelerate building out clean energy infrastructure.
Since 2012, policymakers have instigated a series of modest reforms to the federal permitting process, through actions such as establishing and supporting the Federal Permitting Improvement Steering Council (Liscow 2024), streamlining review processes (Minott, Fishman, and Jacobs 2023), and expanding the use of categorical exclusions (White House 2024). Over the past 15 years, federal permitting durations have decreased (fact 2), in part due to these policy actions. While such actions improve permitting efficiency, nearly all wind and solar projects are exempt from the three most relevant federal permits (fact 1). Intense focus on federal permitting reform will not speed up most clean energy infrastructure projects.
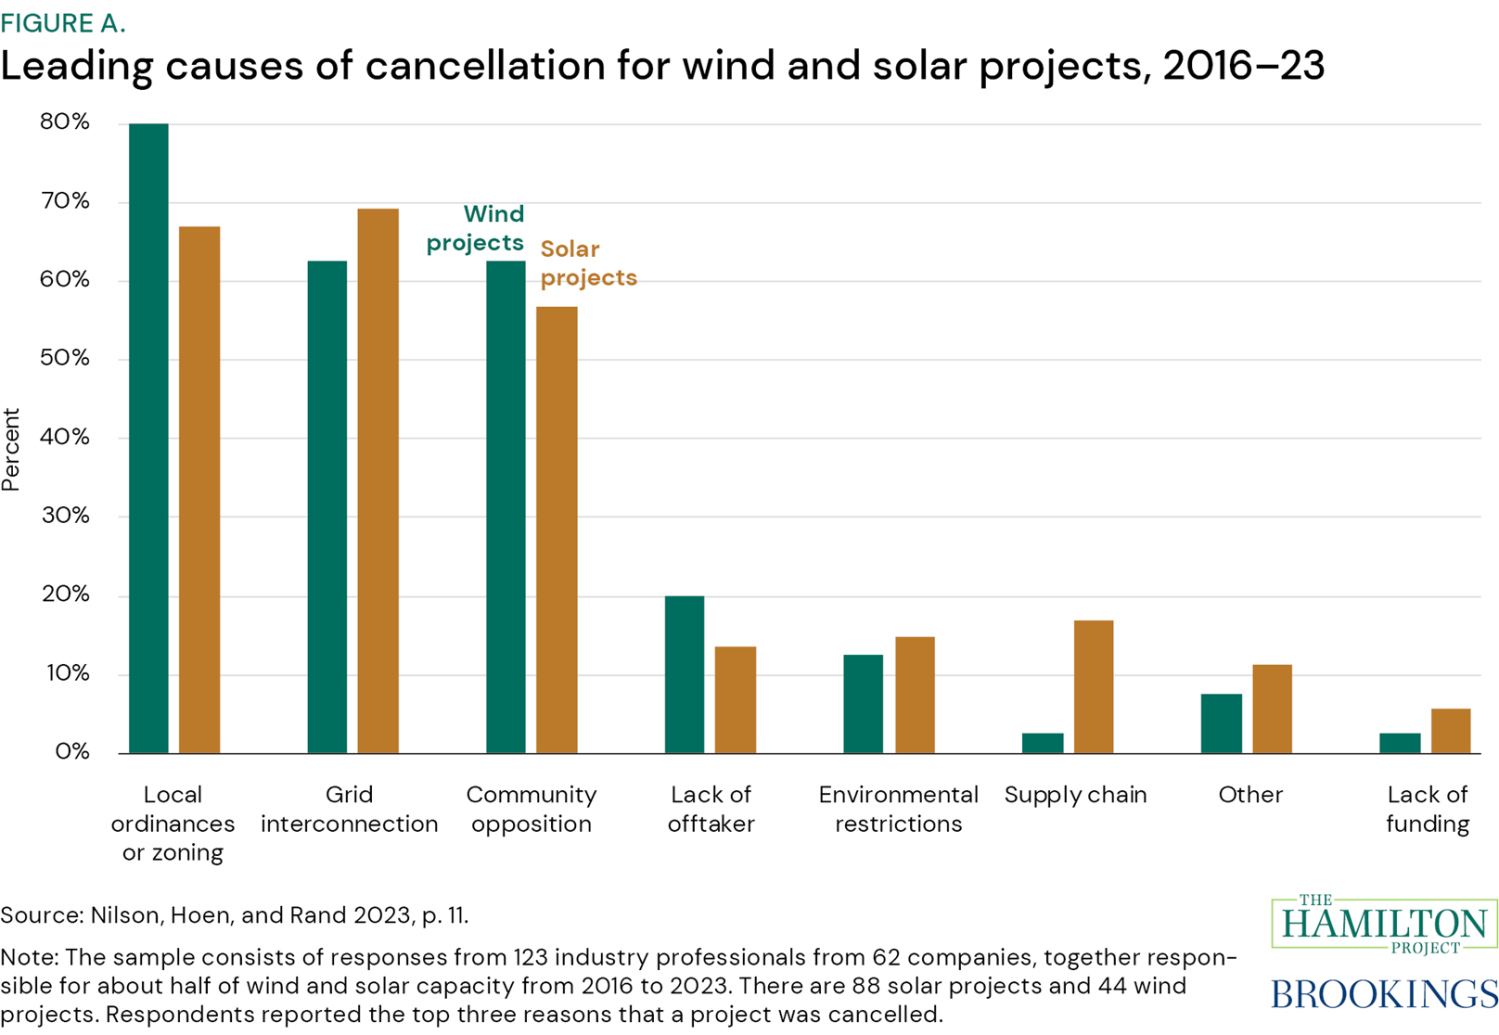
Nonetheless, there are significant permitting issues that inhibit project completion—but they are typically at the state and local levels. In 2023, researchers at the U.S. Department of Energy’s Lawrence Berkeley National Laboratory (LBNL) surveyed utility-scale wind and solar developers, asking them what the leading causes of solar and wind project cancellation have been for projects that were cancelled in the preceding five years. These developers, representing firms that comprise about half of the solar and wind capacity in their respective markets, were asked to pick up to three reasons for cancellations. Figure A shows that the two leading causes of cancellation of wind and solar projects in the five years before the poll were local ordinances or zoning and grid interconnection. Local ordinances or zoning are enforced through the requirement of local permits. Grid interconnection requires site-specific feasibility studies, effectively a type of permit, and occurs in parallel to external permitting processes, typically at the state and local levels. Community opposition is also tied into permitting, insofar as the permitting process itself is how projects can be challenged; those too are mostly at the local level. In fact, some believe agencies’ long permitting processes are a proactive defense against future citizen lawsuits (Sud, Patnaik, and Glicksman 2023). These three reasons are also the top reasons that developers gave for project delays of six months or longer (Nilson, Hoen, and Rand 2023).
These developers’ perceptions are borne out in facts 3 through 8:
- Community opposition can be expressed in the form of lawsuits, since government-issued permits are open to challenge in court. That means that even if a federal environmental permitting process is swift and efficient, community opposition can slow down the process. Nonetheless, energy infrastructure projects are generally subject to state oversight; most challenges to solar and wind projects are at the state or local level (fact 3).
- Local ordinances and zoning rules constrain which clean energy projects can be built, and where they can be sited; restrictions that limit or outright ban projects are prevalent (facts 4 and 5).
- Getting generation and storage interconnected to the grid is slow (fact 6) and has slowed even more over time (fact 7). The slowdown partly reflects challenges in the federal permitting process but also significant challenges in the state and local permitting processes. This slowing, in combination with a surge in the number of projects entering the queue each year (Welton 2024), has left more capacity stuck in the queue than operating online (fact 8).
To meet the nation’s carbon emissions goals, the pace and scale of building energy infrastructure over the next two decades will need to be unprecedented. Permitting reform challenges lawmakers and regulators to assess the usefulness of extant permits and their processes to minimize or remove barriers to building clean energy infrastructure. This set of facts shows that the recent intense focus on federal environmental permitting reform is necessary but not sufficient. Instead, the energy for permitting reform should be focused on developing thoughtful local ordinances and zoning, expediting the grid interconnection process, and reducing community opposition.
-
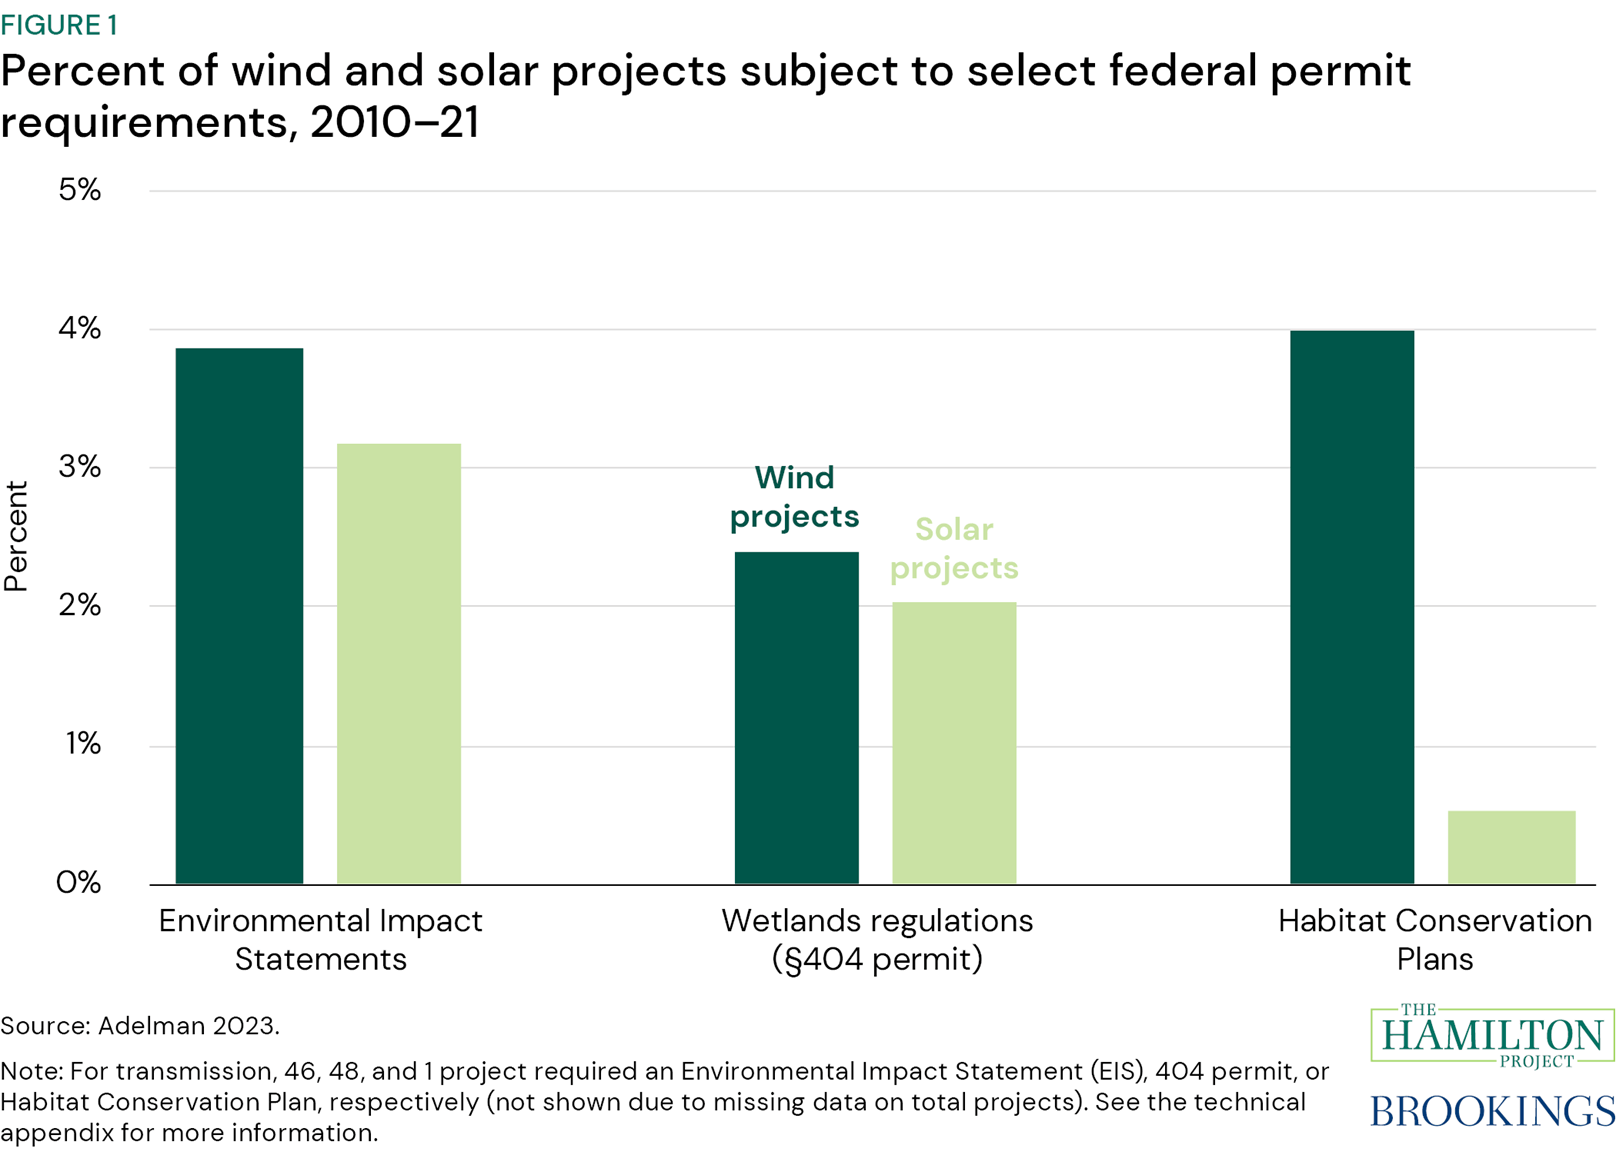
Fact 1. Few wind and solar projects required significant federal permits between 2010 and 2021.
Figure 1 shows that wind and solar generators seldom require one of three laborious federal permits: an Environmental Impact Statement (EIS), a 404 permit, or a Habitat Conservation Plan. Between 2010 and 2021, fewer than 5 percent of the 1,883 total wind and solar projects required one of those permits (Adelman 2023).
A project necessitates an EIS when “major federal actions significantly [affect] the quality of the human environment” (Adelman 2023, 8). In contrast, a project receives a categorical exclusion when the federal actions are determined to have no significant environmental impacts. From 2004 to 2020, National Environmental Policy Act decisions consisted of 81.2 percent categorical exclusions, 16.7 percent Environmental Assessments (abbreviated EISs) and 2.1 percent EISs (Ruple et al. 2022). Roughly 4 percent of wind generators and 3 percent of solar generators built between 2010 and 2021 required an EIS.
Under the Clean Water Act, federal projects must mitigate their harm to wetlands (Environmental Protection Agency [EPA] 2023). To that end, the U.S. Army Corp of Engineers issues 404 permits to projects that are determined to prevent a net loss of wetlands. Requiring such a permit is rare: Only about 2 percent of wind and solar projects required a 404 permit between 2010 and 2021.
Finally, Section 7 of the Endangered Species Act requires projects to consult with the U.S. Fish and Wildlife Service and the National Marine Fisheries Service if endangered or threatened species are at risk (Adelman 2023). If an evaluation confirms such a risk, these services can issue incidental take permits under Section 10 that allows the “limited and unintentional take” of protected species with the condition that an accompanying Habitat Conservation Plan ensures effects are minimized (U.S. Fish and Wildlife Service [FWS] n.d.a; FWS n.d.b). Approximately 4 percent of wind projects received a Habitat Conservation Plan between 2010 and 2021, compared to less than 1 percent of solar projects.
This is not to say, however, federal permitting reform is not important for transmission infrastructure projects. Although this piece focuses primarily on wind and solar energy generation, a significant bottleneck to the clean energy transition is establishing large, complex transmission projects that span multiple states and regions. Existing transmission projects are not large enough to support a successful clean energy transition; so, the share of current transmission projects that require relevant federal permits would not reflect the share necessary to achieve climate infrastructure goals (Liscow 2024, p. 6). For more information on key transmission issues, please read Welton (2024).
-
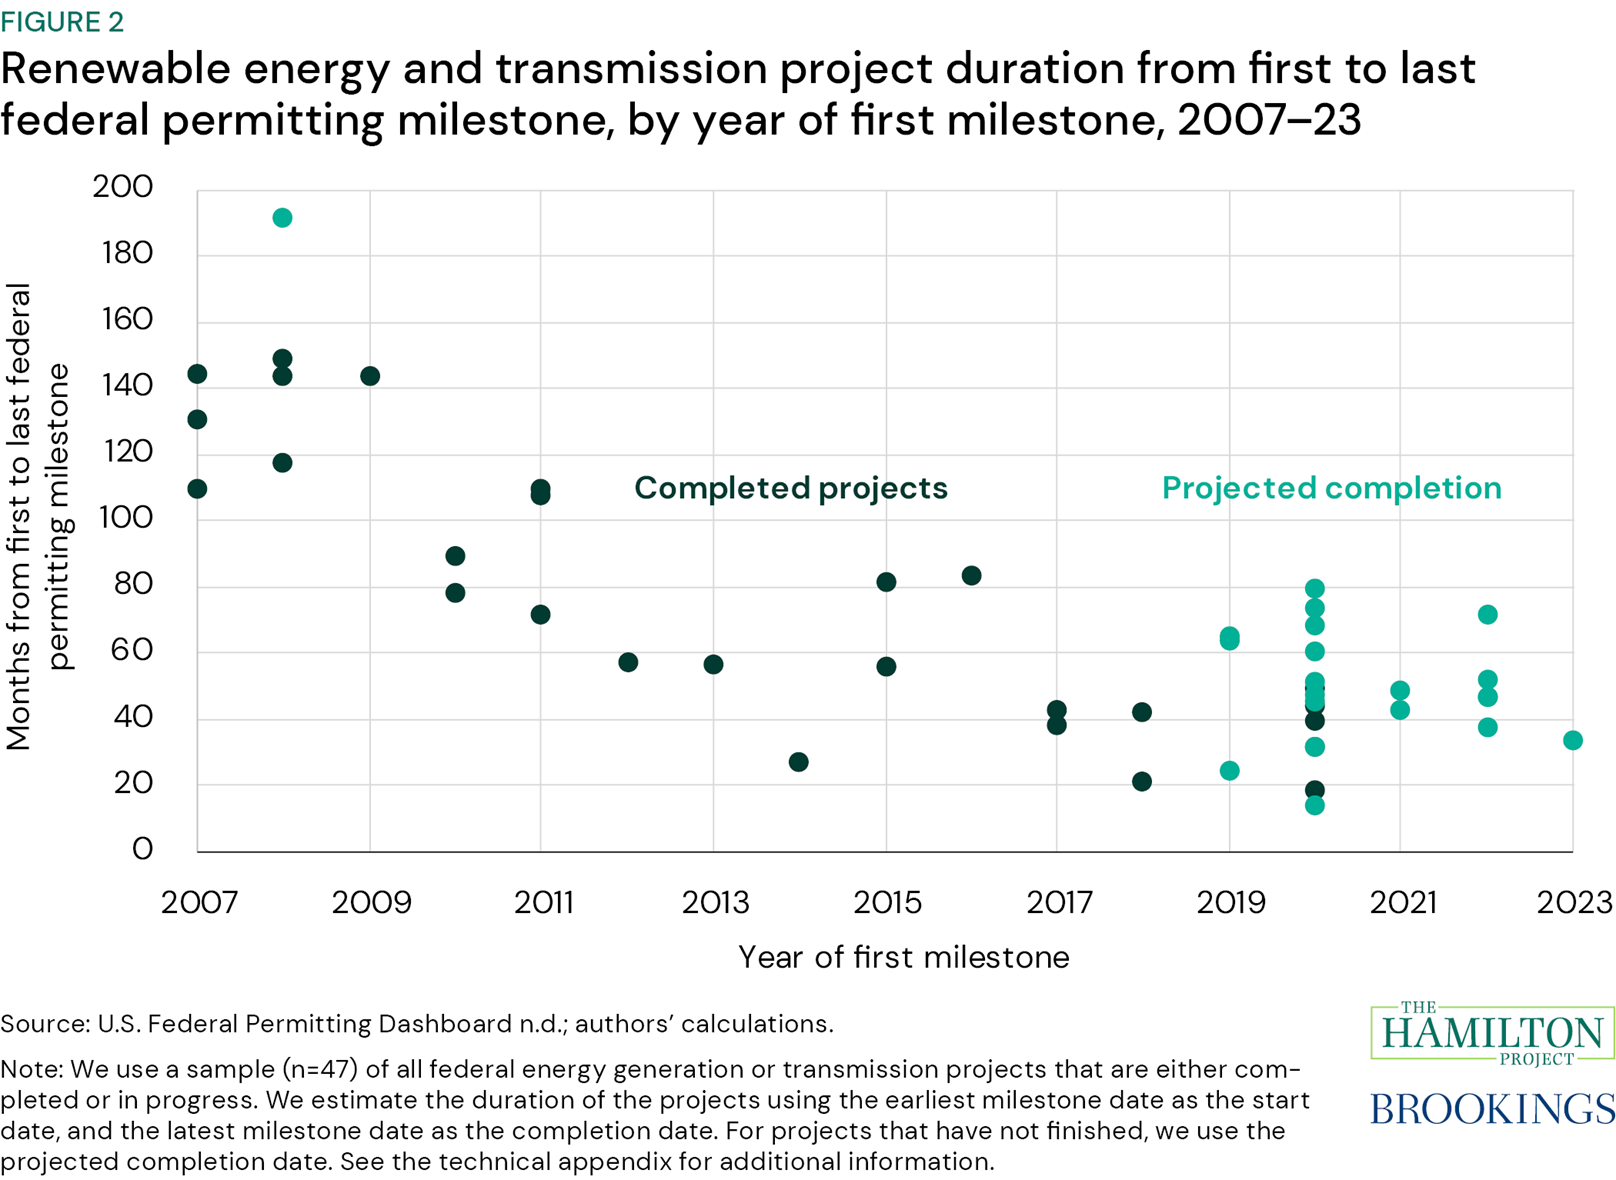
Fact 2. Federal permitting durations have decreased in the past 15 years.
In recent years, it has taken less time to complete the federal permitting process for the sample of projects in this analysis. Figure 2 shows the number of months it took for a sample of federal energy generation and transmission projects seeking federal permits to move from the first to the last reported milestone. The median duration from the first to the last permitting milestone was 109 months between 2007 and 2015, compared to 47 months between 2016 and 2023. This difference is more pronounced for completed projects, where the average duration for projects that started after 2015 was less than two and a half times that for projects that started in years prior.
Historically, many scholars suggest administrative bottlenecks contribute to long permitting timelines (Sud and Patnaik 2022). The possibility for acceleration is underlined by the fact that many projects are eligible for expedited processes, such as categorical exclusions (see fact 1). Indeed, categorical exclusions as a share of total projects have been increasing since 2011 (Ruple et al. 2022). In addition, the Biden administration recently created more categorical exclusions for certain transmission, solar, and wind projects (White House 2024). Agencies have also created programmatic policies to avoid EISs or formal Section 7 consultations that cover an action type for any project within a geographic area (Adelman 2023). Overall, since 2016, preparation times have decreased at an average rate of 44 days per year, and, in 2022, reached the fastest rate since 2011 (Nicholson et al. 2022).
-
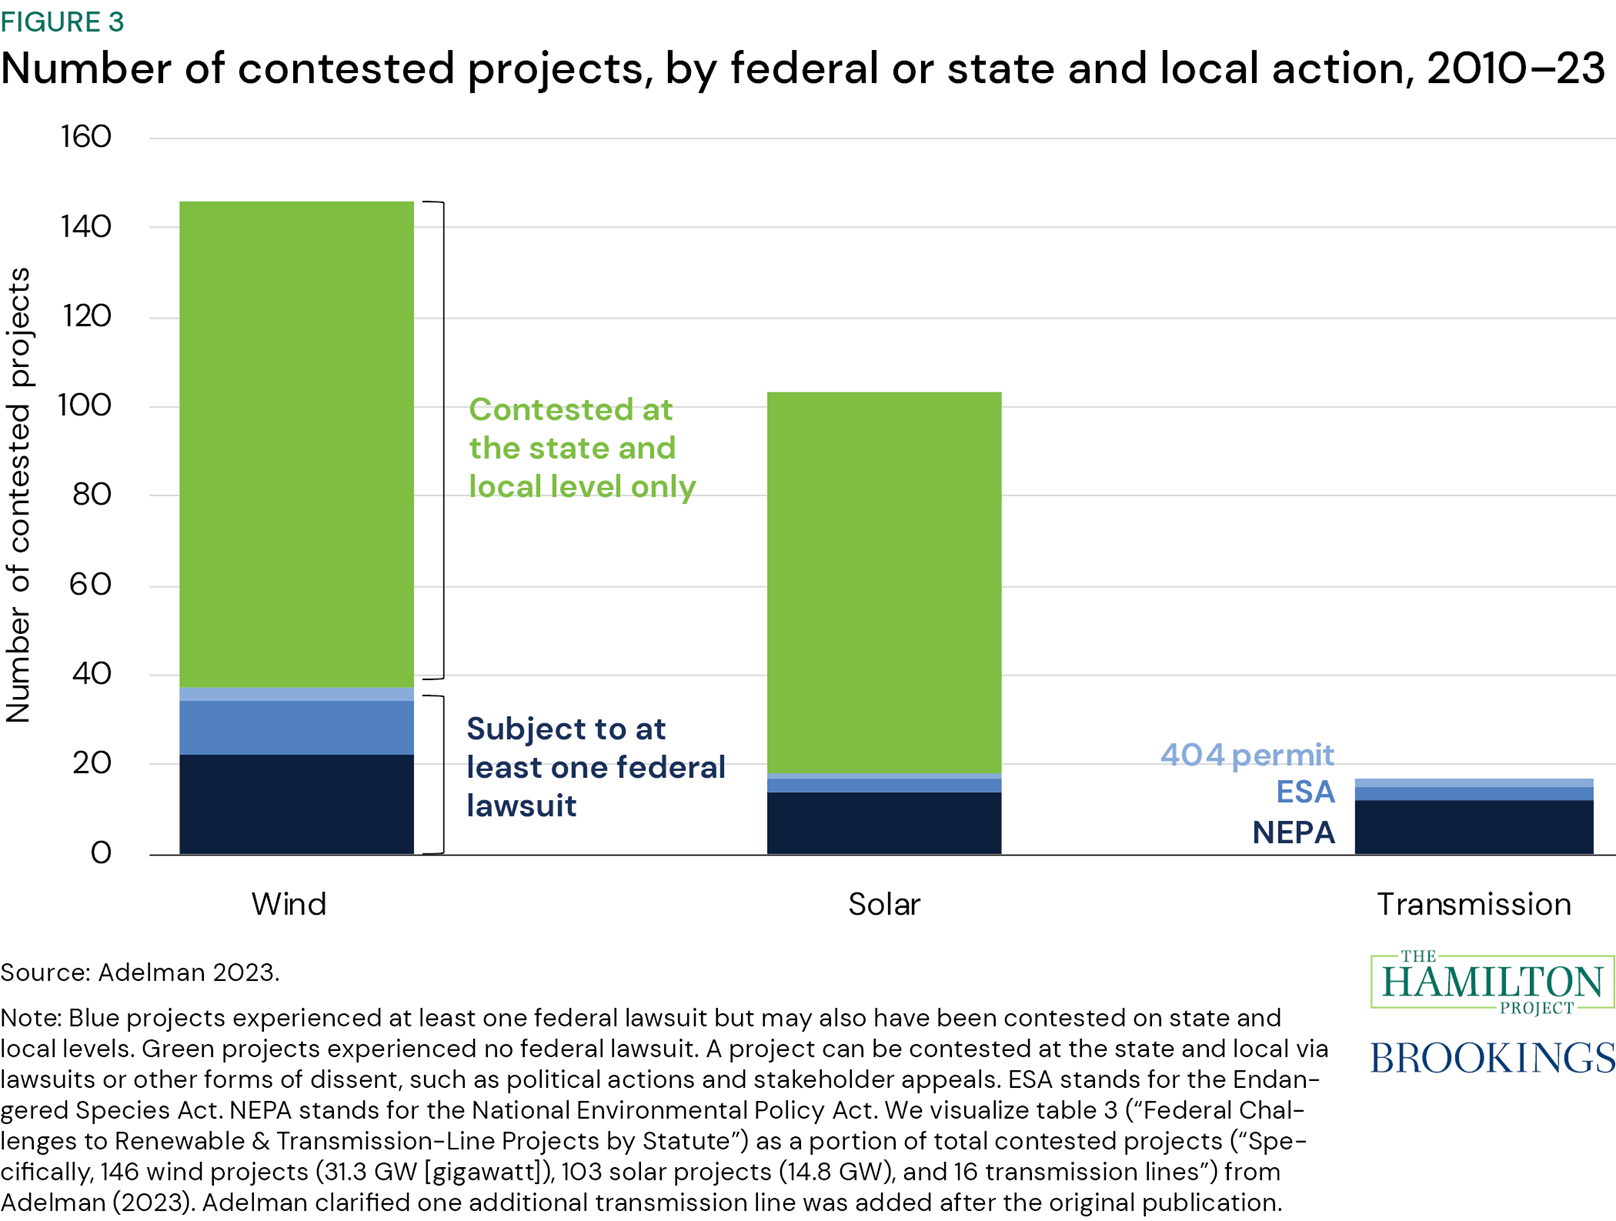
Fact 3. Most wind and solar projects are only contested at the state or local level.
Public opposition can lengthen the permitting process. Lawsuits, political actions, political protests, and stakeholder appeals are all avenues for contesting a project. And, these localized pressures are increasing (Adelman 2023). The Sabin Center for Climate Change Law at the Columbia Law School identified 293 contested projects as of May 2023, a 57 percent increase since their March 2022 report (Eisenson 2023). Figure 3 shows that, for wind and solar projects, opposition does not frequently occur on the federal level: Seventy-three percent of contested projects between 2010 and 2021 were contested only at the state or local level (Adelman 2023; authors’ calculations), while only 25 percent and 17 percent of contested wind and solar projects, respectively, were subject to federal litigation.
The avenues to challenge a project depend on the nature of the infrastructure. For example, 8 percent of contested wind projects were challenged under the Endangered Species Act, compared to only 1 percent of contested solar projects (12 projects compared to 3 projects, respectively). Wind projects are generally subject to the Act more frequently because wind turbines pose greater harm to protected species such as migratory birds (Adelman 2023), and are particularly controversial because of their size, noise, and shadow flicker, which can spur greater organized opposition (Aidun et al. 2022).
Although there are fewer reported contested transmission projects than contested wind or solar projects, large, complex transmission projects can cross multiple state lines and thus involve federal lawsuits along with needing approval from multiple state and local jurisdictions (Gross 2020; Manitius, Cavert, and Kelly 2024; U.S. Energy Information Administration [EIA] 2023a). Transmission projects that trigger an EIS (the most formal NEPA permit), and are therefore vulnerable to EIS lawsuits, take seven times longer to complete than typical transmission projects; 64 percent of those transmission projects are in the California Independent System Operator (CAISO) or West (non-ISO) region (Manitius, Cavert, and Kelly 2024). The West hosts a large portion of federal land (Bui and Sanger-Katz 2016), so siting there poses a greater risk of triggering federal action such as a formal NEPA evaluation (National Governors Association 2023).
-
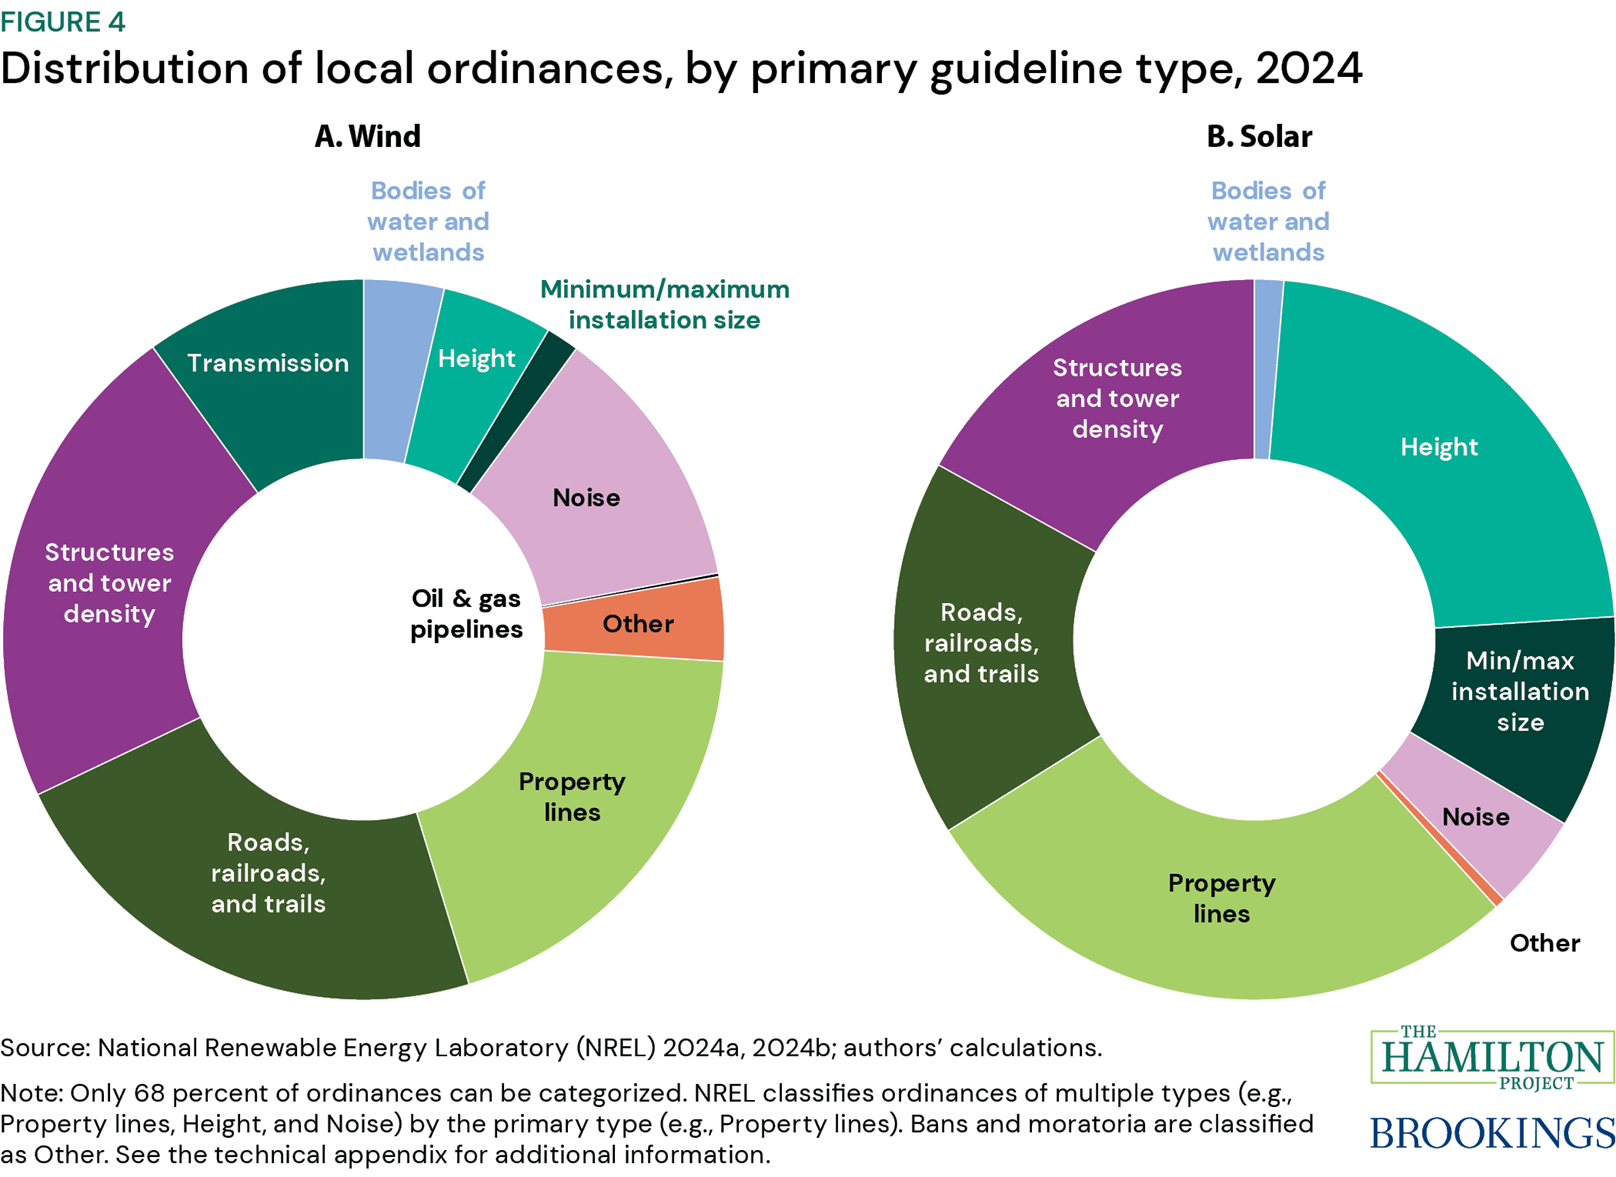
Fact 4. Local ordinances constrain where and how clean energy projects are developed.
Local ordinances and zoning requirements are one of the leading causes of renewable project cancellation (Nilson, Hoen, and Rand 2023). Figure 4 shows the distribution of local ordinance and zoning requirement types for wind and solar, classified by the National Renewable Energy Laboratory (NREL). While this figure visualizes the distribution among wind and solar, there are twice as many ordinances governing wind energy as solar energy (NREL 2024a, 2024b).
The most frequent class of wind ordinances are setback requirements, which delineate mandatory distances from other objects where wind turbines cannot be installed (NREL 2024b). In figure 4, panel a, setback requirements include structures and tower density; property lines; roads, railroads, and trails; transmission lines; and bodies of water and wetlands (Geocaris 2022). Other wind-related restrictions include height; rotor size limitations; noise; and shadow flicker rules, which mitigate shadow flicker on roadways or other structures. Compared to wind turbines, solar panels are more likely to be subject to minimum and maximum lot size restrictions, since utility-scale solar farms can cover up to hundreds of acres (Daniels and Wagner 2022).
Some local jurisdictions include multiple restrictions in figure 4 or other requirements not shown. As an example of other kinds of restrictions, in Dunn County, North Dakota, in addition to digital site plans, developers are required to submit two physical copies on “high quality paper on sheets thirty (30) inches by thirty-six (36) inches, provided that when more than one sheet is required, there shall also be submitted an index sheet on high quality paper and of the same dimensions, showing the entire wind energy facility project on one sheet” (Dunn County Land Development Code 2022, 50). In Hamilton County, Indiana, developers must establish a 24-hour toll-free phone number, post signs at every road intersection in the project area, and remedy all legitimate public complaints within two days (Hamilton County Plan Commission 2022, p. 66).
-
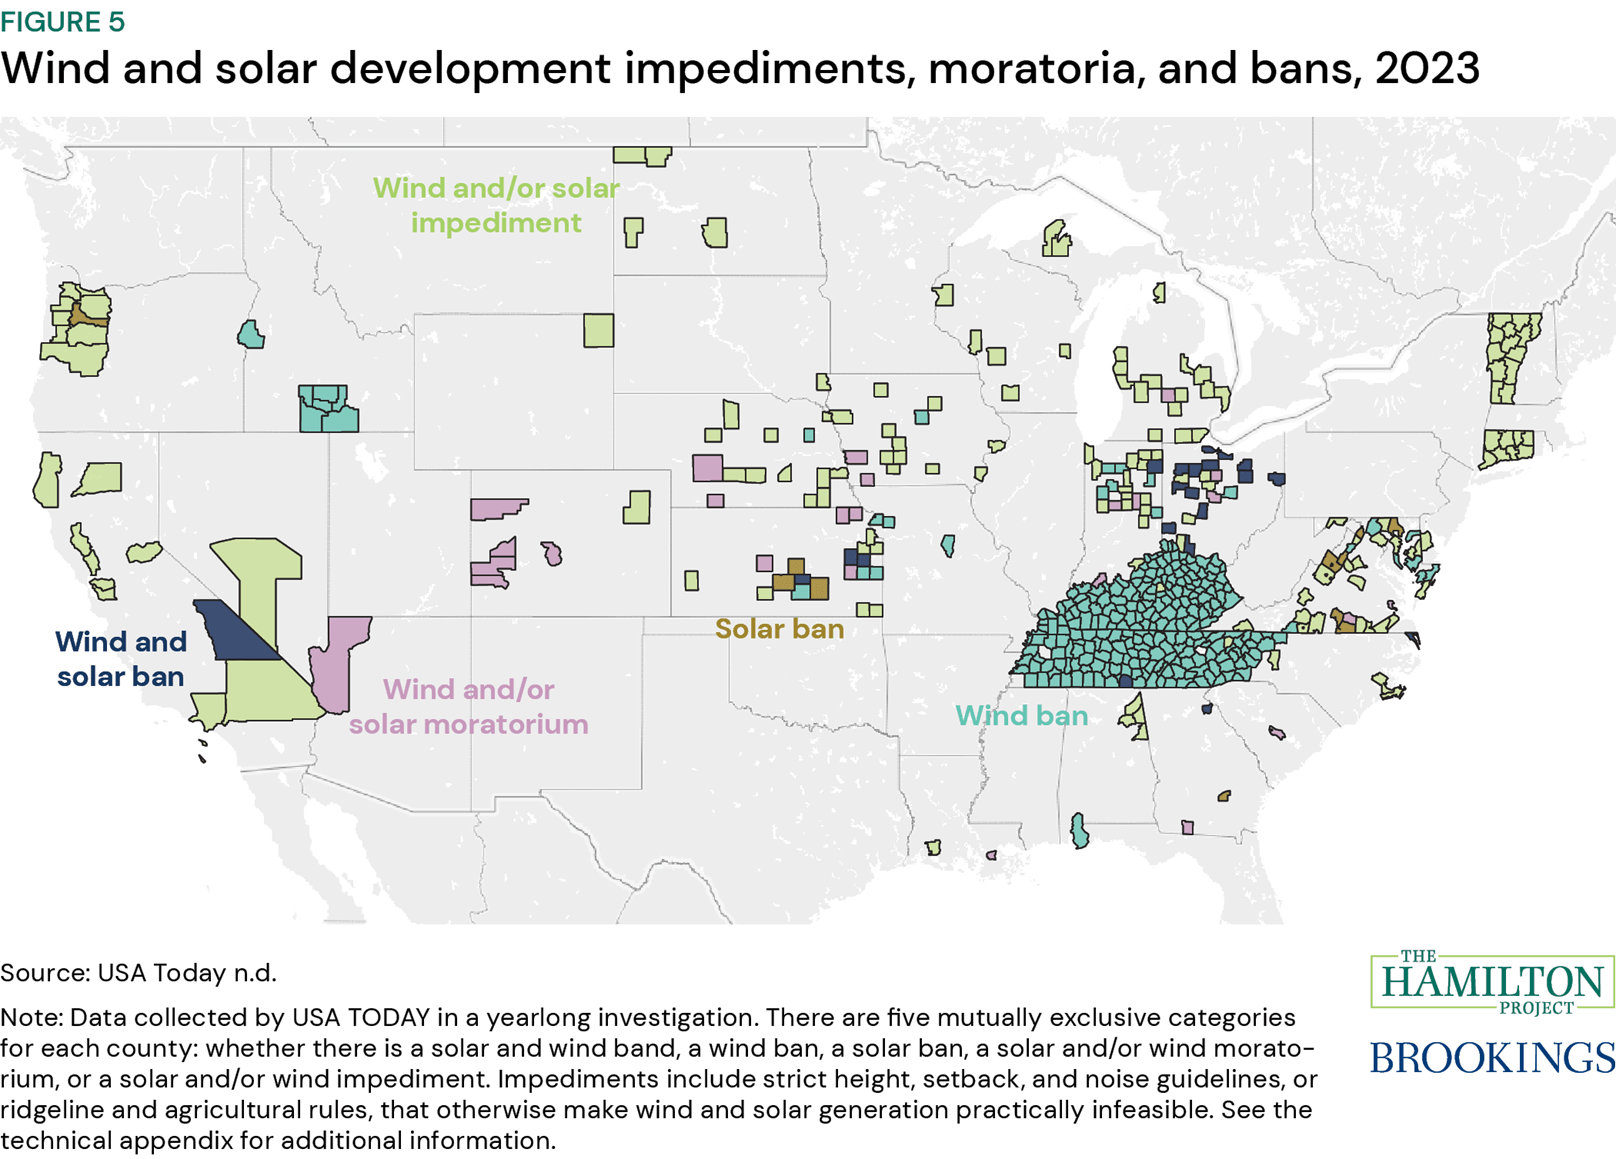
Fact 5. More than 300 counties have banned or instituted moratoria on wind or solar projects.
State and local authorities can implement ordinances and zoning rules that explicitly or effectively ban the construction of new clean energy projects; figure 5 shows a map of counties that USA Today found were doing so. They identified 32 bans against solar and 292 bans against wind, for a total of 324 total bans in 303 counties, 21 counties of which have banned both energy types. In addition, counties have instituted 26 and 17 solar and wind moratoria, respectively.
Some counties might not pass bans, but their ordinances may nevertheless restrict height, noise, or siting such that development is infeasible. For example, a sound restriction of 30 decibels is quieter than the wind itself (Weise and Bhat 2024). In Tennessee, no developer can build a wind energy facility with a capacity greater than one megawatt without permission from the state commission and local government (Kahn and Shields 2020); authorities blocked wind development in all but four of its counties in 2018 (Weise et al. 2024). There are 58 solar impediment ordinances and 102 wind impediment ordinances in 150 counties. There are 58 solar impediment ordinances and 102 wind impediment ordinances in 150 counties. Altogether, 527 ordinances effectively prohibit solar and wind development, with new regulations added each year.
Sometimes visual and noise complaints from neighboring residents drive community opposition (Aidun et al. 2022). In 2017, Vermont required developers to set back wind turbines at least 10 times their height from the nearest residence (Weise and Bhat 2024). This pattern is consistent with Adelman (2023), who finds that litigation pressures against offshore wind has occurred in northeastern rural communities where residents place a high premium on protecting local landscape. Other times, the renewable energy transition threatens existing local economies. In Kentucky, coal is the most powerful political incumbent, in part because mining supports thousands of workers and their families each year (EIA 2022; Higdon 2014). The Inflation Reduction Act (IRA) invested billions of dollars to spur a more just green energy transition for coal-dependent communities (U.S. Department of the Treasury [Treasury] 2023; Solomon 2022).
-
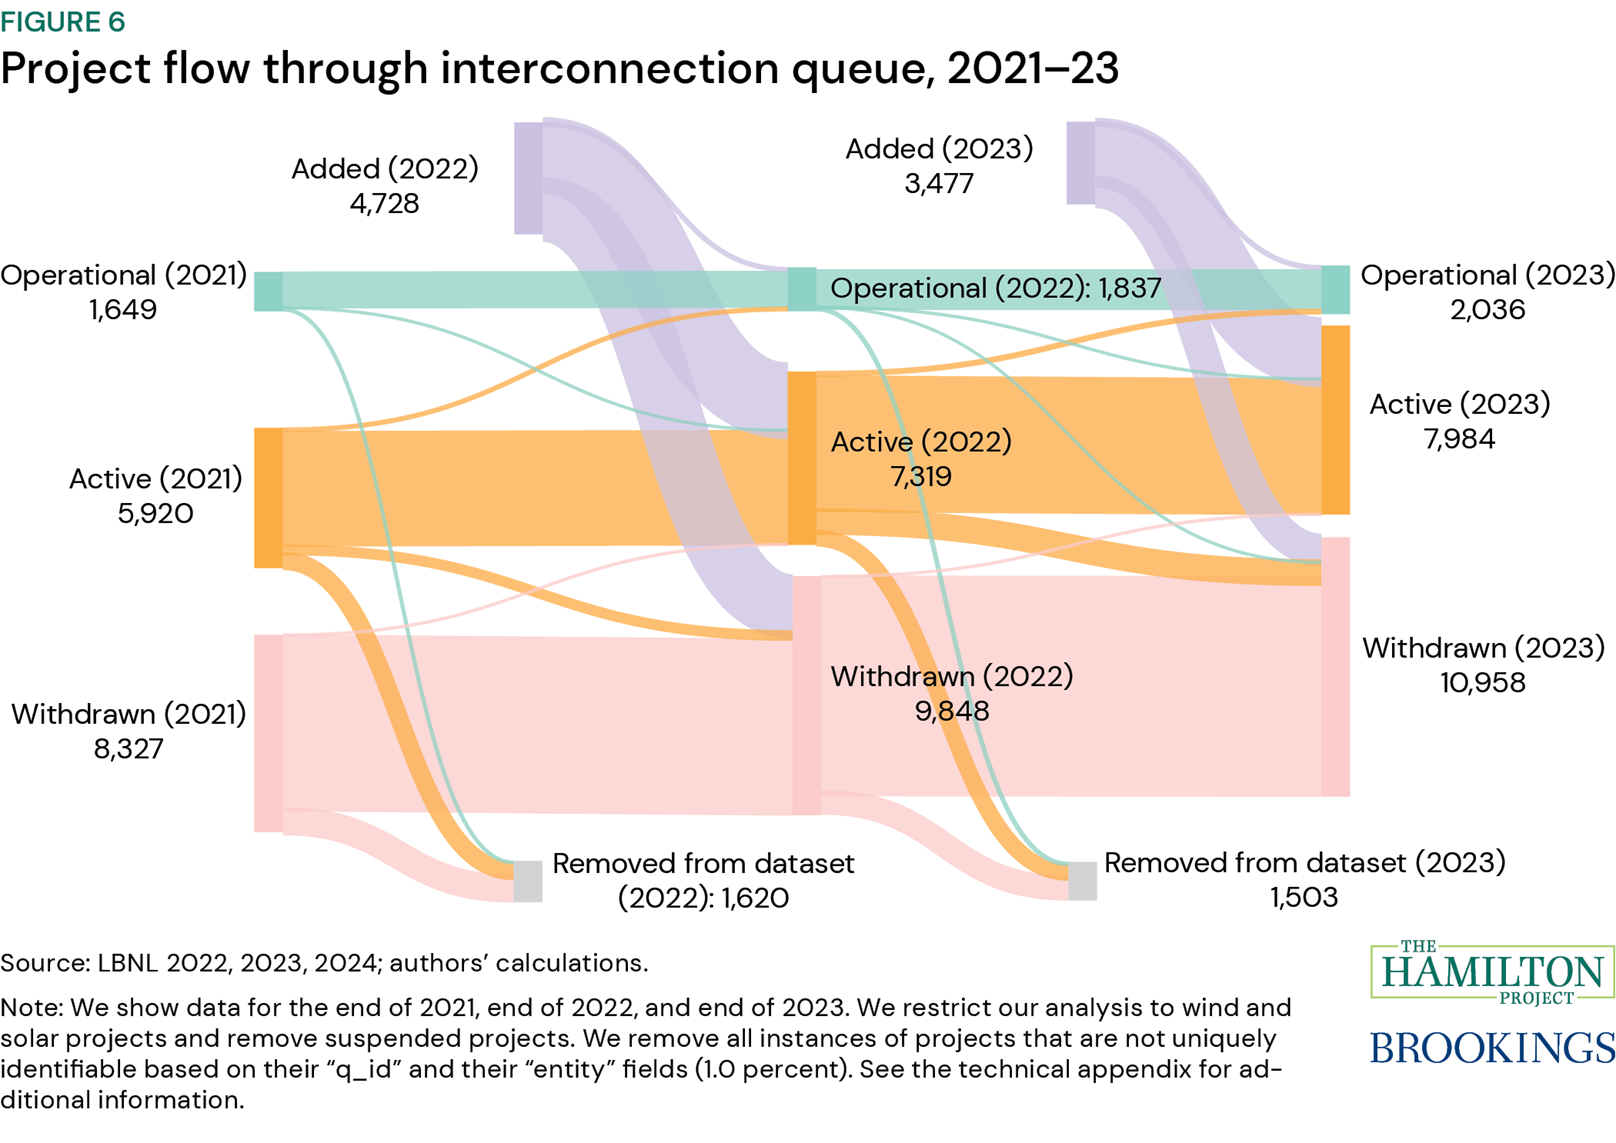
Fact 6. More than one thousand projects are withdrawn from the interconnection queue every year.
Grid interconnection is the process by which proposed projects undergo impact studies and adopt needed modifications before connecting to the regional grid. The process, governed by Regional Transmission Organizations (RTOs), Independent System Operators (ISOs), or independent utilities, is inherently complex. First, developers must submit an interconnection request to enter the queue. Next, proposed projects must undergo a variety of tests including feasibility studies, system impact studies, and facilities studies before procuring an interconnection agreement. Finally, projects begin construction and must complete any requirements outside of interconnection to become commercially operational, such as securing supply chains and procuring permits (NREL n.d.). It is typical for projects to wait months or years to finish the full process, and a steady surge in interconnection requests over the past decade has created backlogs in some regions and made interconnection even more difficult (Rand et al. 2024).
Figure 6 shows the movement of projects through the interconnection queue. There was a large surge in interconnection activity in 2022, with more than 4,700 new interconnection requests. Between 2021 and 2023, roughly 11 percent of projects seeking interconnection became newly withdrawn each year on average. Indeed, most interconnection requests are ultimately withdrawn. Rand et al. (2024) find that more than 70 percent of interconnection requests are withdrawn, and just 19 percent of requests submitted between 2000 and 2018 had been built as of the end of 2023.
Relatedly, costs of interconnection have also increased as RTOs and ISOs grappled with a significant increase in the number of projects entering the queue (U.S. Office of Energy Efficiency and Renewable Energy [EERE] 2023). PJM (the RTO for Maryland, Virginia, and New Jersey) reports their average costs for completed projects doubled between 2017-19 and 2020-22. MISO (the RTO for Minnesota, Illinois, Wisconsin, and Michigan) saw a similar cost increase for projects completed between 2019-21, compared to projects completed prior to 2019 (U.S. EERE 2023).
-
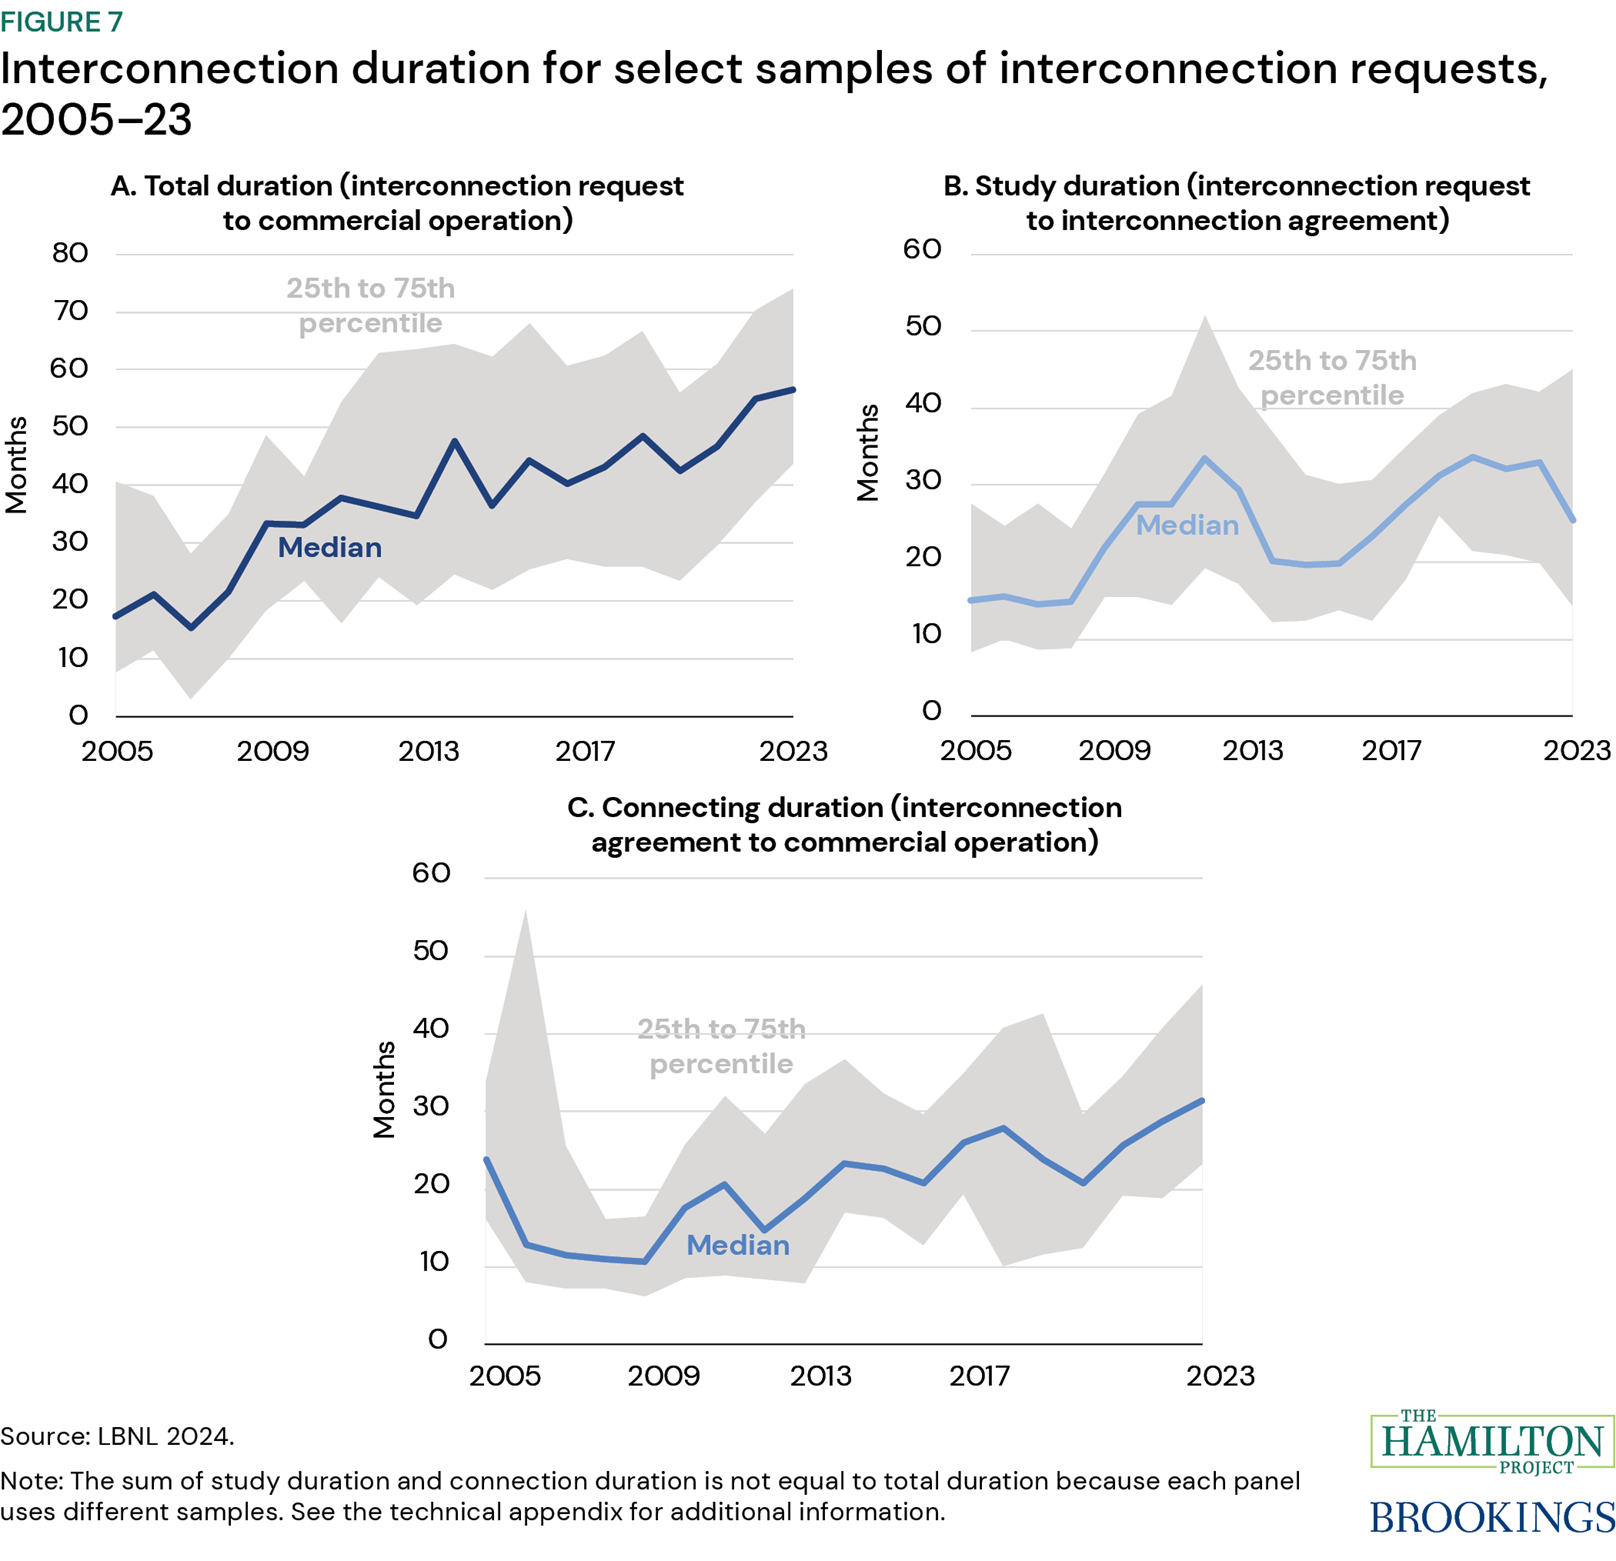
Fact 7. Interconnection has been getting slower over the past 20 years.
Typically, interconnection happens in concert with permitting. As a result, permitting-related challenges have increased the amount of time projects spend in the interconnection queue (Silverman et al. 2023; NREL n.d.). Panel a of figure 7 shows that, in the early 2000s, 75 percent of interconnection requests resulted in commercial operation in under three years; in 2023, fewer than 25 percent of requests resulted in operation in under four years, and roughly 25 percent took at least six years. Finishing within a year now is exceedingly rare.
The slowdown of interconnection might be related to study duration and, to a greater extent, connection duration. Study duration lasts from interconnection request to interconnection agreement—i.e., feasibility studies, system impact studies, and facilities studies. Interconnection requests have surged since 2013, and some operators are overwhelmed, with some regions delaying accepting any new requests due to backlogs (Rand et al. 2024).
The primary driver of interconnection slowdown is more likely connection duration—the time between securing an interconnection agreement and reaching commercial operation. During this period, developers source supply chains and finish any federal and local permitting steps. Panel c shows that connection duration has increased since 2009, from a median of roughly one year to almost two-and-a-half years.
-
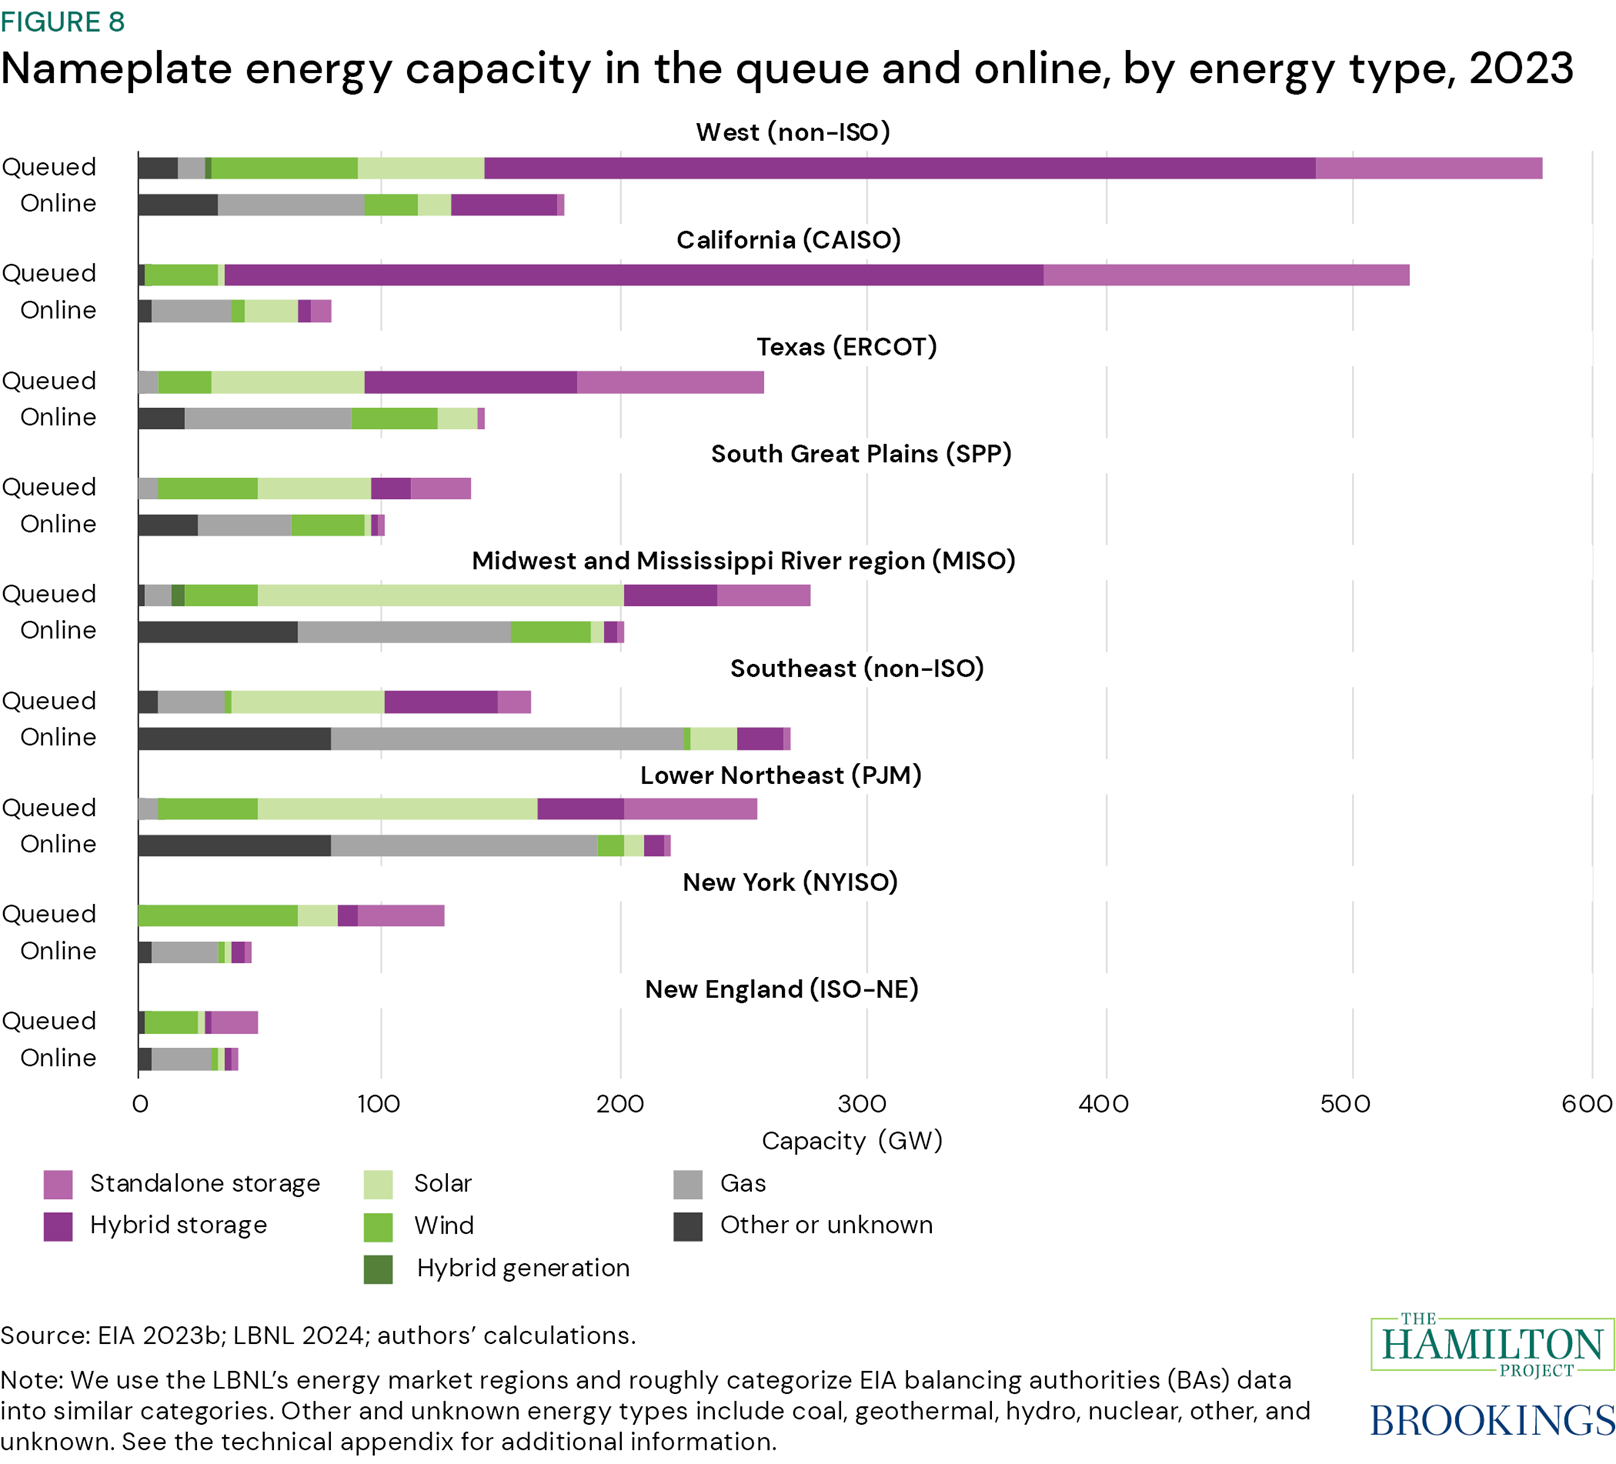
Fact 8. There is more energy storage and generation capacity in the queue than operating online.
In eight of nine U.S. regions, there is more energy generation and storage capacity seeking interconnection than there is online (figure 8). This is most pronounced in California and the West, where there are 6.5 times (California) and 3.3 times (West) as much capacity in the queue as online; and in New York, where there are about 2.8 times as much. And these imbalances are growing with recent surges in interconnection requests. For example, from 2022 to 2023 the ratio of queued to online capacity in California increased from three to seven (LBNL 2023-24; EIA 2024). In five regions, most capacity in the queue is from solar or wind generation. In addition, in all regions, there is more capacity for solar and wind generation in the queue than there is online.
Most capacity seeking interconnection in California, other states in the West, and in Texas are standalone and hybrid storage. Building more storage is essential to the clean electricity transition (Davis, Hausman, and Rose 2023), as wind and solar plants generate daily and seasonal supply and demand mismatches which storage can offset (Paras et al. 2023). Rand et al. (2024) document that batteries make up roughly 99 percent of storage capacity in the queues, and that more than half of all storage capacity in the queues is proposed in hybrid configurations with generation. There is a shortage of storage in part due to low completion rates: From 2000 to 2018 the average completion rate for battery projects was 11 percent, compared with 31 percent for gas (Rand et al. 2024).
-
Selected Hamilton Project papers on climate and permitting reform
The Hamilton Project has released several evidence-based policy proposals to help accelerate crucial climate reform in the United States, and several economics facts documents to anchor policy debates.
Policy proposals
Climate tax policy reform options in 2025
John Bistline, Kimberly A. Clausing, Neil Mehrotra, James H. Stock, and Catherine Wolfram | February 2024
With the expiration of many tax cuts and unmet climate targets, 2025 could be a crucial year for climate policy in the United States. The authors use an integrated model of energy supply and demand to assess climate policies that the U.S. federal government may consider in 2025, and to evaluate emissions reductions, abatement costs, fiscal impacts, and household energy expenditures across a range of policy scenarios. The authors consider seven scenarios in their proposal that are (1) policies that could plausibly be under consideration in 2025, although consideration of each is more or less likely depending on outcomes of the 2024 elections and on future economic conditions; and (2) tax and expenditure policies with potentially major fiscal and/or emissions impacts.
The authors describe several important findings. First, the emissions reductions of the IRA are significantly augmented under scenarios that add a modest carbon fee or, to a lesser extent, that implement a clean electricity standard in the power sector. Second, net fiscal costs can be substantially reduced in scenarios that include a carbon fee. Third, expanding the IRA tax credits yields modest additional emissions reductions with higher fiscal costs. Finally, although none of the policy combinations across these scenarios achieves the U.S. target of a 50–52 percent economywide emissions reduction by 2030 from 2005 levels, the carbon fee and clean electricity standard scenarios achieve these levels between 2030 and 2035.
Principles for public investment in climate-responsible energy innovation
Catherine Hausman | April 2023
Catherine Hausman lays out a rationale for substantially increasing federal spending on clean energy research and development (R&D), along with guiding principles for how the money should be deployed. She proposes four foundational pillars for energy innovation policy to leverage effective investment: (1) Spend triple the federal support for energy R&D. (2) Prioritize clean energy, with a secondary focus on energy security. (3) Allow for risk-taking in project selection, and expect (and learn from) some project failures. And, (4) Draw on the expertise of the US Department of Energy, the Advanced Research Projects Agency–Energy, and the national laboratories.
New policymaking should incorporate these principles. In addition, benefits are maximized when these principles are paired with complementary climate policies, such as carbon pricing or emissions regulation or abatement subsidies. Complementing investment with implementation support is clearest for those policies that (1) aid with deployment and adoption of new energy technologies, (2) correct environmental externalities, and (3) support communities who might otherwise be harmed by the transition to new energies. Hausman argues that the approach outlined in her proposal would jump-start innovation, correct market failures, enhance energy security, and enable a more cost-effective transition to a climate-responsible economy.
Market-based clean performance standards as building blocks for carbon pricing
Carolyn Fischer | October 2019
Because industrial sectors contribute a large fraction of total greenhouse gas emissions in the United States, addressing their emissions is an essential element of combating climate change. However, emissions reduction is costly for industrial firms with energy-intensive production processes; requiring significant investment in low-carbon manufacturing technologies can disadvantage domestic firms relative to their unregulated, international competitors.
Fischer proposes using market-based tradable performance standards to reduce industrial carbon emissions. The proposal would set carbon emissions benchmarks tailored to energy-intensive industrial production processes against which a firm’s emissions would be evaluated. Firms with emissions in excess of their benchmark would be required to pay; firms that reduce emissions below their benchmark would receive tradable credits, which can be sold to other firms facing higher abatement costs.
Promoting innovation for low-carbon technologies
David Popp | October 2019
Despite progress made over the past decade, further innovation is necessary to achieve deep decarbonization of the U.S. economy. Meeting climate policy goals currently under consideration will not be possible without further technological improvement. It will take several steps—from basic and applied research to demonstration and commercialization—to bring about technological change at the scale required to meet our goals for greenhouse gas reduction. Unfortunately, market failures affect all stages of clean energy technology development, meaning that market forces alone will not lead to optimal allocation of resources.
David Popp explains how to use various policy instruments that have different effects depending on the type of technology, the stage of development, and the sector of the economy. Since separate policy instruments address different market failures, supporting clean energy innovation requires a portfolio of policy tools that will (1) increase the potential market for innovation (the demand side), and (2) address market failures that hinder innovation (the supply side).
The next generation of transportation policy
Michael Greenstone, Cass Sunstein, and Sam Ori | March 2017
Fuel efficiency standards aim to reduce vehicle emissions, but current standards are incomplete in several respects. Current standards regulate new vehicle fuel efficiency rather than total emissions, so they cannot ensure continued progress in reducing emissions. Even among new vehicles, gains in fuel efficiency have stalled in recent years as consumers increase their purchases of sport utility vehicles (SUVs) and pickup trucks. Current policy also focuses on fuel consumption per mile traveled rather than lifetime vehicle emissions, and lack of a well-functioning market for emissions permits reduces potential benefits from credit trading among vehicle manufacturers.
The authors propose two major steps toward simplifying fuel efficiency standards and refocusing the program on achieving guaranteed emissions reductions at lower cost to automakers. These are (1) target greenhouse gas emissions directly, without differentiating by vehicle types and sizes, using data to project a given vehicle’s lifetime greenhouse gas emissions; and (2) establish a robust cap-and-trade market to reduce compliance costs for automakers while providing considerably more certainty about the future path of carbon dioxide (CO2) emissions.
Economic facts
Ten economic facts about electricity and the clean energy transition
The Hamilton Project and The Stanford Doerr School of Sustainability | April 2023
Federal resources have the potential to accelerate a broad energy transition, but that transition will be successful only if we grapple with technical challenges and infrastructure issues inherent to the current energy system. This set of facts elevates key energy system characteristics, especially within electricity production, that will be consequential to the clean energy transition in the near term and so will merit policymaker attention. Electricity production is not only the focus of recent legislation, but also where evolving technologies will deliver the most rapid change, and where—because of the system’s highly regulated nature—that change is likely to encounter the greatest limitations. During this rapid evolution, the electricity system must reliably meet the fundamental challenge that electricity generation must equal consumption at all times to keep the grid in balance.
The authors argue that an overarching reality and the great challenge of the next decade of US climate policymaking will be for lawmakers and regulators to remove existing barriers to clean energy infrastructure deployment. More money for investment and innovation is necessary but will not be enough. Fully realizing the promise of the clean energy transition for US economic growth, jobs, and prosperity will require developing solutions that remove the choke points created by the existing infrastructure and regulatory systems; it will also require deploying both new clean energy generation and the systems required to connect these new energy sources to electricity consumers.
Ten facts about the economics of climate change and climate policy
The Hamilton Project and The Stanford Institute for Economic Policy Research | October 2019
In this economics facts document, The Hamilton Project and The Stanford Institute for Economic Policy Research summarize what is known about climate change and its effects on the United States’ and the world’s economies. They also provide useful context for assessing the policy tools that exist to mitigate carbon emissions. Finding efficient and fair responses to climate change remains a core challenge for policymakers.
Twelve economic facts on energy and climate change
The Hamilton Project and Energy Policy Institute at the University of Chicago | March 2017
The United States has begun to make important progress on climate change, but large challenges remain. Given this technological and economic context, the United States has perhaps never been better positioned to tackle the urgent threat of climate change. In this economics facts document, The Hamilton Project and the Energy Policy Institute at the University of Chicago provide useful context for a discussion of the dangers to the economy posed by climate change and the policy tools for addressing and mitigating these dangers. Given the immense threat that climate change represents, it is crucial that policymakers implement efficient solutions that minimize climate damages from our use of energy.
-
Technical appendix
Figure A. Leading causes of cancellation for wind and solar projects, 2016–23
Methods: Reproduced from Nilson, Hoen, and Rand 2023, p. 11. https://live-etabiblio.pantheonsite.io/sites/default/files/w3s_developer_survey_report_-011824_version.pdf
Methods: See Adelman (2023) for additional details.
Figure 2. Renewable energy and transmission project duration from first to last federal permitting milestone, by year of first milestone, 2007–23
Methods: We use the U.S. Federal Permitting Dashboard (n.d.) as of May 1, 2024. According to the Federal Permitting Dashboard: “The Permitting Dashboard is an online tool for Federal agencies, project developers, and interested members of the public to track the Federal government’s environmental review and authorization processes for large or complex infrastructure projects, part of a government-wide effort to improve coordination, transparency, and accountability. A major function of this Dashboard is to track infrastructure projects designated as Covered Projects under Title 41 of the Fixing America’s Surface Transportation Act (FAST-41). The Dashboard also provides information on certain projects subject to Titles I, IX, and XI of the FAST Act (DOT projects), as well as other infrastructure projects.”
Each observation in the dashboard reports a milestone, or an action taken by the project applicant or government agency, for a federal project (n=16,493). We restrict our sample to projects in the renewable energy production or electricity transmission sector (n=1,869). We analyze only completed or in-progress projects and do not consider projects that are planned, paused, or cancelled (n=1,686). To measure a project’s duration, we count the number of days between the earliest and latest reported actual milestone completion dates and divide the sum by 30.14, the average number of days in a month. If the project is in progress and the milestone has not been completed, we use the target completion dates. There are 19 observations where projects are completed but we report only their target completion date. We impute these dates as the actual completion dates. Examples of projects’ earliest reported milestones include “Initial application submitted (Applicant Action),” “Issuance of Notice of Intent to prepare an Environmental Impact Statement (EIS) (Agency Action),” or “Determination to prepare an Environmental Assessment (EA).” Examples of projects’ latest reported milestones include “Issuance of Lead Agency Record of Decision (Agency Action),” “Section 106 consultation concluded (Agency Action),” or “Final Verification/Permit Decision Rendered (Agency Action).” Finally, our fact plots only one observation per project (n=47).
Figure 3. Number of contested projects, by federal or state and local action, 2010–23
Methods: A project can be contested at the state and local via lawsuits or other forms of dissent, such as political actions, political protests, and stakeholder appeals. ESA stands for the Environmental Species Act. NEPA stands for the National Environmental Policy Act. We visualize Table 3 (“Federal Challenges to Renewable & Transmission-Line Projects by Statute”) as a portion of total contested projects (“Specifically, 146 wind projects (31.3 GW), 103 solar projects (14.8 GW), and 16 transmission lines”) from Adelman (2023). Adelman clarified one additional transmission line was added after the original publication. See Adelman (2023) for additional details.
Figure 4. Distribution of local ordinances, by primary guideline type, 2024
Methods: For fact 4, we append the U.S. Wind Siting Regulation and Zoning Ordinances (NREL 2024b) and the U.S. Solar Siting Regulation and Zoning Ordinances (NREL 2024a) database from the NREL (n=3,931). Approximately 32 percent of the observations do not report a citation, so we cannot categorize these observations. Therefore, our analytical sample includes 2,672 citations. We roughly categorize the feature type of each citation into 10 categories: bodies of water and wetlands; height, roads, railroads, and trails; minimum or maximum lot size restrictions or installation size/coverage restrictions; noise; oil and gas pipelines; property lines; structures and tower density; transmission; and other. Other includes shadow flicker, ridgeline, bans, or moratoriums. Some ordinances have multiple types (e.g., property lines and noise) but we report the primary type, as provided in the “Feature Type” field. We visualize the count of citations by feature type for wind (panel a) and solar (panel b) separately.
Figure 5. Wind and solar development impediments, moratoria, and bans, 2023
Methods: We use data from a USA Today (n.d.) yearlong investigation (https://github.com/USATODAY/data-solar-wind-opposition/blob/main/README.md). We append the wind impediment data set with the solar impediment data set and create five ranked mutually exclusive categories for each county: whether there is a solar and wind band, a wind band, a solar band, a solar and/or wind moratorium, or a solar and/or wind impediment. USA Today’s analysis of rules considers a height limit of 500 feet, a setback requirement greater than 1,000 feet, and sound limits below 50 decibels to be significant impediments. Other impediments, which USA Today categorizes as “difficult to permit (DTP)” include ridgeline and agricultural rules. Some counties prohibit developers from building wind turbines over a certain height on mountain ridges—a height that would be necessary to catch the wind. Other counties restrict an amount or percentage of farmland from being used for solar power.
Figure 6. Project flow through interconnection queue, 2021–23
Methods: We use the Berkeley Energy Lab’s interconnection queue data, which provides snapshots for December 2021, December 2022, and December 2023 (LBNL 2022, 2023, 2024). We create a unique request identifier based on the fields “entity” and “q_id.” We remove all instances of projects that are not uniquely identifiable (1.0 percent) to arrive at our analytic sample (“sample”). We restrict our analysis to wind and solar projects (66.9 percent of 2021 sample; 67.4 percent of 2022 sample; 65.7 percent of 2023 sample), defined as all requests with the resource type (standardized) containing the words “Wind” or “Solar” (including requests with multiple energy types, e.g., “Solar+Storage,” “Wind+Gas”). We remove suspended projects from this analysis, because its definition is not consistent among RTOs (0.9 percent of 2021 sample; 1.3 percent of 2022 sample; 1.0 percent of 2023 sample). A project is “removed from the dataset” when the regional entity responsible for queue data collection reported the project in a given year, and but did not report the project in subsequent years.
Figure 7. Interconnection duration for select samples of interconnection requests, 2005–23
Methods: We thank Joseph Rand for providing the underlying data for this figure. For more information, please read Rand et al. 2024. An interconnection queue has three main stages: (1) an interconnection request, (2) an interconnection agreement, and (3) commercial operation. In figure 7a, we show total queue duration over time, defined as the time from an interconnection request to commercial operation. Rand et al. (2024, p 41) notes, “In-service date was only available for 6 ISOs (CAISO, ERCOT, ISO-NE, NYISO, PJM, SPP) and 8 non-ISO BAs (Duke, FPL, LADWP, PSCo, SOCO, SEC, SRP, TSGT) representing 61% of all operational projects. Duration is calculated as the number of months from the queue entry date to the commercial operations date.” Figure 7b is the study duration, defined as the time from an interconnection request to an interconnection agreement in months. Rand et al. (2024; p. 34) explains: “The majority of the 2023 data sample for this analysis came from ERCOT (39%) and the West (23%), which typically have relatively shorter durations . . . ; there were no 2023 IAs [interconnection agreements] in PJM. Sample includes 3,864 projects from 7 ISO/RTOs and 5 non-ISO balancing areas with executed interconnection agreements since 2005.” Finally, figure 7c is the connecting duration, or the duration from an interconnection agreement to commercial operation. Rand et al. (2024, p. 39) notes, “Data were only available for 861 projects across 5 ISO/RTOs and one utility (Southern Company), out of 4,155 total ‘operational’ projects in the full dataset.”
Figure 8. Nameplate energy capacity in the queue and online, by energy type, 2023
Methods: To measure energy capacity in the queue, we use the Queued up: Complete cleaned interconnection queue data through 2023 database (LBNL 2024) from the Berkeley Energy Lab (n=33,256). We restrict the sample to active projects and drop two true duplicates from our sample (n=11,592). We organize energy types into seven categories: (1) hybrid storage, (2) standalone storage, (3) hybrid generation, (4) solar, (5) wind, (6) gas, and (7) other or unknown. Hybrid storage includes any observation with battery and a secondary or tertiary energy source. Standalone storage includes observations that report only battery or “other storage” as their energy source. Hybrid generation includes any observation with multiple reported energy sources that do not include battery, and observations that report “hybrid (unknown)” or “hybrid” as their source. Wind includes both offshore wind and traditional wind sources. Other or unknown includes coal, geothermal, hydropower, nuclear, other, and unknown. In these data, regions are defined as electric power markets. See U.S. Federal Energy Regulatory Commission (FERC; n.d.) for more information on these regions. To measure capacity, we add any reported capacity from the primary, secondary, or tertiary capacity report variables and convert the units from megawatts to gigawatts.
To calculate current nameplate operating capacity, we use the Preliminary Monthly Electric Generator Inventory (based on Form EIA-860M as a supplement to Form EIA-860) from the EIA in December 2023 (n = 25,889; EIA 2023b). We consider only sources with operating capacity, defined as standby/backup status or operating status (OP; n = 25,236). This dataset reports on the balancing authority (BA) region, rather than the electric power market region. These regions are responsible for balancing electricity supply, demand, and interchange. RTO/ISO regions operate as BAs but there are numerous other BAs in the United States (see EIA [n.d.] and U.S. Department of Energy [DOE; n.d.] for more details). We merge EIA-930 BA regions and accompanying states with the inventory data set. We only analyze observations within the contiguous U.S. (n = 24,478). We then categorize each BA into the nine electric power regions using the reported BA region name. If the BA is not an RTO, we roughly categorize the plants into West (non-ISO) or Southeast (non-ISO) regions. There were seven plants not in the West or the Southeast and not reported as an RTO/ISO BA, so we roughly categorize them into their nearest region. We categorize the energy source codes into the same energy types as the queue data. We take the reported nameplate capacity as given and convert the units from megawatts to gigawatts. We report the sum of U.S. operating capacity and queue capacity separately, each by energy type and region.
-
References
Adelman, David E. 2023. “Permitting Reform’s False Choice.” Working Paper. Available at SSRN: https://doi.org/10.2139/ssrn.4540734.
Aidun, Hillary, Jacob Elkin, Radhika Goyal, Kate Marsh, and Neely McKee. 2022. “Opposition to Renewable Energy Facilities in the United States: March 2022 Edition.” Sabin Center for Climate Change Law, Columbia Law School, New York, NY.
Bistline, John, Kimberly A. Clausing, Neil Mehrotra, James H. Stock, and Catherine Wolfram. “Climate Tax Policy Reform Options in 2025.” The Hamilton Project, Brookings Institution, Washington, DC.
Bui, Quoctrung, and Margot Sanger-Katz. 2016. “Why the Government Owns So Much Land in the West.” New York Times, January 5, 2016. https://www.nytimes.com/2016/01/06/upshot/why-the-government-owns-so-much-land-in-the-west.html.
Daniels, Thomas L, and Hannah Wagner. 2022. “Regulating Utility-Scale Solar Projects on Agricultural Land.” Kleinman Energy, University of Pennsylvania, Philadelphia, PA.
Davis, Lucas W., Catherine Hausman, and Nancy L. Rose. 2023. “Transmission Impossible? Prospects for Decarbonizing the US Grid.” Working Paper 31377, National Bureau of Economic Research, Cambridge, MA. https://doi.org/10.3386/w31377.
Dunn County Land Development Code. 2022. § IV.X.5.e. https://www.dunncountynd.org/index.asp?SEC=1914B7E4-A166-4A1C-8DBA-F04BB4FEC617&DE=3E5084AE-A525-45E5-BB20-B74B3C0E1A44.
Eisenson, Matthew. 2023. “Opposition to Renewable Energy Facilities in the United States: May 2023 Edition.” Sabin Center for Climate Change, Columbia Law School, New York, NY.
Environmental Protection Agency (EPA). 2023. “Background about Compensatory Mitigation Requirements under CWA Section 404.” Washington, DC.
Federal Permitting Improvement Steering Council (FPISC). 2020. Annual Report to Congress: Fiscal Year 2020. Washington, DC.
Fischer, Carolyn. 2019. “Market-Based Clean Performance Standards as Building Blocks for Carbon Pricing.” The Hamilton Project, Brookings Institution, Washington, DC.
Geocaris, Madeline. 2022. “NREL Releases Comprehensive Databases of Local Ordinances for Siting Wind, Solar Energy Projects.” National Renewable Energy Laboratory, Washington, DC.
Greenstone, Michael, Cass Sunstein, and Sam Ori. 2017. “The Next Generation of Transportation Policy.” The Hamilton Project, Brookings Institution, Washington, DC.
Gross, Samantha. 2020. “Renewables, Land Use, and Local Opposition in the United States.” Brookings Institution, Washington, DC.
Hamilton County Plan Commission. 2023. Unified Development Ordinance. § 4.ii. https://www.hamiltoncounty.in.gov/DocumentCenter/View/17536/HCPC-Unified-Development-Ordinance_FINAL_Amended_08242023?bidId=.
Hausman, Catherine. 2023. “Principles for Public Investment in Climate-Responsible Energy Innovation.” The Hamilton Project, Brookings Institution, Washington, DC.
Higdon, James. 2014. “Where Coal Is King.” Politico Magazine, December 9, 2014. https://www.politico.com/magazine/story/2014/12/kentucky-coal-politics-113440/.
Kahn, Jaclyn, and Laura Shields. 2020. “State Approaches to Wind Facility Siting.” National Conference of State Legislatures (NCSL), Washington, DC.
Lawrence Berkeley National Laboratory (LBNL). 2022. “Queues 2021 Data File XLSX.” Accessed April 30, 2024. https://view.officeapps.live.com/op/view.aspx?src=https%3A%2F%2Feta-publications.lbl.gov%2Fsites%2Fdefault%2Ffiles%2Fqueues_2021_clean_data.xlsx&wdOrigin=BROWSELINK.
Lawrence Berkeley National Laboratory (LBNL). 2023. “Queues 2022 Data File XLSX” Accessed April 30, 2024. https://view.officeapps.live.com/op/view.aspx?src=https%3A%2F%2Feta-publications.lbl.gov%2Fsites%2Fdefault%2Ffiles%2Fqueues_2022_clean_data_0.xlsx&wdOrigin=BROWSELINK.
Lawrence Berkeley National Laboratory (LBNL). 2024. “Queued Up 2024 Data File XLXS” Accessed April 30, 2024. https://view.officeapps.live.com/op/view.aspx?src=https%3A%2F%2Femp.lbl.gov%2Fsites%2Fdefault%2Ffiles%2F2024-04%2Fqueues_2023_clean_data_r1.xlsx&wdOrigin=BROWSELINK.
Liscow, Zachary D. 2024. “Getting Infrastructure Built: The Law and Economics of Permitting.” Available at SSRN: https://doi.org/10.2139/ssrn.4775481 SSRN Scholarly Paper. Rochester, NY.
Manitius, Natilie, Johan Cavert, and Casey Kelly. 2024. “Contextualizing Electric Transmission Permitting: Data from 2010 to 2020.” Niskanen Center, Washington, DC.
Minott, Fishman, and Jacobs. 2023. “How Does the Fiscal Responsibility Act Reform Permitting and Environmental Review?” Bipartisan Policy Center, Washington, DC.
Nicholson, Charles P., James Gregory, Piet deWitt, Carole deWitt, Rona Spellecacy, P. E. Hudson. 2022. “2022 Annual NEPA Report.” National Association of Environmental Professionals, Seattle, WA.
National Governors Association (NGA). 2023. “Transmission Siting and Permitting: How Governor Leadership Can Advance Projects.” Washington, DC.
National Renewable Energy Laboratory (NREL). 2024a. “U.S. Solar Siting Regulation and Zoning Ordinances.” OpenEI, U.S. Department of Energy, Washington, DC. https://data.openei.org/.
National Renewable Energy Laboratory (NREL). 2024b. “U.S. Wind Siting Regulation and Zoning Ordinances.” OpenEI, U.S. Department of Energy, Washington, DC. https://data.openei.org/.
National Renewable Energy Laboratory (NREL). n.d. “Solar Permitting, Inspection, and Interconnection Timelines.” Golden, CO.
Nilson, Robi, Ben Hoen, and Joe Rand. 2023. “Survey of Utility-Scale Wind and Solar Developers Report.” Lawrence Berkely National Laboratory, U.S. Department of Energy, Berkeley, CA. https://live-etabiblio.pantheonsite.io/sites/default/files/w3s_developer_survey_report_-011824_version.pdf.
Paras, Mareldi Ahumada, Lauren Bauer, Wendy Edelberg, Isabel Leigh, Michael Mastrandrea, Noadia Steinmetz-Silver, and Michael Wara. 2023. “Ten Economic Facts about Electricity and the Clean Energy Transition.” The Hamilton Project, Brookings Institution, Washington DC.
Popp, David. 2019. “Promoting Innovation for Low-Carbon Technologies.” The Hamilton Project, Brookings Institution, Washington, DC.
Rand, Joseph, Nick Manderlink, Will Gorman, Ryan Wiser, Joachim Seel, Julie Mulvaney Kemp, and Fritz Kahrl. 2024. “Queued Up: 2024 Edition Characteristics of Power Plants Seeking Transmission Interconnection As of the End of 2023.” Lawrence Berkely National Laboratory, U.S. Department of Energy, Berkeley, CA. https://emp.lbl.gov/sites/default/files/2024-04/Queued%20Up%202024%20Edition_1.pdf.
Ruple, Jon C., Jamie Pleune, and Erik Heiny. 2022. “Evidence-based recommendations for improving National Environmental Policy Act implementation.” Colum. J. Env’t L. 47: 273.
Silverman, Abraham, Zachary A. Wendling, Kavyaa Rizal, and Devan Samant. 2023. “Outlook for Pending Generation in the PJM Interconnection Queue.” Center on Global Energy Policy, Columbia University, New York, NY.
Solomon, Michelle. 2022. “Inflation Reduction Act Benefits: Billions In Just Transition Funding For Coal Communities.” Forbes, August 24, 2022. https://www.forbes.com/sites/energyinnovation/2022/08/24/inflation-reduction-act-benefits-billions-in-just-transition-funding-for-coal-communities/?sh=1a5929a26ebd.
Sud, Rayan, and Sanjay Patnaik. 2022. “How Does Permitting for Clean Energy Infrastructure Work?” Brookings Institution, Washington, DC.
Sud, Rayan, Sanjay Patnaik, and Robert Glicksman. 2023. “How to Reform Federal Permitting to Accelerate Clean Energy Infrastructure: A Nonpartisan Way Forward.” Brookings Institution, Washington, DC.
The Hamilton Project and Energy Policy Institute at the University of Chicago. 2017. “Twelve Economic Facts on Energy and Climate Change.” The Hamilton Project, Brookings Institution, Washington, DC.
The Hamilton Project and The Stanford Institute for Economic Policy Research. 2019. “Ten Facts about the Economics of Climate Change and Climate Policy.” The Hamilton Project, Brookings Institution, Washington, DC.
U.S. Department of Energy (DOE). n.d. “How it Works: The Role of a Balancing Authority.” Washington, DC. https://www.energy.gov/sites/default/files/2023-08/Balancing%20Authority%20Backgrounder_2022-Formatted_041723_508.pdf.
U.S. Department of the Treasury (Treasury). 2023. “Treasury Releases Guidance to Drive Investment to Coal Communities.” Washington, DC.
U.S. Energy Information Administration (EIA). 2022. “Annual Coal Report 2022.” U.S. Energy Information Administration, Washington, DC.
U.S. Energy Information Administration (EIA). 2023a. “Biden-Harris Administration Announces $1.3 Billion to Build Out Nation’s Electric Transmission and Releases New Study Identifying Critical Grid Needs.” Washington, DC.
U.S. Energy Information Administration (EIA). 2023b. “Preliminary Monthly Electric Generator Inventory (Based on Form EIA-860M as a Supplement to Form EIA-860).” December 2023. Washington, DC.
U.S. Energy Information Administration (EIA). n.d. “Hourly Electric Grid Monitor.” Washington, DC. https://www.eia.gov/electricity/gridmonitor/about.
U.S. Federal Energy Regulatory Commission [FERC]. n.d. “Electric Power Markets.” Accessed May 1, 2024. Washington, DC. https://www.ferc.gov/electric-power-markets.
U.S. Federal Permitting Dashboard. n.d. Accessed May 1, 2024. https://www.permits.performance.gov/.
U.S. Fish and Wildlife Service (FWS). n.d.a. “Habitat Conservation Plans | U.S. Fish & Wildlife Service.” Accessed May 1, 2024. https://www.fws.gov/service/habitat-conservation-plans.
U.S. Fish and Wildlife Service (FWS). n.d.b. “Habitat Conservation Plans and “No Surprises” Assurances: Frequently Asked Questions.” Accessed May 1, 2024. https://www.fws.gov/node/265320#
U.S. Office of Energy Efficiency and Renewable Energy (EERE). 2023. “Tackling High Costs and Long Delays for Clean Energy Interconnection.” U.S. Department of Energy, Washington, DC.
USA Today. n.d. “data-solar-wind-opposition.” https://github.com/USATODAY/data-solar-wind-opposition/blob/main/README.md.
Weise, Elizabeth, and Suhail Bhat. 2024. “Local Governments Block Green Energy: Here’s How USA Today Measured the Limits Nationwide.” USA Today, February 4, 2024. Accessed April 30, 2024. https://www.usatoday.com/story/news/investigations/2024/02/04/green-energy-nationwide-bans/71841275007/.
Weise, Elizabeth, Karina Zaiets, Ramon Padilla, and Suhail Bhat. 2024. “Counties are blocking wind and solar across the US — maps show energy capacity in your area.” USA Today, February 27, 2024. Accessed April 30, 2024. https://www.usatoday.com/story/graphics/2024/02/27/renewable-energy-sources-ban-map/72630315007/.
Welton, Shelley. 2024. “Governing the grid for the future: The case for a Federal Grid Planning Authority.” The Hamilton Project, Brookings Institution, Washington, DC.
White House. 2021. “Fact Sheet: President Biden Sets 2030 Greenhouse Gas Pollution Reduction Target Aimed at Creating Good-Paying Union Jobs and Securing U.S. Leadership on Clean Energy Technologies.” White House, Washington, DC. April 20, 2023.
White House. 2024. “Fact Sheet: Biden-Harris Administration Announces Key Actions to Strengthen America’s Electric Grid, Boost Clean Energy Deployment and Manufacturing Jobs, and Cut Dangerous Pollution from the Power Sector.” White House, Washington, DC. April 25, 2024.
Authors


Related Content
-
Acknowledgements and disclosures
The authors are grateful to Matthew B. Eisenson, Catherine Hausman, Zachary Liscow, Michael Mastrandrea, and Shelley Welton for their insightful comments. We appreciate guidance, comments, and data support from David E. Adelman and Joseph Rand. Noadia Steinmetz-Silber provided excellent research support. The authors would also like to thank Jeanine Rees for graphic design and layout contributions and Alison Hope for copy editing assistance.
The Brookings Institution is financed through the support of a diverse array of foundations, corporations, governments, individuals, as well as an endowment. A list of donors can be found in our annual reports published online here. The findings, interpretations, and conclusions in this report are solely those of its author(s) and are not influenced by any donation.
The Brookings Institution is committed to quality, independence, and impact.
We are supported by a diverse array of funders. In line with our values and policies, each Brookings publication represents the sole views of its author(s).