
The first phase of the COVID-19 pandemic took its toll on the populations of many of the nation’s largest cities and metropolitan areas. During the peak pandemic year (July 2020 through July 2021), national population growth dropped to a new low due to diminished immigration from abroad as well as more deaths and fewer births. But it was the movement of residents within the U.S.—from cities to suburbs and away from large metro areas—that made the biggest impact on urban areas’ population declines. Such movement was prompted by a fear of proximity to others in dense urban centers and, for some, the ability to work virtually.
Now, the question becomes: Will this sudden dispersal of migrants lead to a long-term decline in urban centers and large metropolises? Or is it merely a blip, after which big city and metropolitan growth will remerge?
Newly released census data for July 2021 through July 2022 suggests the latter, showing that the sharp population losses in urban centers and metropolises are lessening and, in some cases, turning into population gains.1
One aspect of this moderation is noteworthy: The rise in immigration from abroad to many large counties and metropolitan areas. An earlier Census Bureau data release revealed a sharp increase in the nation’s immigration compared to pre-pandemic years (when the Trump administration enacted severe immigration restrictions) and early in the pandemic (when U.S. borders were effectively closed). The newly released data shows that many urban core counties and large metropolitan areas benefitted substantially from immigration over the most recent year—in some cases countering a continued domestic out-migration to other parts of the U.S.—while in other areas, domestic out-migration has tapered off. The new data also shows that natural increase (the excess of births over deaths) rose modestly at the national level and served to mute the large urban population declines of the previous year.
Many urban core counties tempered or reversed their population declines
The newly released Census Bureau estimates permit a look at population shifts in large urban core counties over 2020-21 and 2021-22, in the context of shifts during the previous decade. Figure 1 displays annual growth rates for counties classed as urban cores, inner suburbs, and outer suburbs, aggregated for the nation’s large metro areas based on a typology created by Brookings Metro.2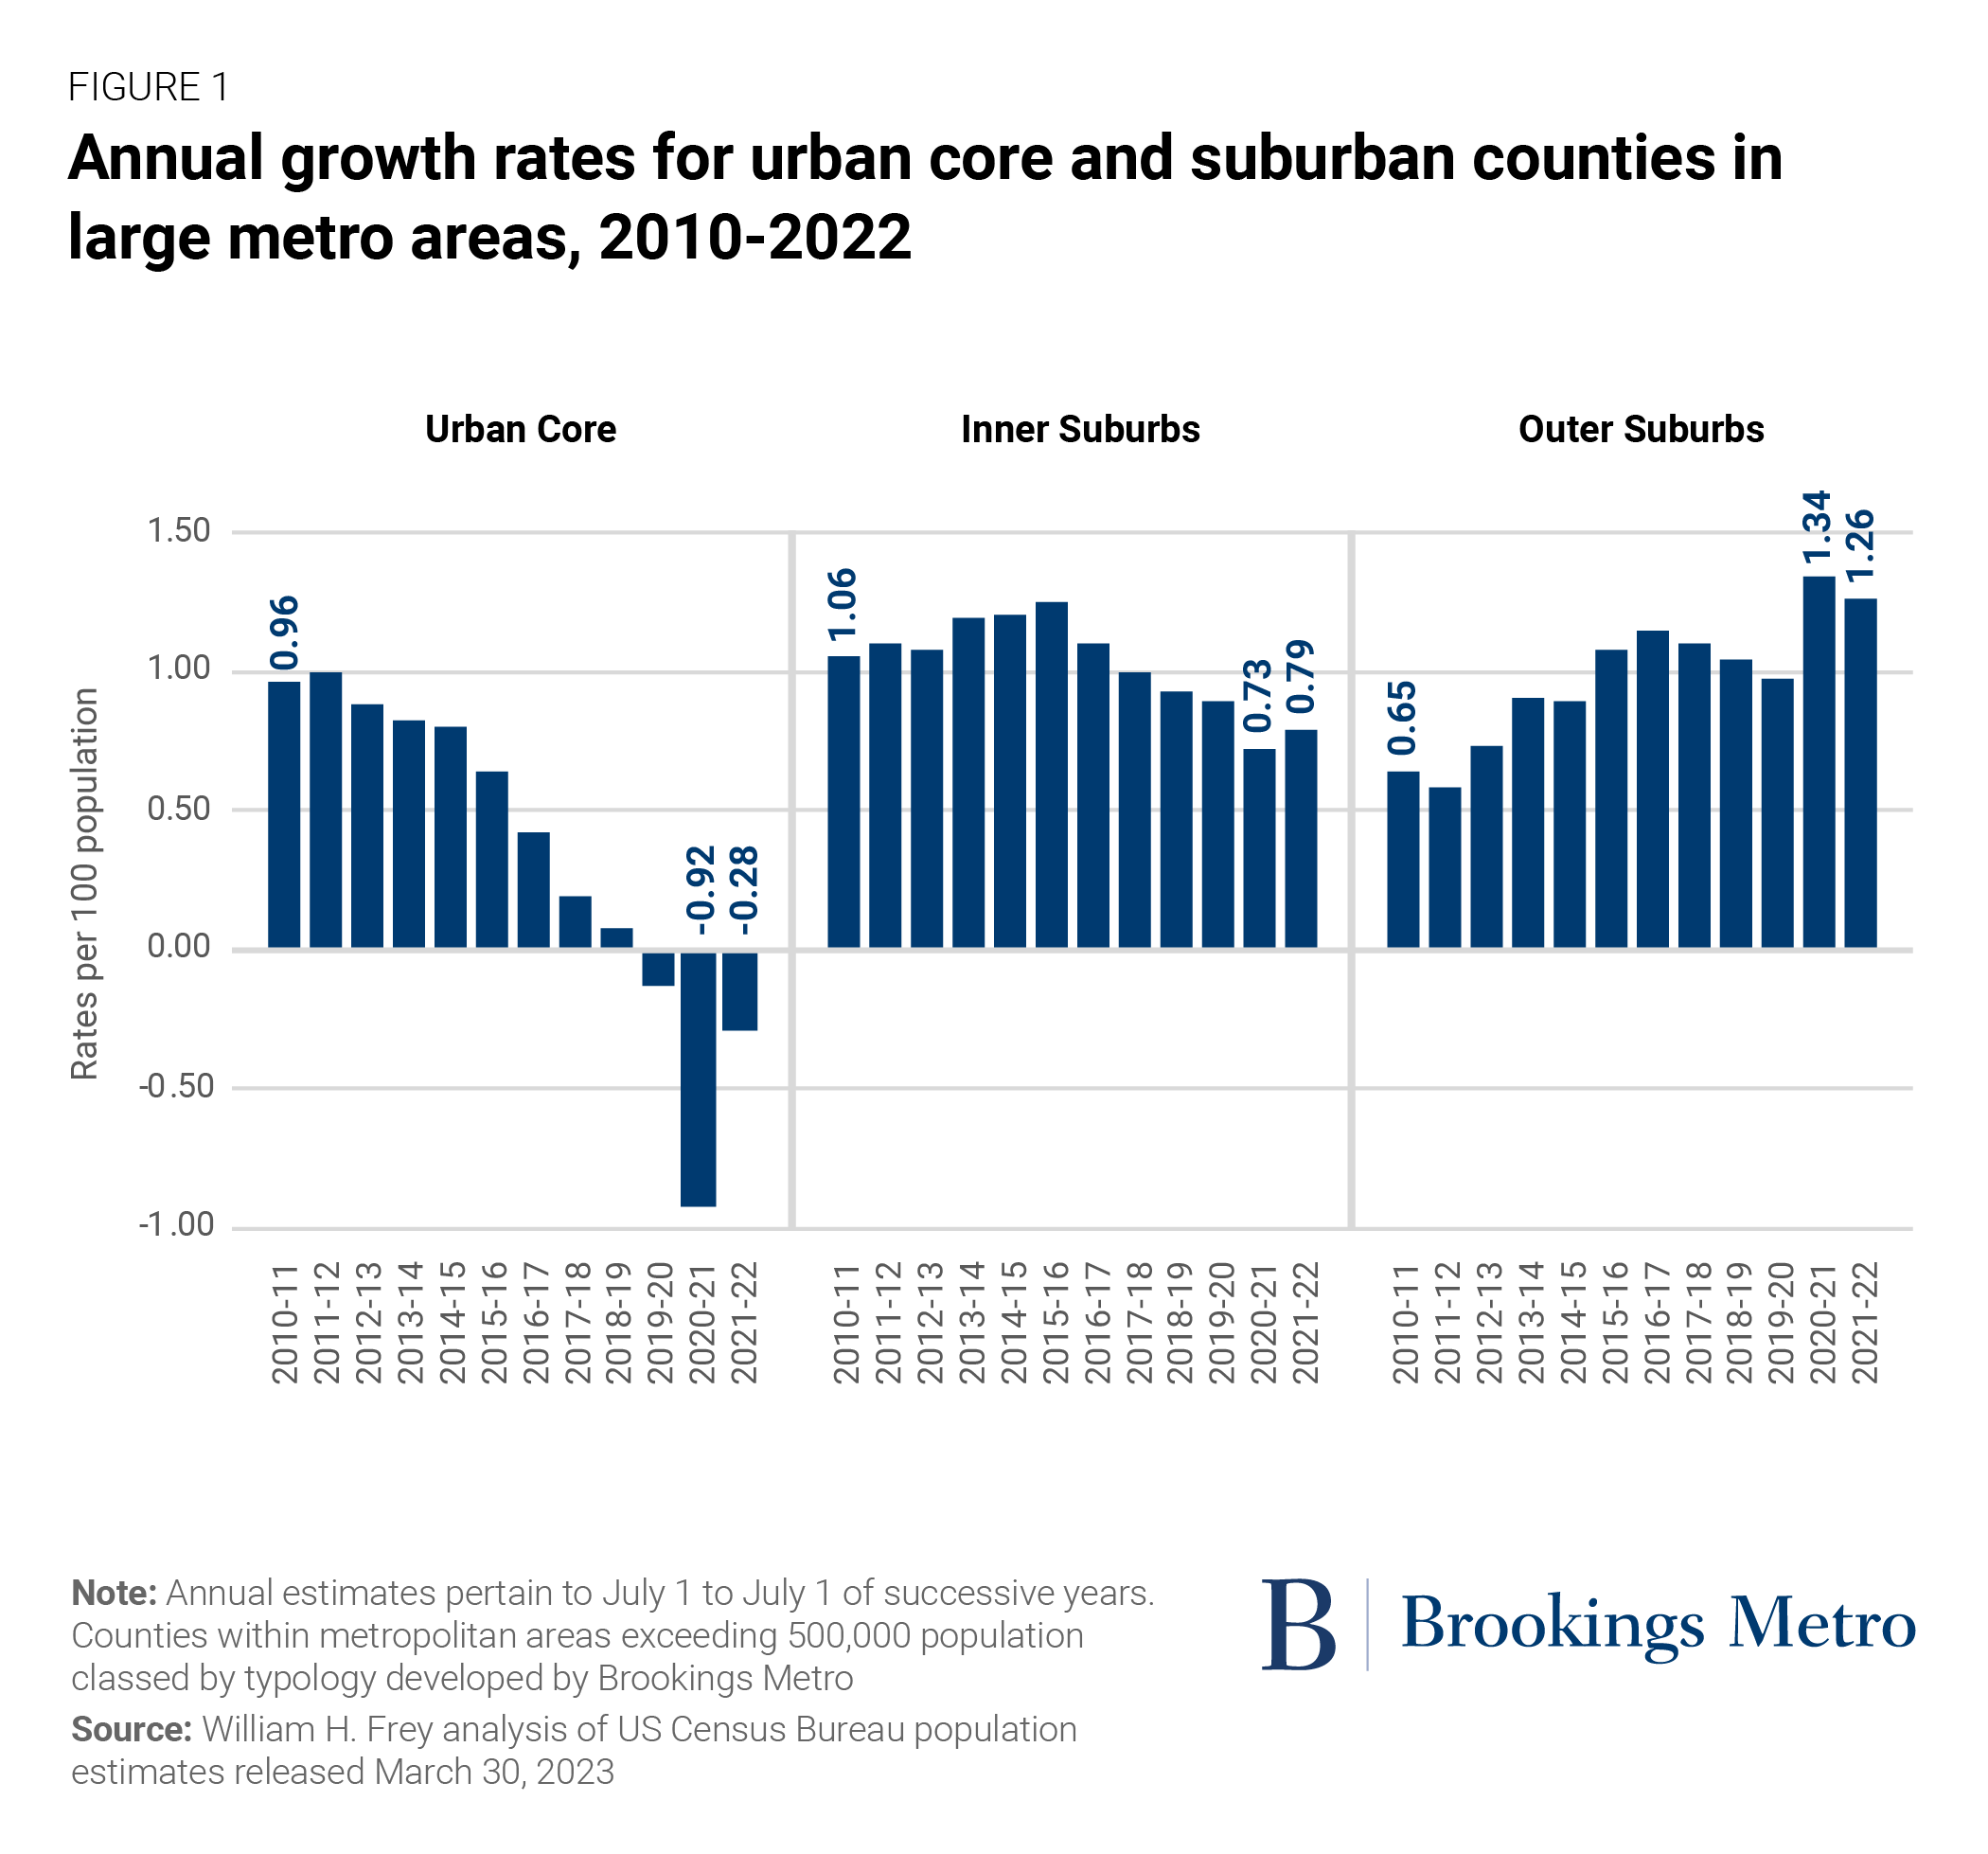
The trends for urban core counties show the sharpest population decline in the first full pandemic year. While this was the largest aggregate rate of population loss since 2010, these counties, as a group, were already experiencing diminishing growth and decline since the mid-2010s. This was after core counties saw healthy growth levels earlier in the decade in response to the Great Recession, during which many young adults and would-be homebuyers became “stranded” in cities, only to disperse outward as the economy picked up.
Nonetheless, the aggregate core county declines abated noticeably in the recent 2021-22 period, from -0.92% to -0.28%. And while both inner suburb and outer suburb counties continued to grow, it is noteworthy that growth rates in the former—which took a hit during the first pandemic year—rose slightly in the most recent year, from 0.73% to 0.79%. In contrast, growth in outer suburb counties—which rose sharply during the first pandemic year, to 1.34%—displayed a modest growth decline in 2021-22, to 1.26%.
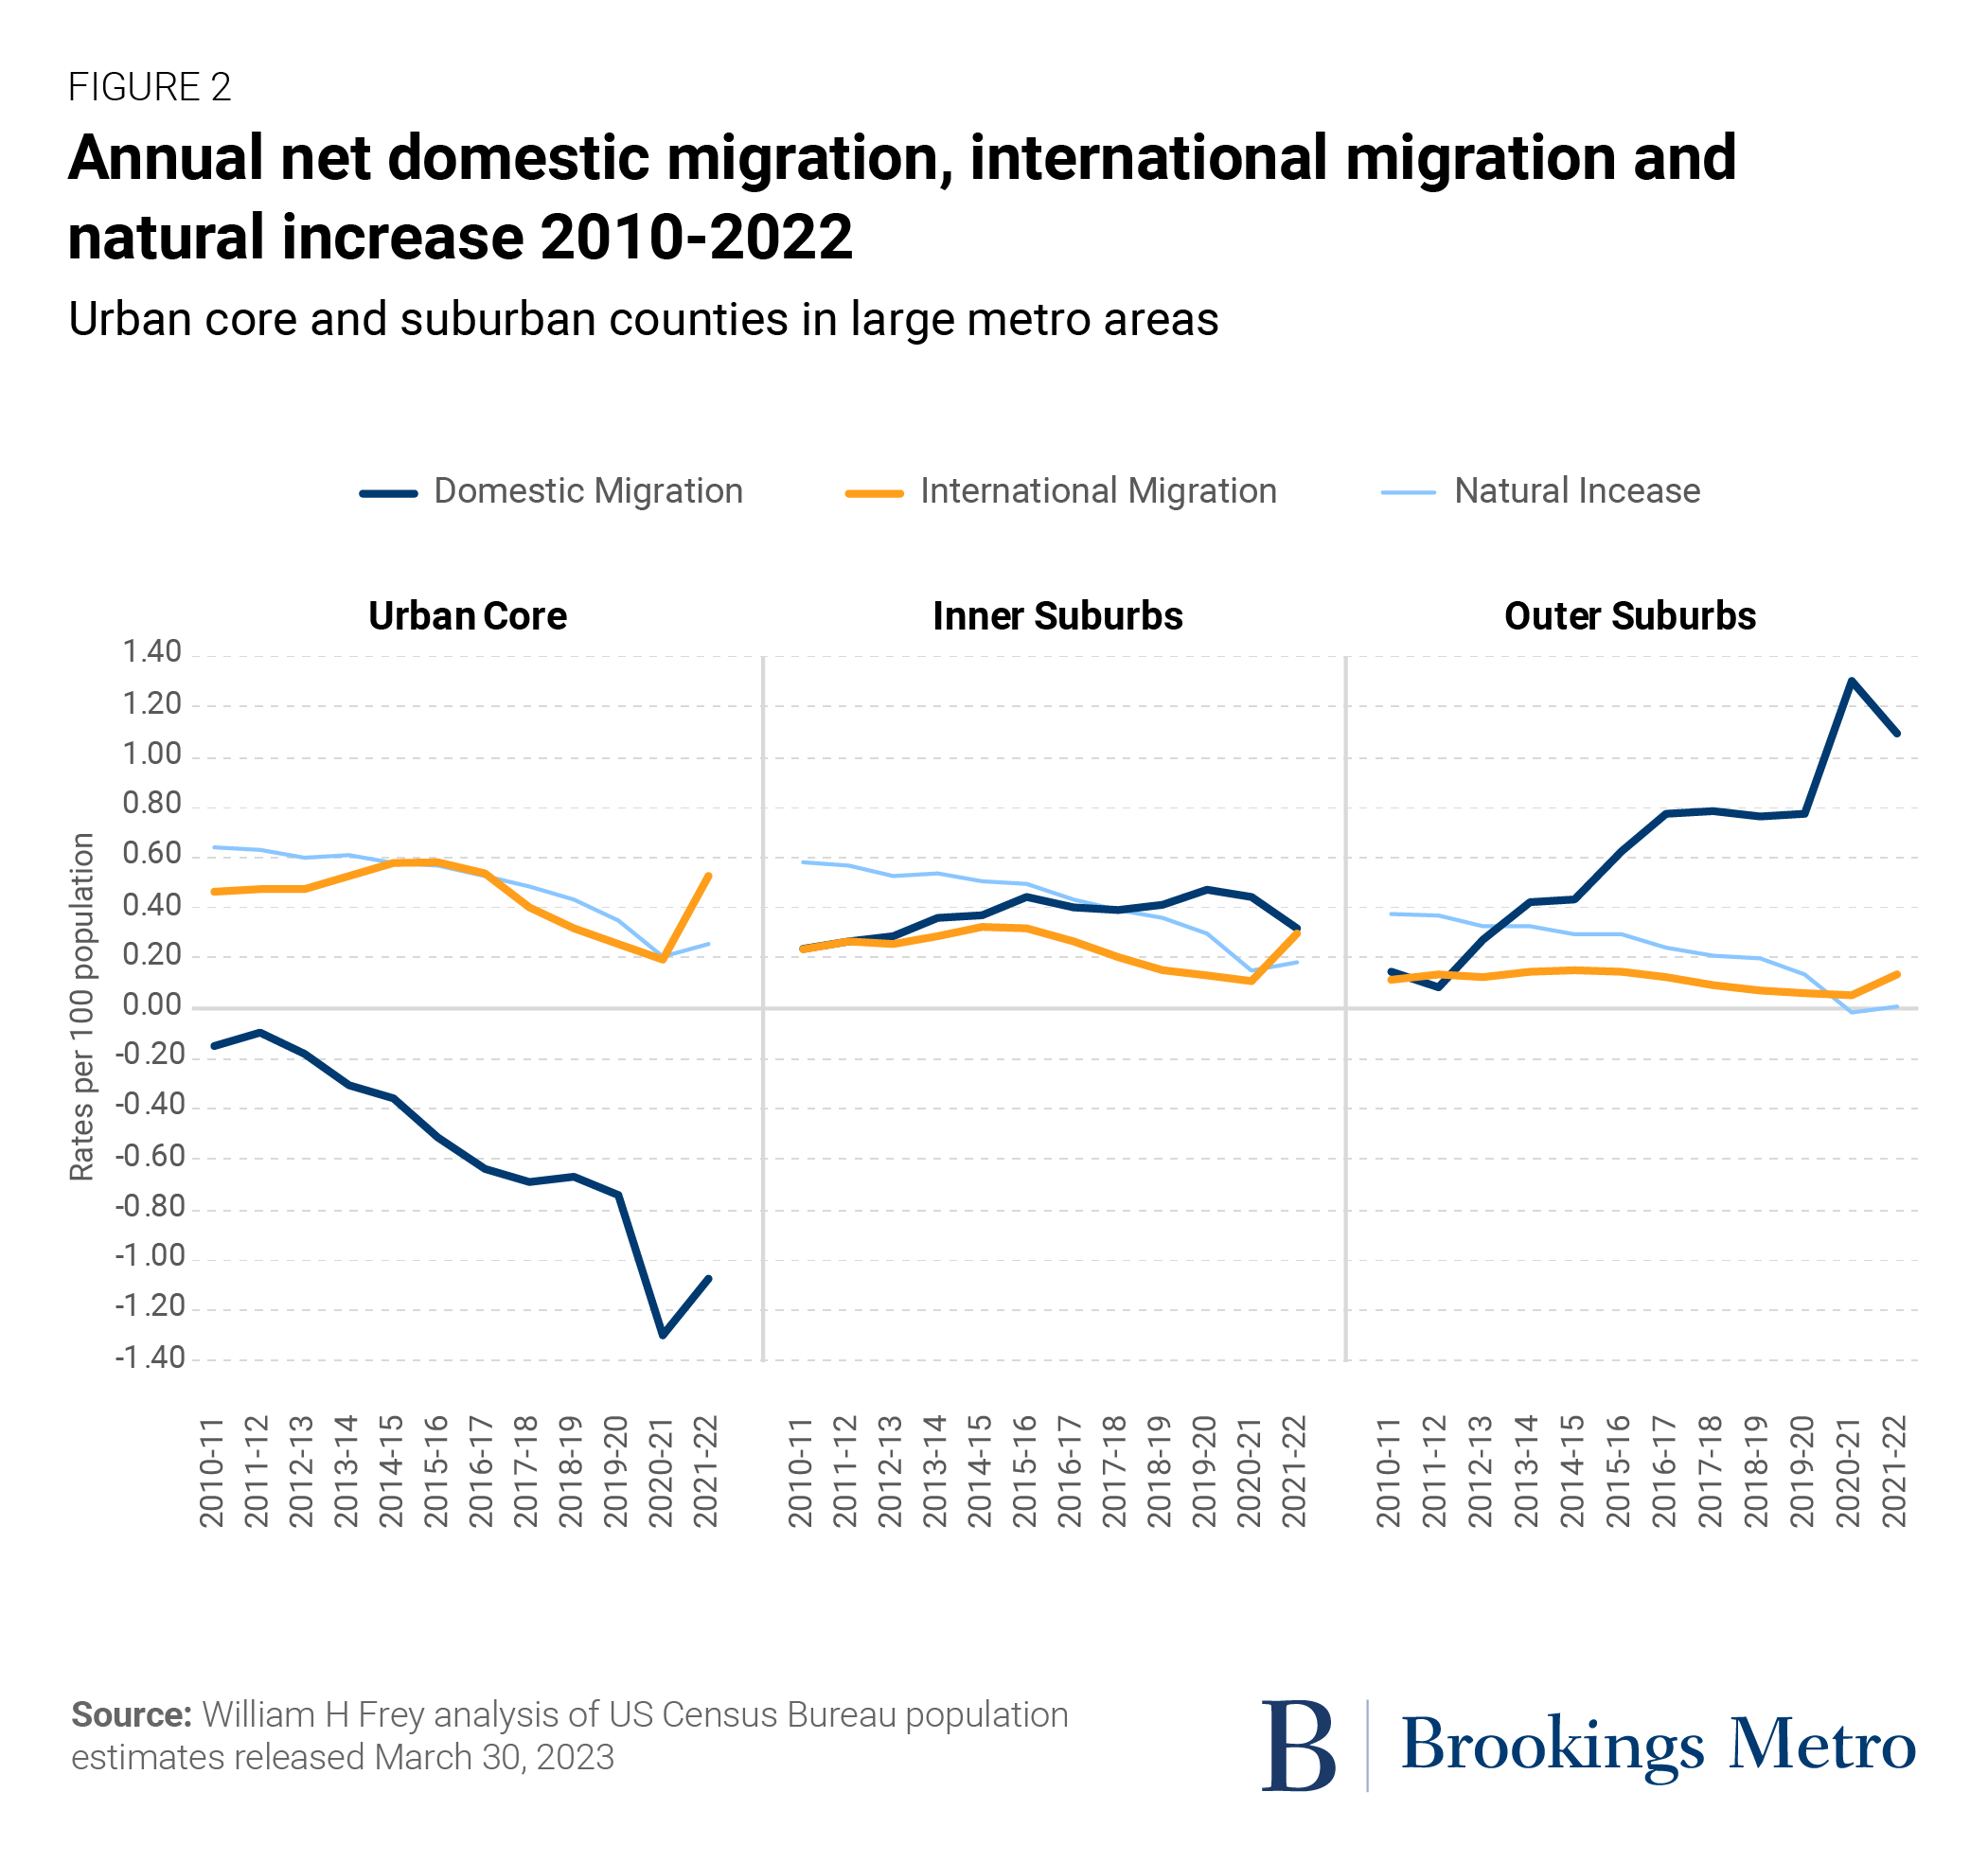
Figure 2 displays the demographic components that underlie these shifts: net domestic migration, net international migration, and natural increase. For urban core counties, domestic migration was a major driver of change up until the first pandemic year, when the rate dropped from -0.74% to -1.30%. Yet the noticeable moderation in urban core population loss for 2021-22 was attributable to both a decline in domestic out-migration (from -1.30% to -1.07%) and a rise in international migration (from 0.19% to 0.53%). There was also a modest rise in natural increase, from 0.21% to 0.25%.
The relative contributions of these components differ for individual counties, but net international migration rose in almost all of them, serving as new demographic cushion.
The rise in international migration was largely responsible for the higher 2021-22 growth of inner suburbs, especially because domestic in-migration there dipped. And the downtick in overall growth for outer suburbs was mostly due to a drop-off in domestic migration (from 1.31% to 1.10%); as a group, these counties showed only small gains from international migration and a continued negative value of natural increase (meaning more deaths than births).
Perhaps the most vivid examples of rebounding urban cores are two places that many saw as the poster children for pandemic-related population loss: New York County (Manhattan) and San Francisco County (the city of San Francisco). These counties are symbolic of dense core areas, home to large numbers of young people and professionals, and dependent on public transportation—attributes which have been associated with pandemic-related flight. Both experienced accentuated population losses in 2020-21.
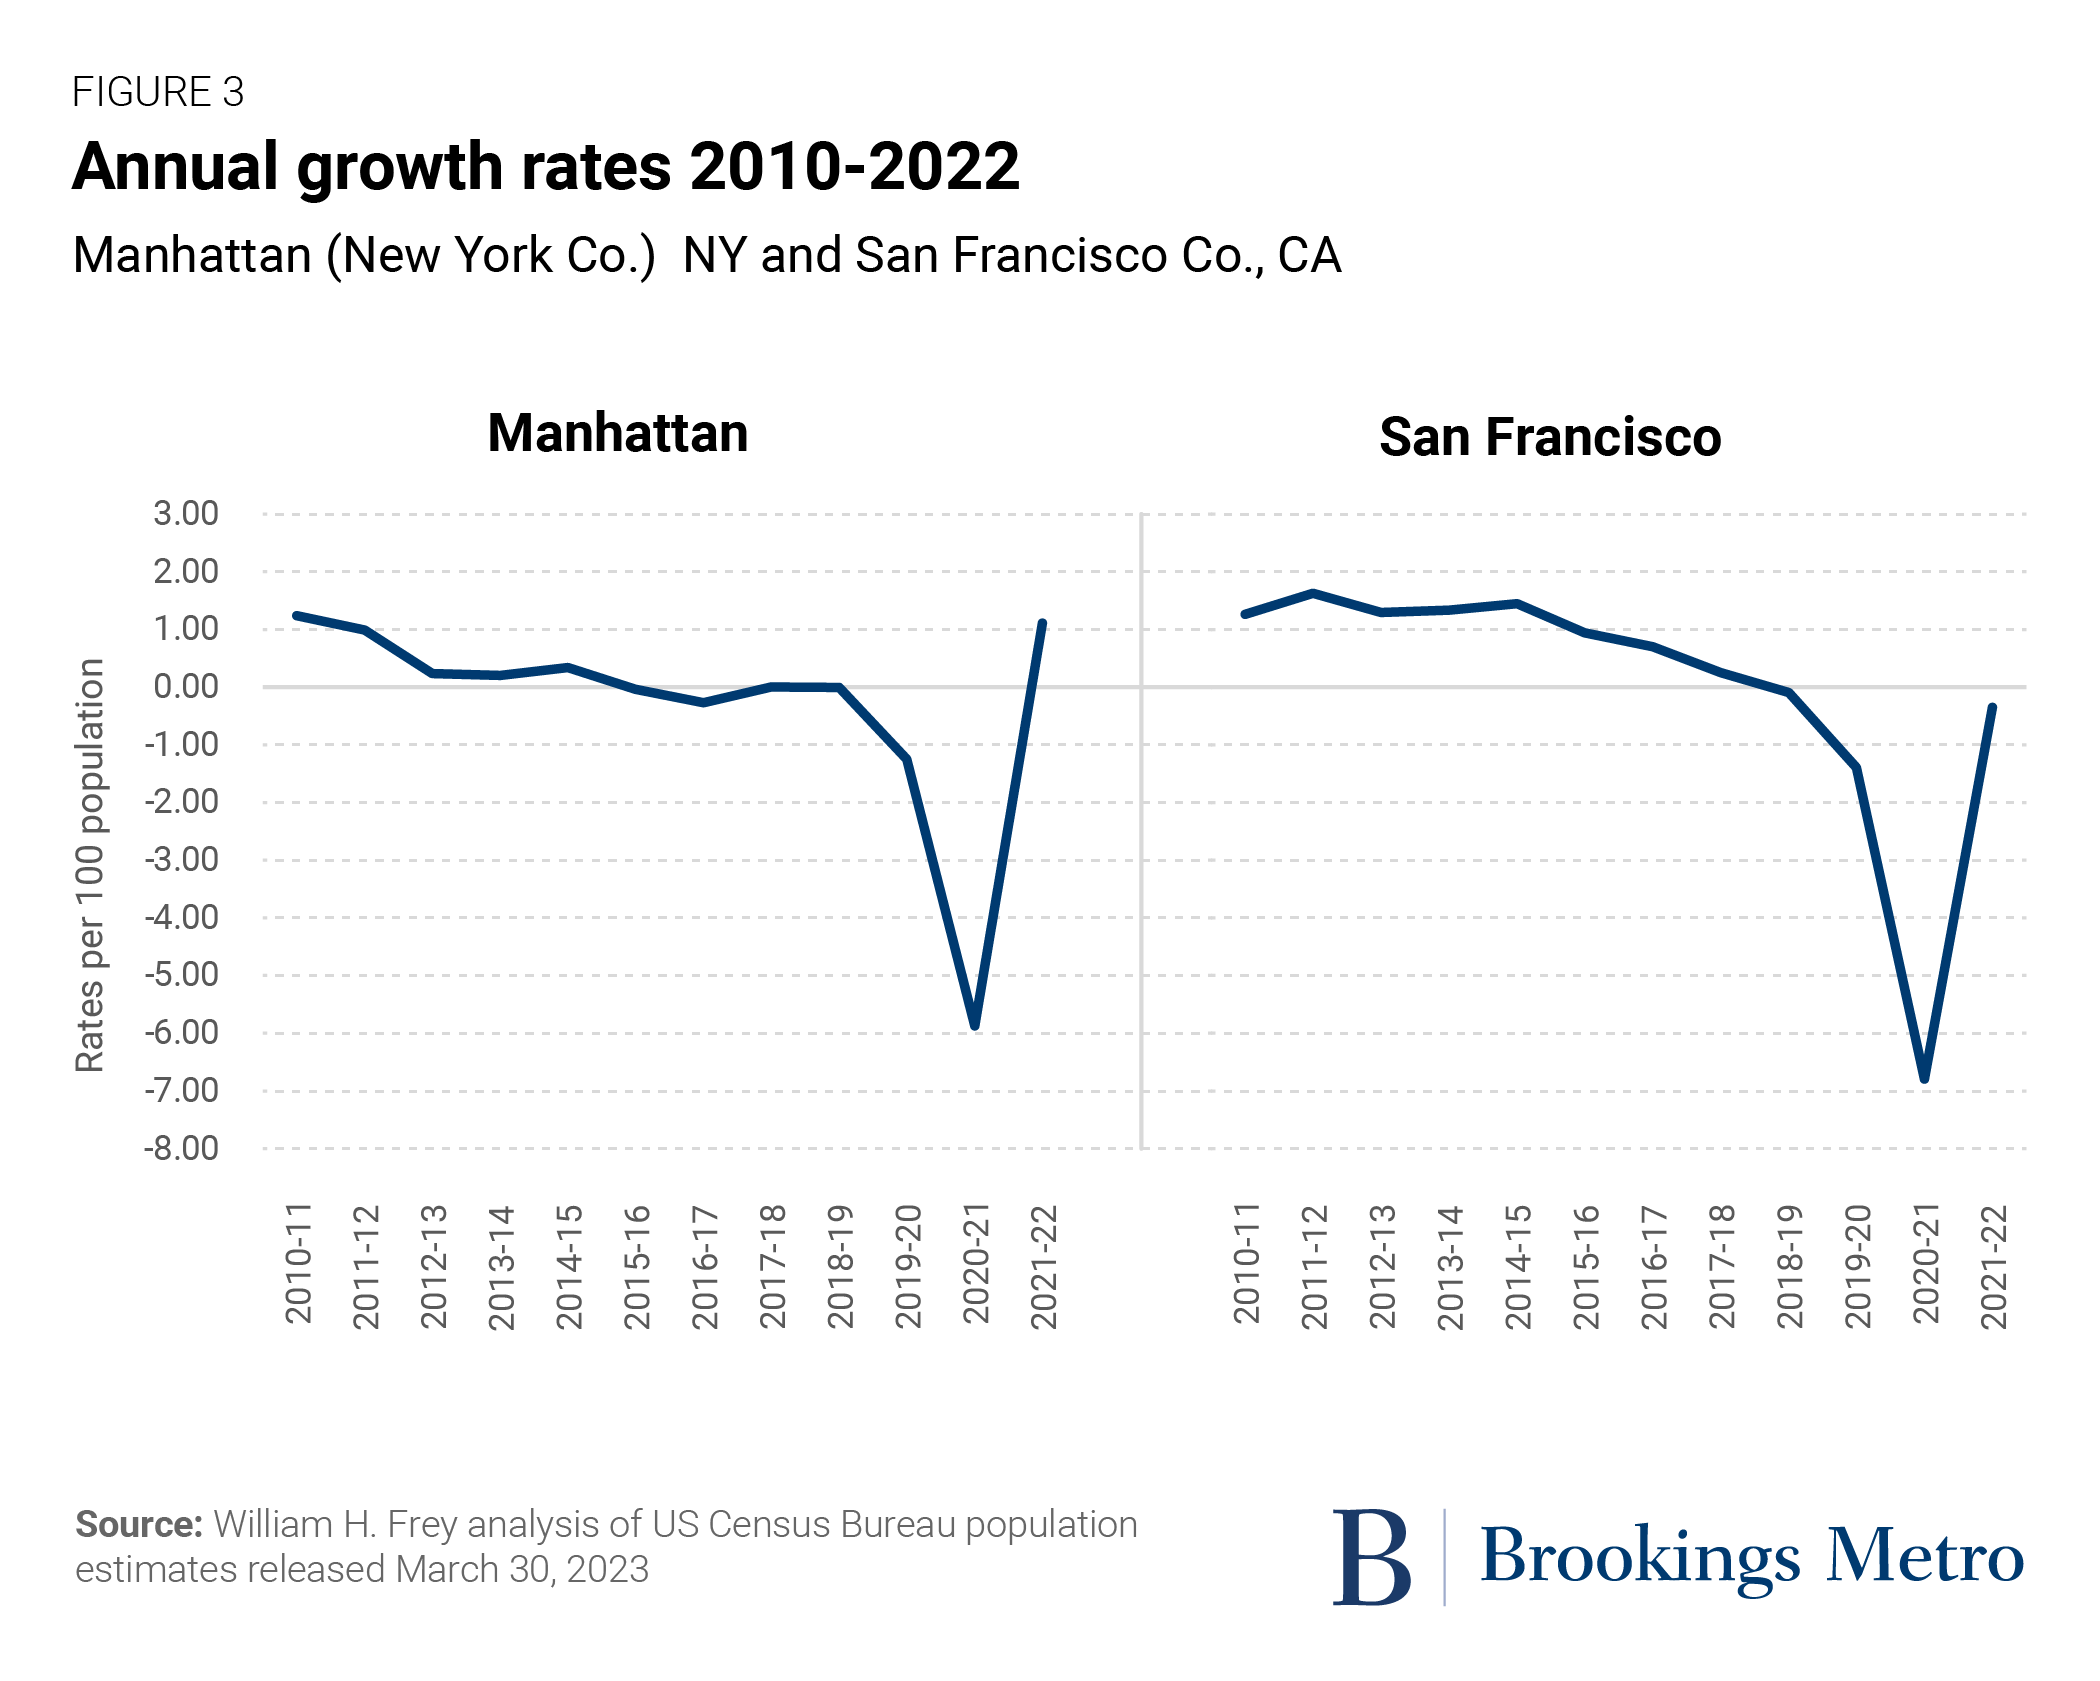
Yet these counties moved sharply in the opposite direction in 2021-22. Manhattan’s rate of population change shifted from -5.87% to 1.11% (from a loss of 98,505 people to a gain of 17,472). San Francisco moved from a rate of -6.79% to -0.35% (from a loss of 59,140 people to a loss of just 2,816). (Download Table A.) Although international migration increased in each, the shift in domestic migration had most to do with their turnarounds. Manhattan lost 98,566 domestic migrants in 2020-21 but gained 2,908 in 2021-22. San Francisco lost domestic migrants in both periods but far fewer in the latter (from -57,611 to -9,421). (Download Table B.)
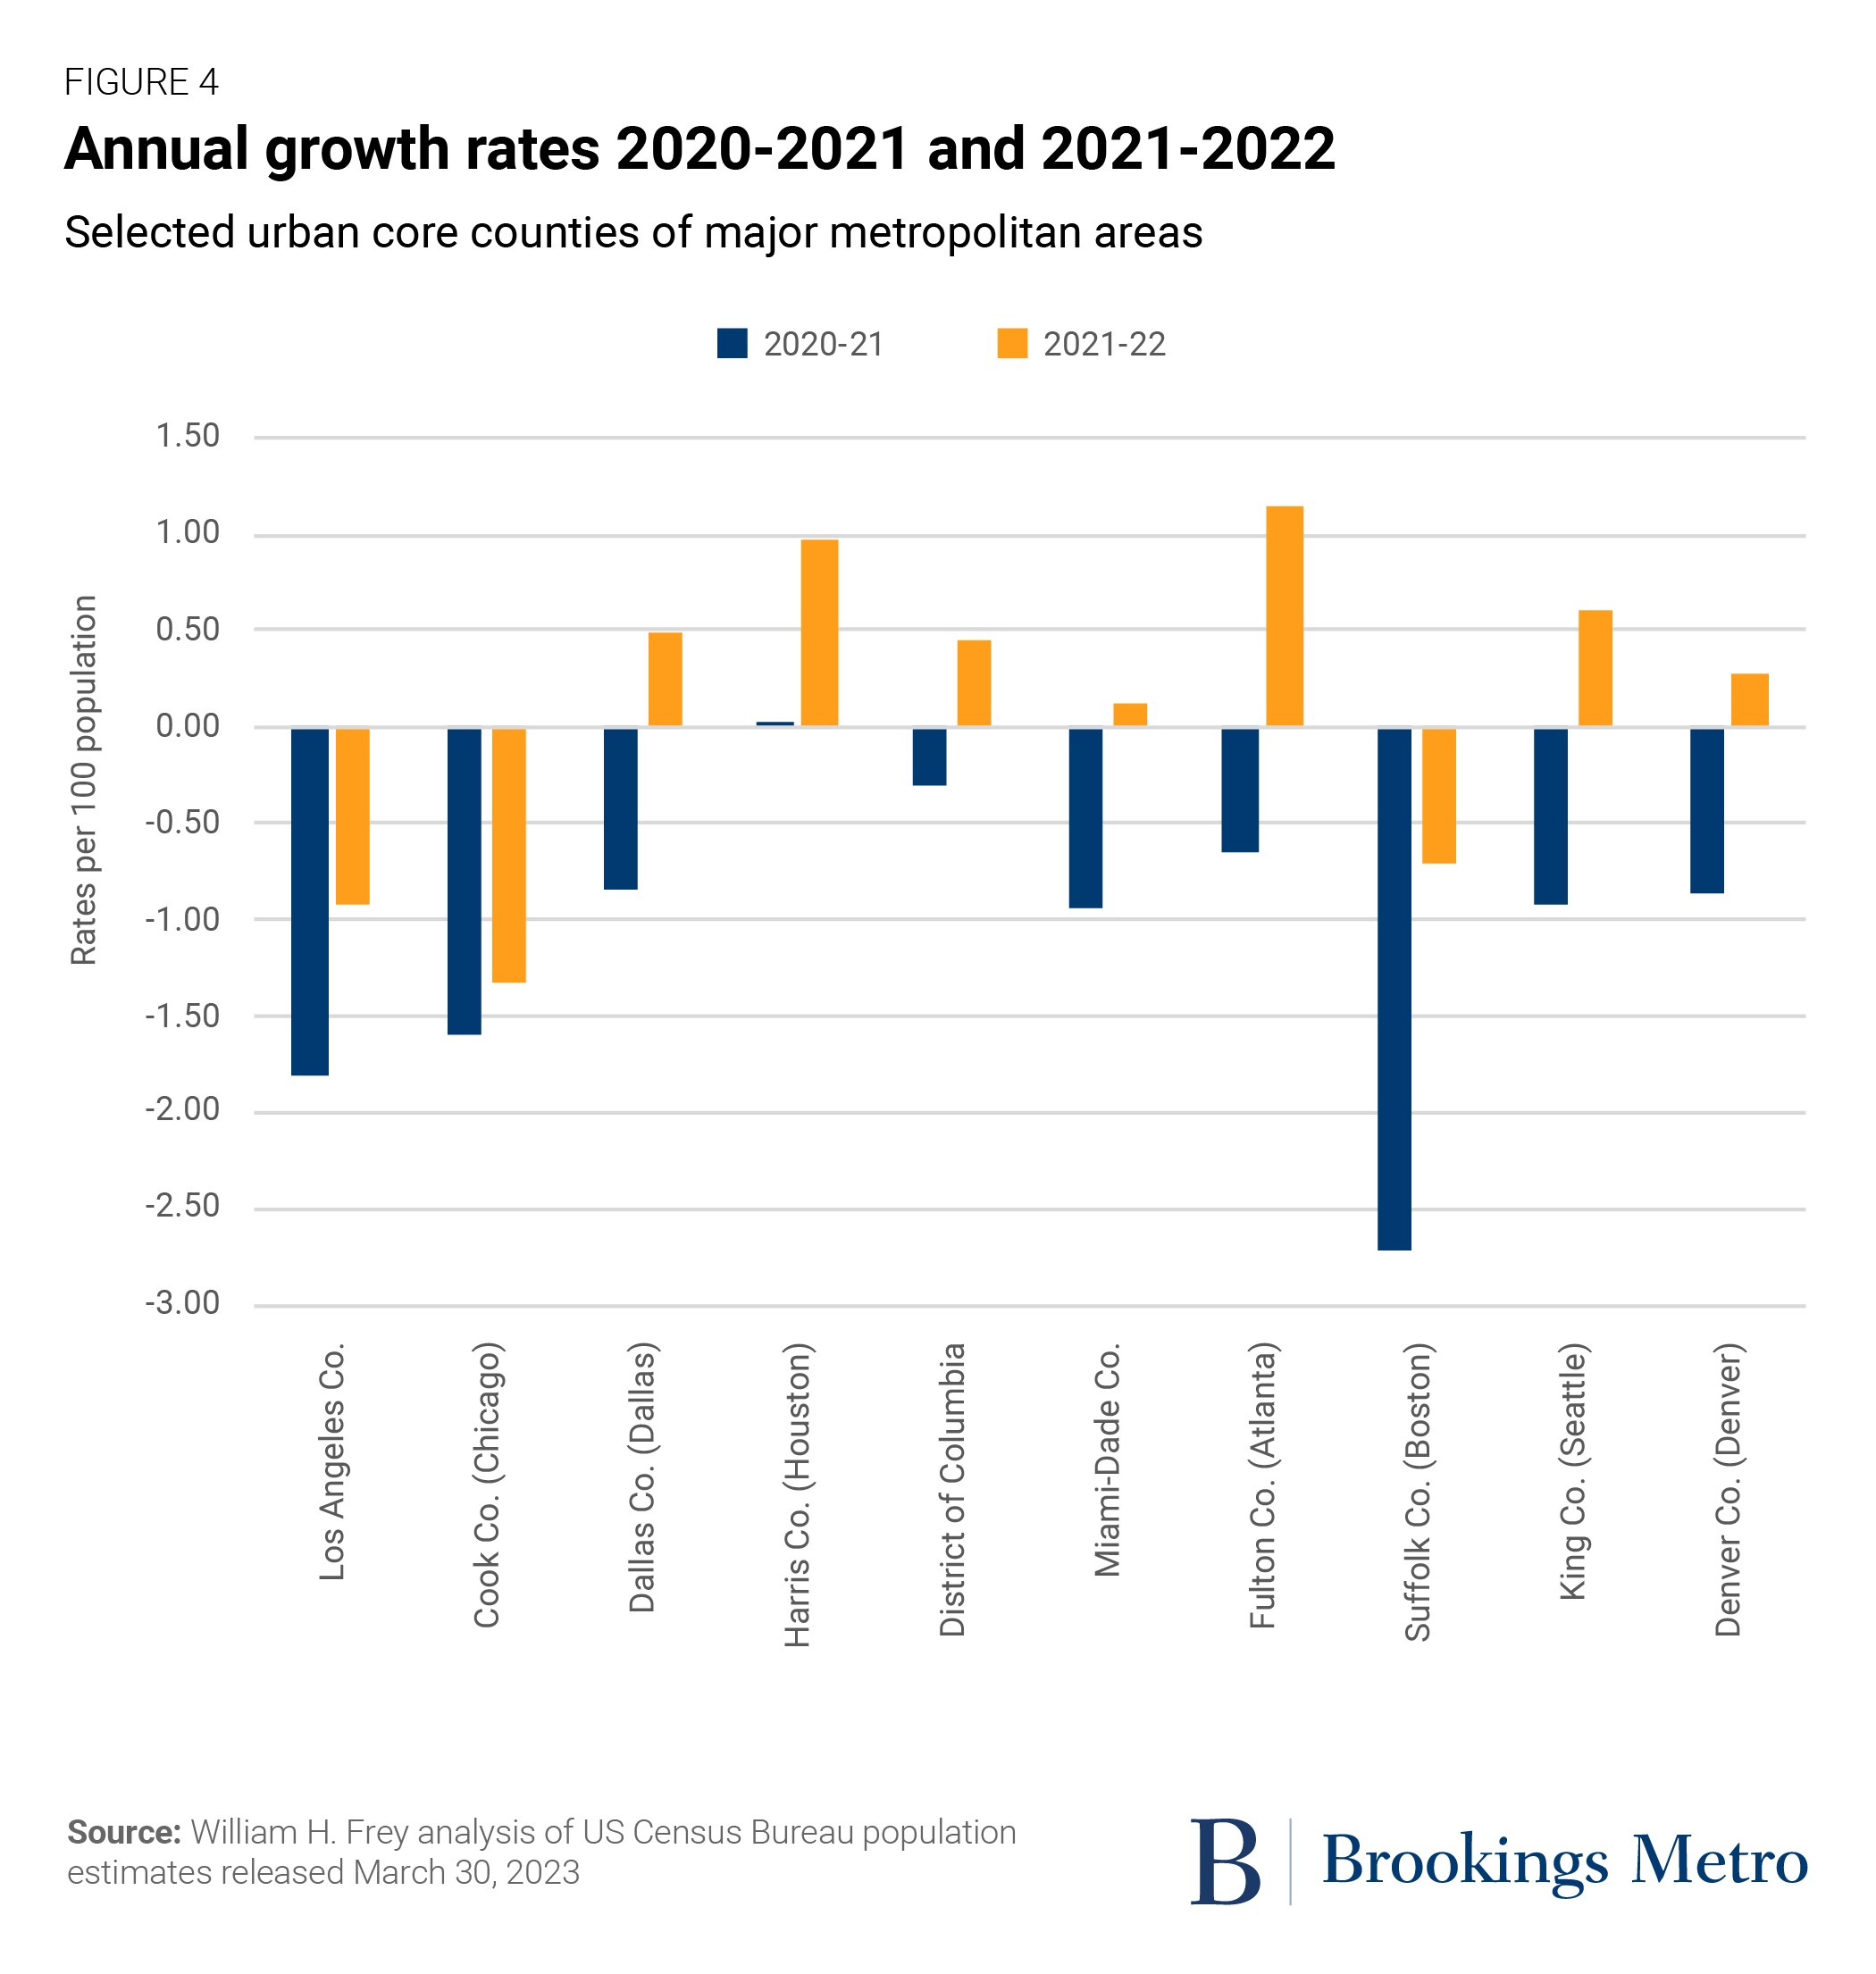
While Manhattan and San Francisco are perhaps the most dramatic examples of urban core turnaround, there are plenty of other counties that showed reduced losses, increased gains, or shifts from losses to gains between 2020-21 and 2021-22.
Figure 4 displays urban core counties with such changes. Los Angeles County’s population decline was cut in half (from -1.81% to -0.92%), and in Suffolk County, Mass. (home to Boston), it was reduced by three-quarters. Harris County, Texas (home to Houston) increased its modest 2020-21 population gain to nearly 1% in 2021-22. And a number of counties—including Dallas County, Texas; Washington, D.C.; Miami-Dade County, Fla.; Fulton County, Ga. (home to Atlanta); King County, Wash. (home to Seattle); and Denver County, Colo.—shifted from population losses in 2020-21 to gains in 2021-22.
A look at 38 selected core counties shows that most “did better” by having smaller populations losses or greater gains in the recent year (download Table A). Yet some did worse by showing even greater losses. These include Bronx County and Richmond County (Staten Island) in New York; Philadelphia; Baltimore City, Md.; Allegheny County, Penn. (home to Pittsburgh); St Louis, Mo.; and Orleans Parish (New Orleans), among others.
A look at the components of these shifts reveals that while all of these core counties received more immigrants from abroad in 2021-22 compared with 2020-21, lower domestic out-migration was more important in lowering population losses or increasing gains for a plurality of urban core areas (download Table B.) For example, King County, Wash.’s (Seattle) domestic out-migration of -37,655 was reduced to -16,035 (a reduced out-migration of 21,620) at the same time its immigration from abroad increased from 8,662 to 23,346 (an increased gain of 14,684). The change in both migration components helped King County flip from a population loss in 2020-21 to a gain in 2021-22, but the effect of lower domestic out-migration was more substantial.
There are several areas where the rise in immigration from abroad overwhelmed the reduced domestic migration loss between the two years. In Miami-Dade County, for example, domestic out-migration in 2021-2022 was only 3,129 less than in 2020-2021, but immigration from abroad rose by 24,062 (from 15,108 to 39,170).
Major metro areas show signs of a rebound
Similar to many urban core counties, many of the nation’s largest metropolitan areas showed signs of a demographic turnaround in 2021-22.3 Figure 5 displays annual growth rates from 2010 to 2022 for major metro areas (those with 2020 populations exceeding 1 million), for all other metro areas, and for nonmetropolitan areas.
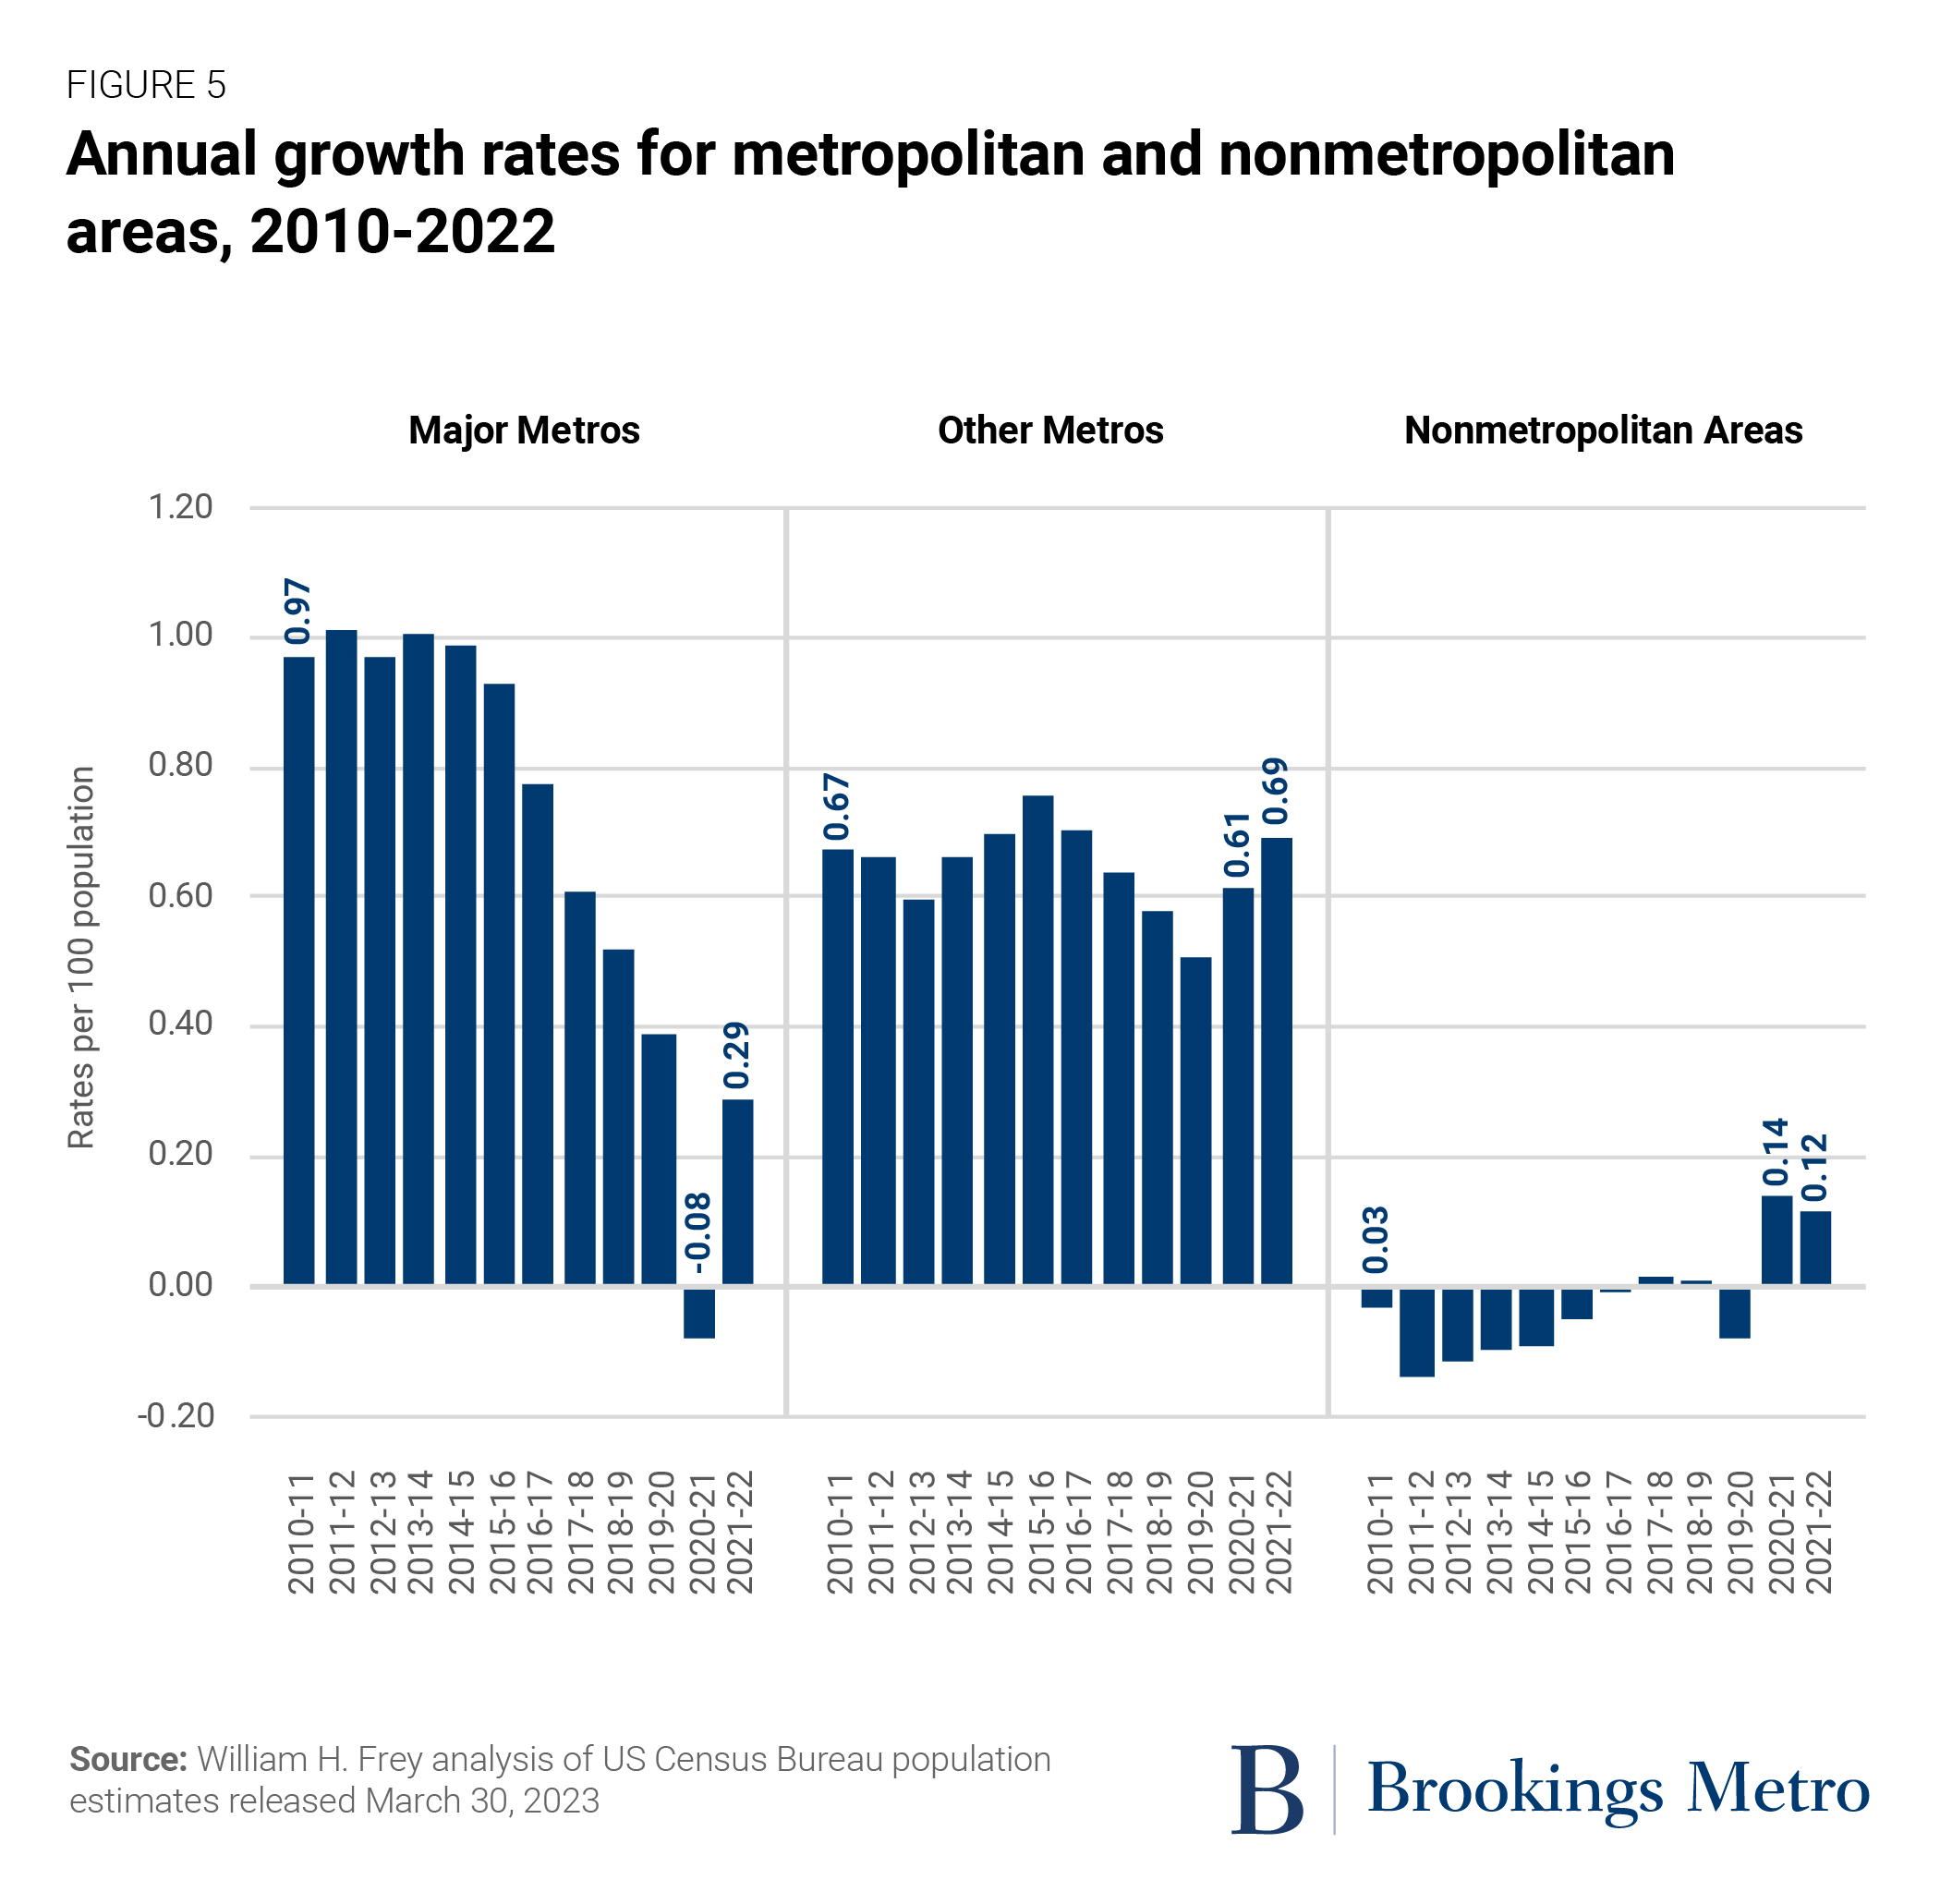
As with the case for urban core counties, major metro areas, as a group, experienced decreasing population gains over the course of the 2010s as the Great Recession eased and the national population began to disperse. However, unlike urban cores, major metro areas did not experience absolute population losses except for the 2020-21 peak pandemic period—the first year since at least 1990 when this occurred.
The new census data shows an overall reversal of major metro areas’ population declines, as the growth rate jumped from -.08% in 2020-21 to 0.29% in 2021-22. Smaller metro areas, which showed a growth uptick in 2020-21, grew even more in 2021-22. And nonmetropolitan areas, which experienced an unusual growth uptick in 2020-21, saw smaller but still positive growth in 2021-22.
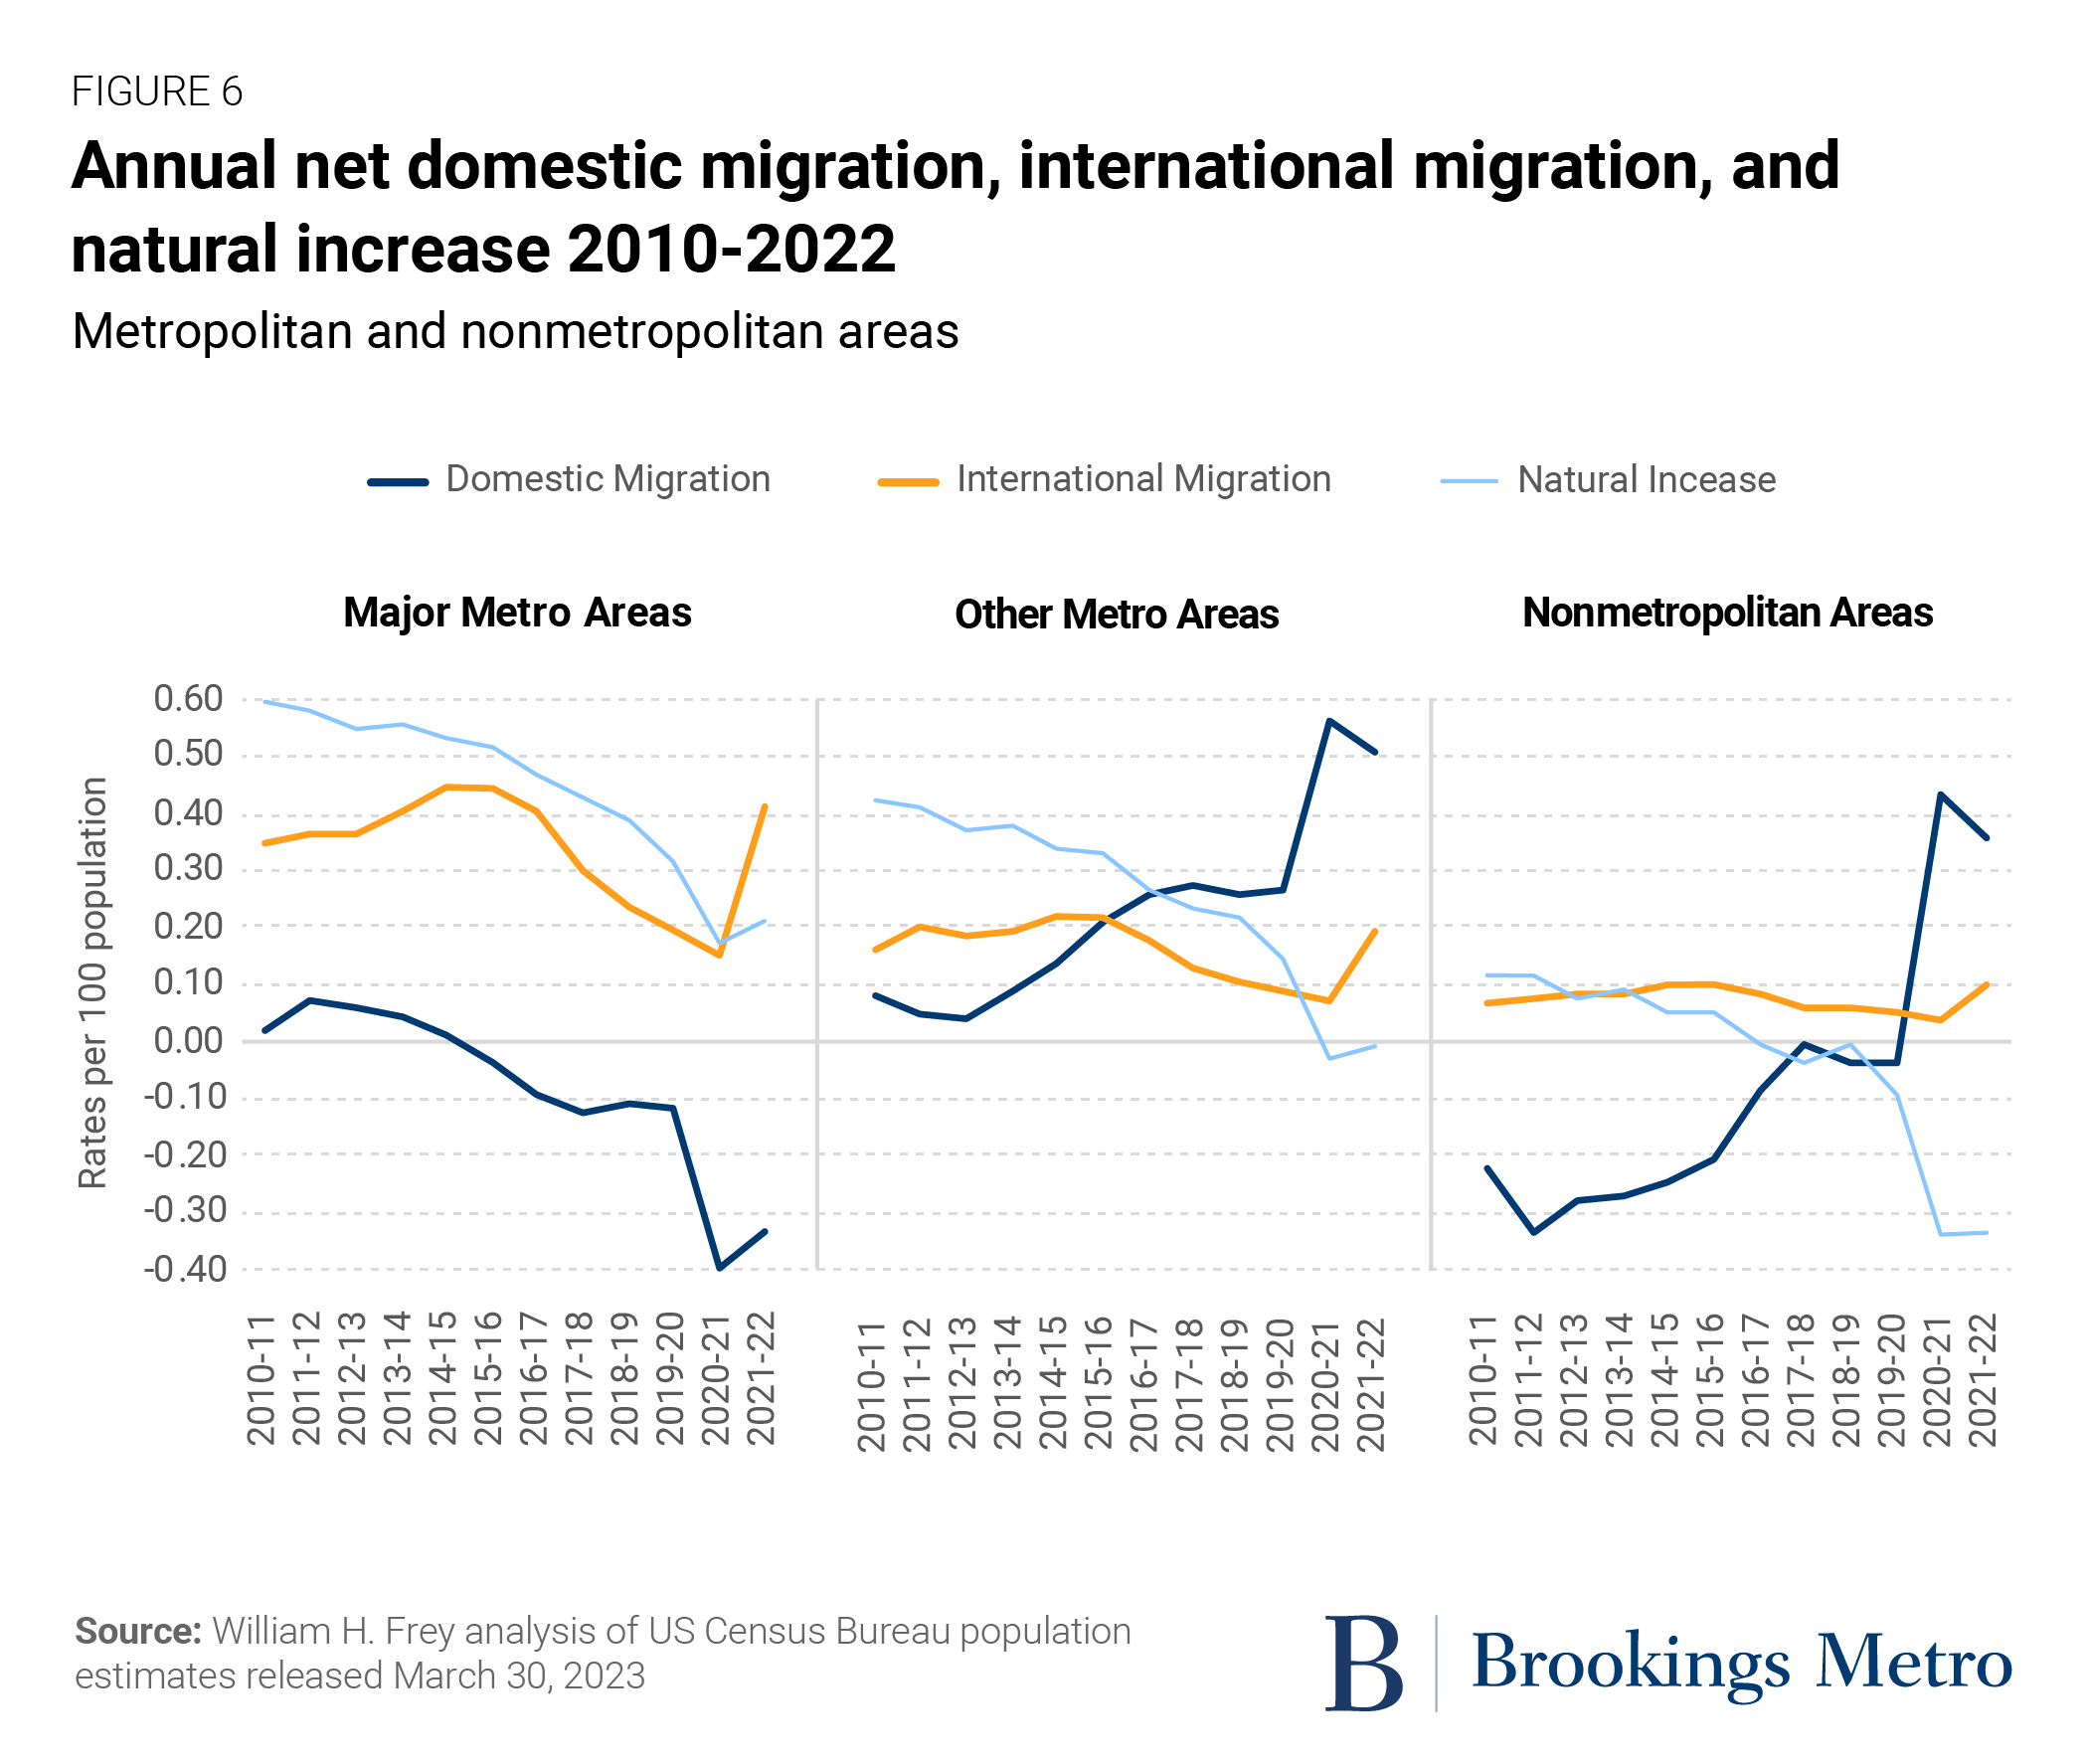
The demographic components of change underlying these patterns highlight the different and significant contributions of both domestic and international migration. The latter has much to do with major metro areas’ rebound, as the rate of international migration to these areas increased from 0.15% to 0.41%. At the same time, these areas’ sharp domestic out-migration of -0.40% in 2020-21 moderated somewhat to -0.34% in 2021-22. There was also a modest gain in natural increase.
Smaller metropolitan areas and nonmetropolitan areas showed small declines in their still-high domestic in-migration levels in 2021-22. In smaller metro areas, this was more than made up for by a rise in international migration and a small rise in natural increase. For nonmetropolitan areas, a decline in domestic in-migration was enough to lead to an overall slowdown in these areas’ growth.
The broad patterns in major metro areas mask the different experiences of individual areas. Nonetheless, when comparing 2020-21 growth rates with 2021-22 in the 55 major metro areas examined here, fully 34 experienced a positive demographic shift (download Table C.) Of these, eight reduced their population losses, 20 increased their gains, and six shifted from losses to gains.
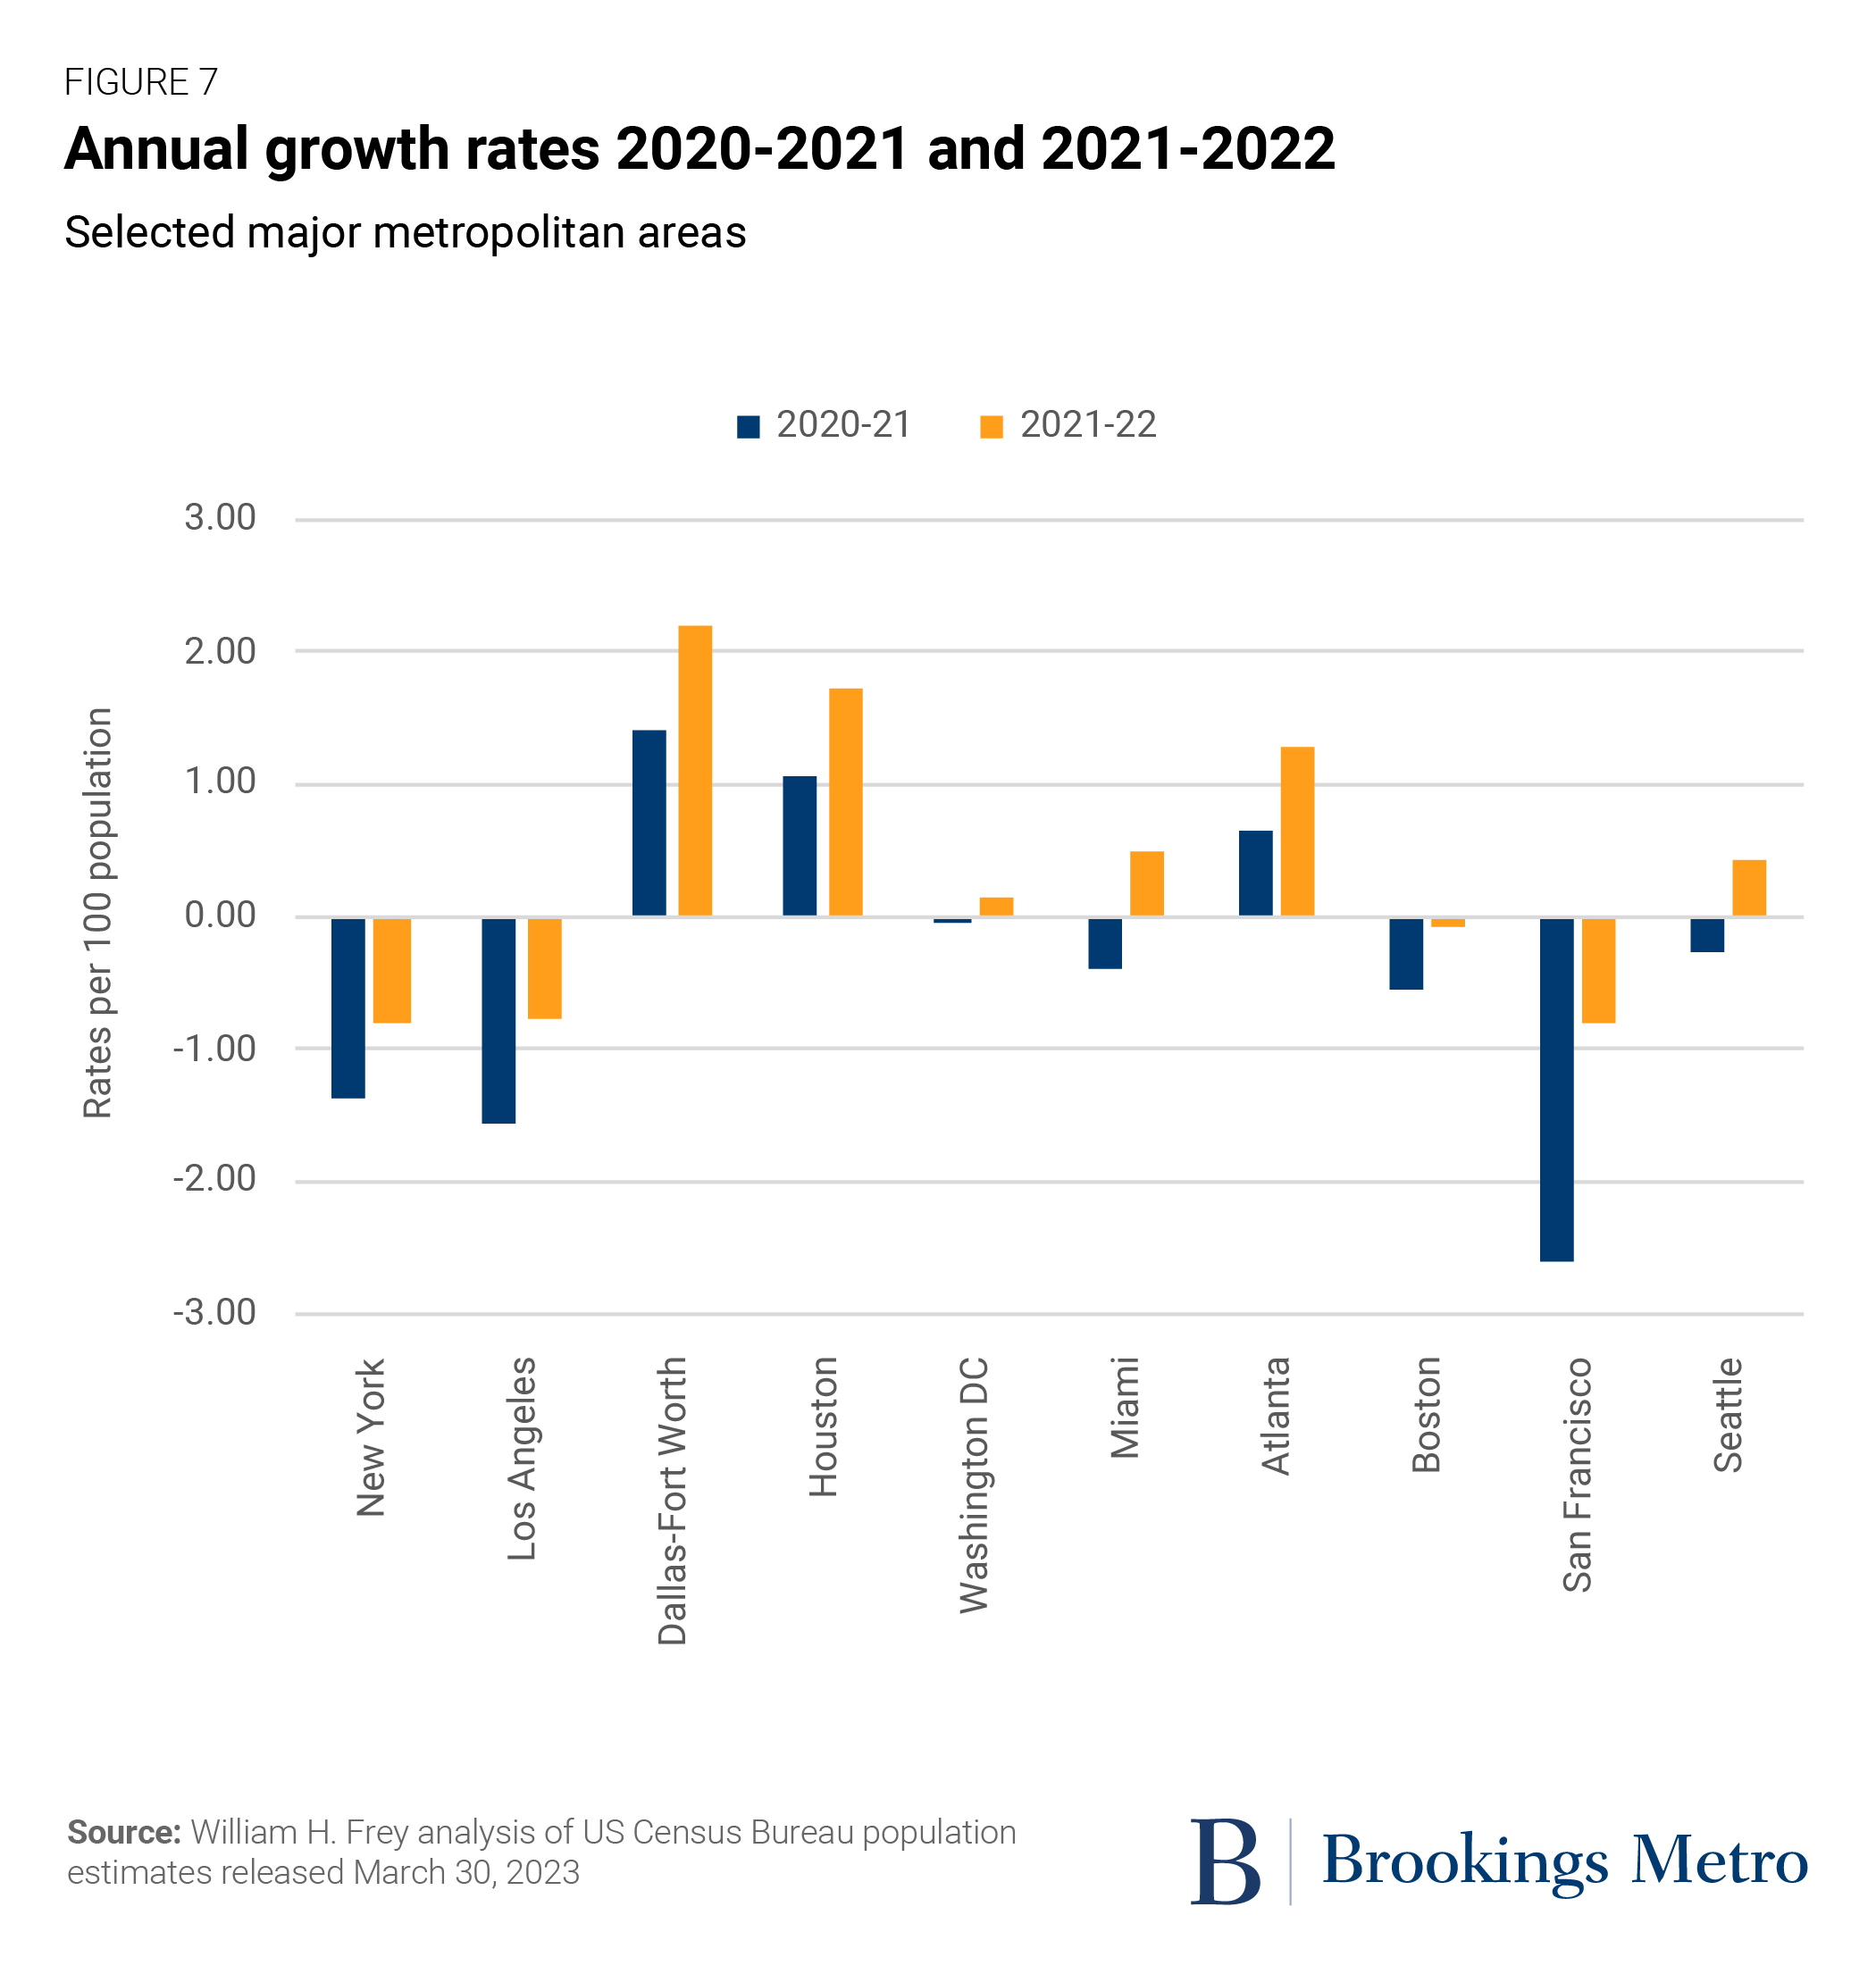
Of the 15 largest major metro areas, 11 improved their demographic circumstances—10 of which are shown in Figure 7. Key examples of smaller losses are metropolitan New York, Los Angeles, Boston, and San Francisco. Dallas-Fort Worth, Houston, and Atlanta increased their gains. And metro areas that flipped from losses to gains include Washington, D.C., Miami, and Seattle.
Among the 16 major metro areas that experienced a negative demographic shift were St. Louis, Mo. and Pittsburgh (which lost more people in 2021-22 than in 2020-21), Riverside, Calif. (which gained fewer people), and Philadelphia and Baltimore (which shifted from population gains to losses).
Still, there is a positive sign at the growth extremes of these major metro areas. Of the 10 metro areas that experienced the largest absolute population gains in 2021-22 (Dallas-Fort Worth; Houston; Atlanta; Phoenix; Orlando, Fla.; Austin, Texas; Tampa, Fla.; San Antonio; Charlotte, N.C.; and Nashville, Tenn.), only one (Phoenix) exhibited smaller gains than in the previous year. And of the four metro areas that experienced the largest absolute population losses in 2021-22 (New York, Los Angeles, Chicago, and San Francisco), each displayed smaller losses than in the previous year.
Among major metro areas that did better demographically, international and domestic migration both contributed (download Table D). Metro area Miami’s shift from population losses in 2020-21 to gains in 2021-22 came mainly from increased international migration, while metro area Atlanta’s higher gains came more from increased domestic migration. Reduced population losses in the New York and Los Angeles metro areas came from both lower domestic out-migration and greater international migration. And in metro area Dallas-Fort Worth, there were similar increases in both domestic and international migration. In 2021-22, 35 of the 55 major metro areas saw domestic out-migration, but in 14 of those, other demographic components—especially international migration—more than countered those losses. In several others, domestic out-migration was reduced from the previous year.
As a result of these dynamics, the aggregate population of major metro areas registered a gain of 538,000 in 2021-22, compared to the decline of 150,000 the previous year.
Rising international immigration trended toward large metro areas and counties
As the above discussion makes plain, increased international migration in 2021-22 had much to do with population gains in urban core and major metro areas. An earlier Census Bureau data release already reported on the rise in immigration nationally, which was brought back to levels from some earlier years. International migration hit a decades-long national low point at of just 376,000 in 2020-21 due to earlier immigration and pandemic-related restrictions, but jumped to over 1 million in 2021-22.
While all states, most counties, and most metro areas benefitted from this increase, the rise in international migration was most heavily concentrated in the largest areas (download Table E). Fully 57% of 2021-22 immigrants resided in the 20 largest metro areas (which comprise 38% of the national population), and 66% in the 100 largest counties (which comprise 42% of the population).
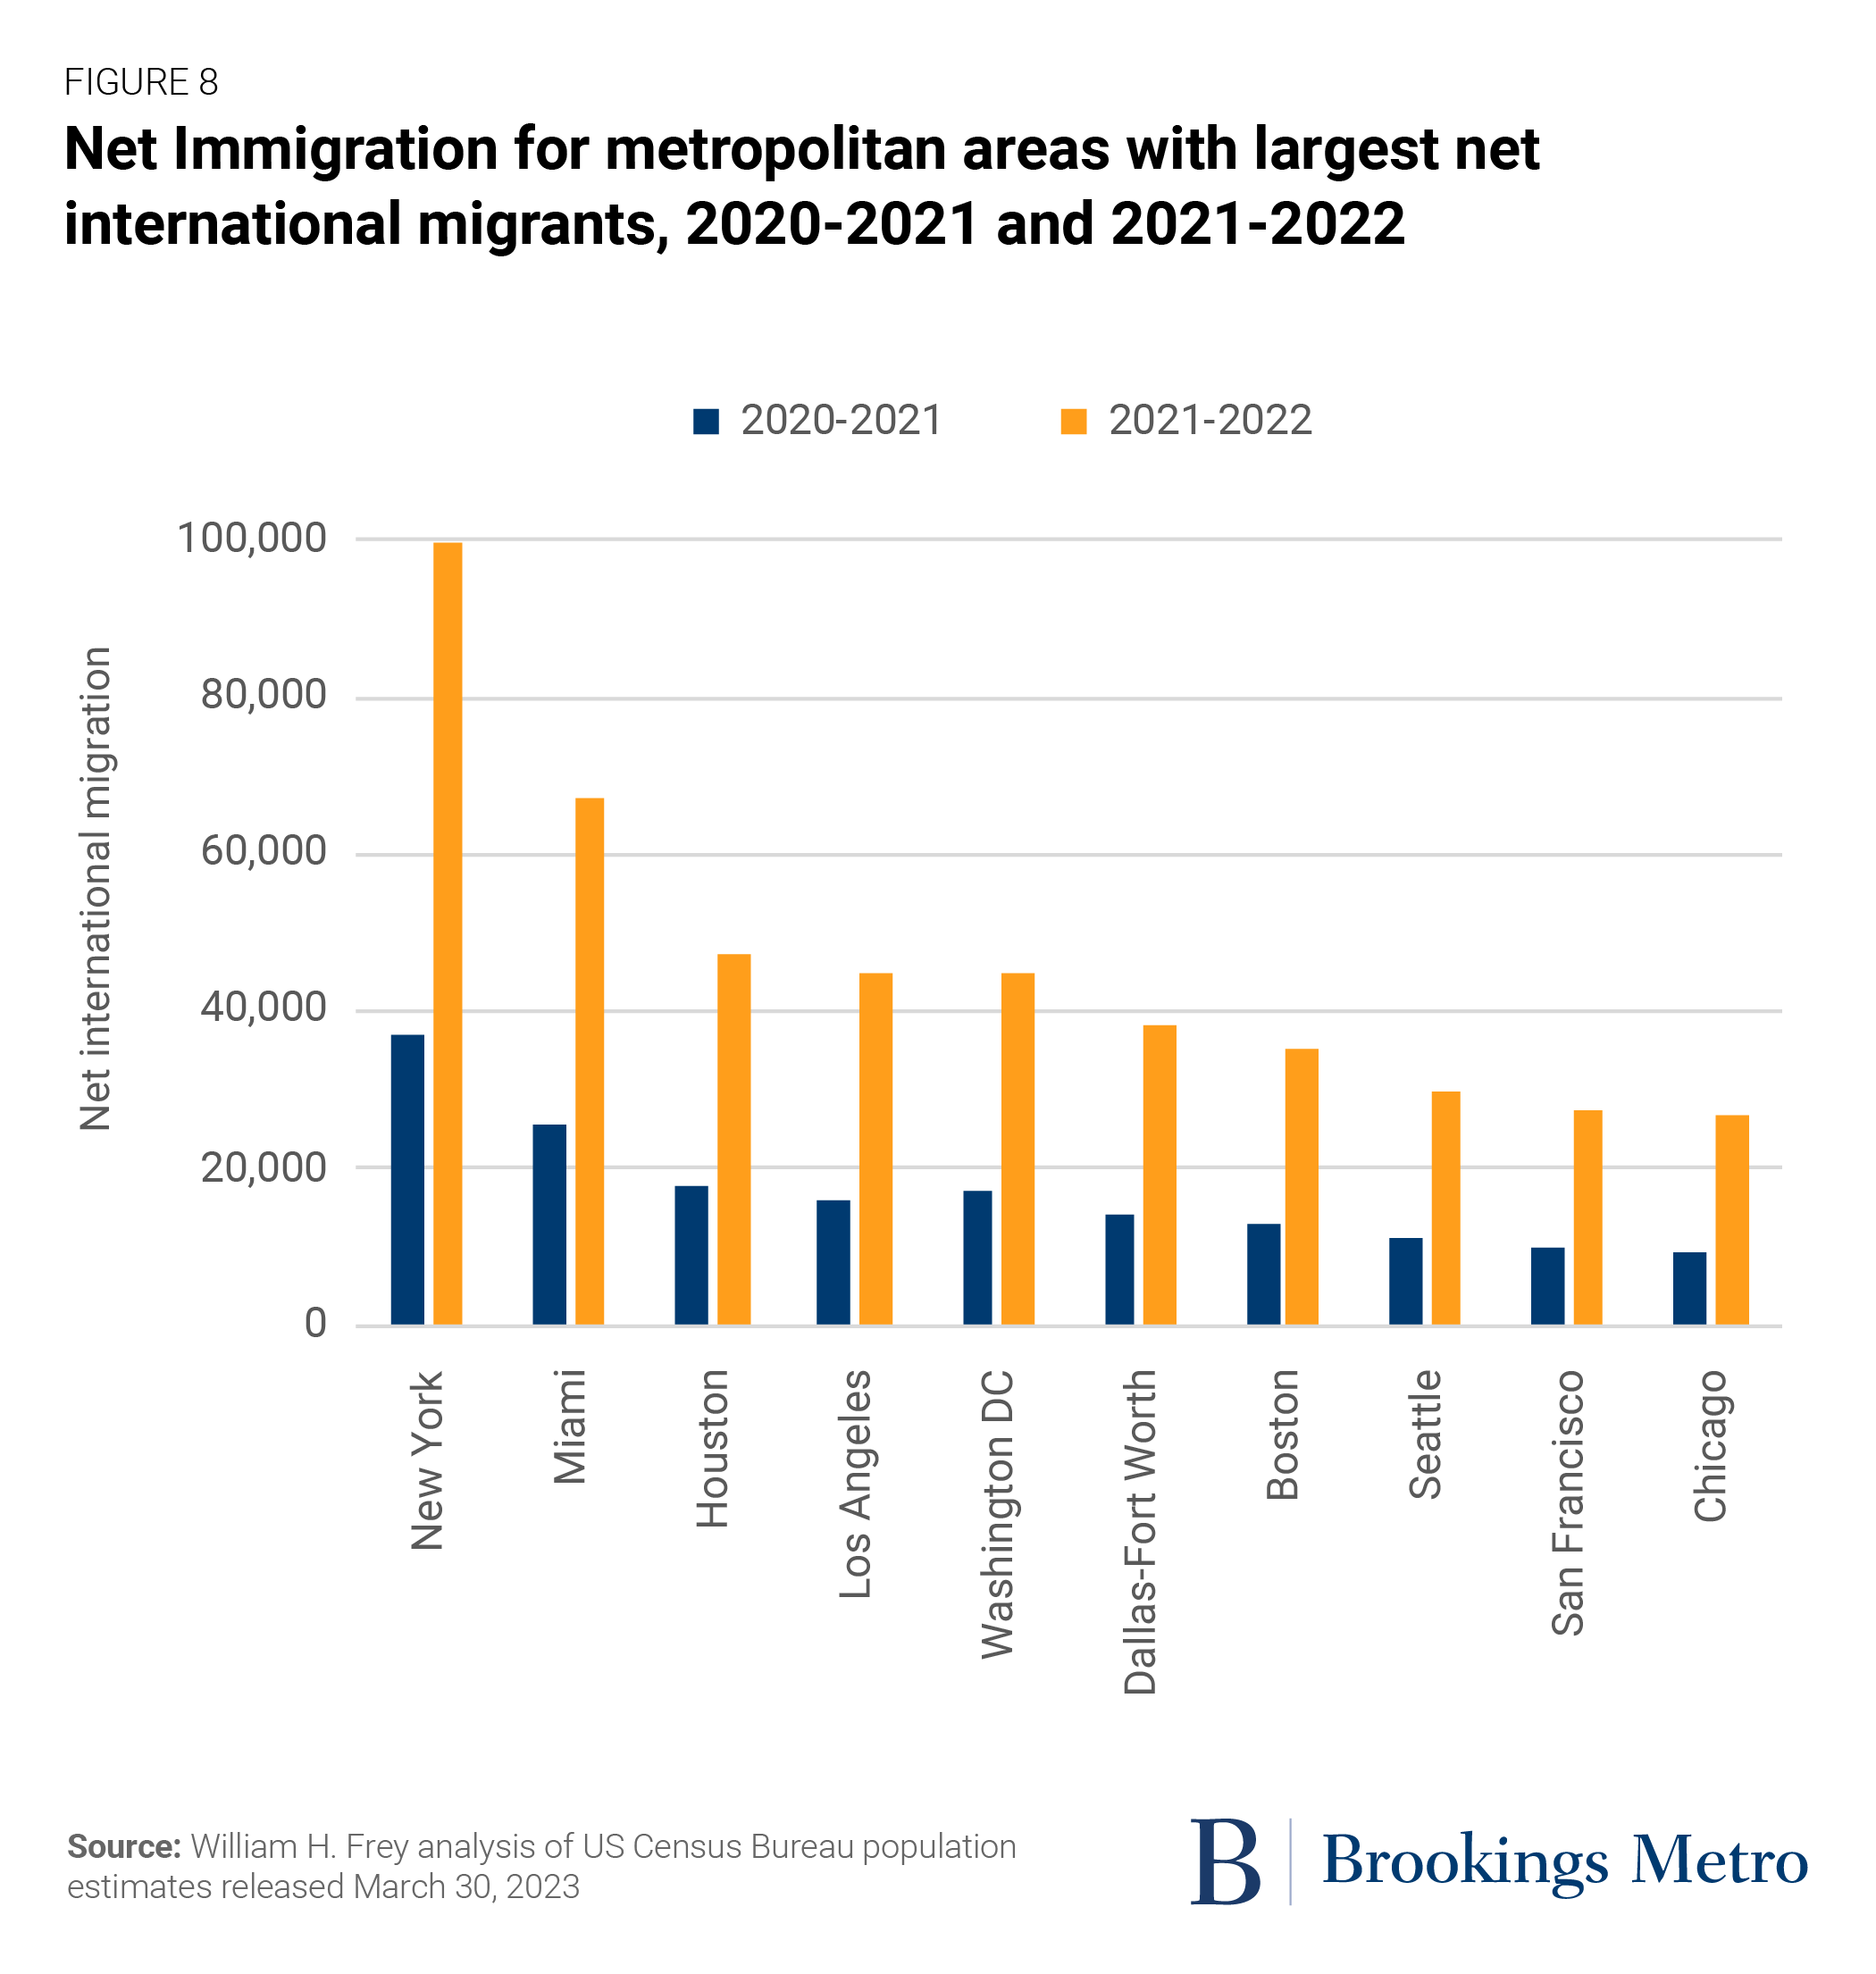
As Figure 8 shows, the metro areas gaining the greatest number of international migrants in 2021-22 also accounted for a disproportionate increase in those migrants. Metro area New York led all others with nearly 100,000 immigrants—a rise of 63,000 from the previous year. Each of the other top 10 metro areas for international migration showed gains that were two to three times their numbers from the previous year.
Related Books
A similar pattern occurred in counties, usually in the cores of urban areas. Counties that gained the highest numbers of international migrants in 2021-22 were Miami-Dade, Fla.; Harris County, Texas; Los Angeles County; King County, Wash.; Cook County, Ill.; Santa Clara County, Calif.; Dallas County; Broward County, Fla.; Queens County, N.Y.; and Maricopa County, Ariz. Each gained more than 15,000 international migrants in 2021-22—levels far higher than the year before.
There is no doubt that immigration from abroad will be a key ingredient in bolstering national growth, especially in America’s largest metropolitan areas and cities. Moreover, because immigrants and their children are younger than the native-born population, they can counter population aging and bolster the labor force population in the areas they reside in.
Understanding what’s next for large urban areas
Before this release of Census Bureau data, there was much speculation about how big cities and major metro areas would fare in the aftermath of the widespread population losses they registered during the peak pandemic period. While many speculated that growth would never return to pre-pandemic levels, these new statistics suggest there is a likelihood that cities and large metro areas will recover demographically. Compared with the previous year, most large urban core counties and major metro areas have seen reduced population losses, and in many cases, renewed gains.
The fact that these occurred during a year when pandemic-related health measures, work restrictions, and other barriers to personal interactions were still in effect suggests that the demographic shifts witnessed here may continue or become more pronounced. But much will depend on factors such as the ability of government and private sector institutions to invest in transportation, building, and technological infrastructures that allow people to live and work in highly dense urban settings. There is also the question of whether the Gen Z generation will choose to move to cities and large urban destinations, as was the case with earlier generations at their age. New research suggests that they will.
Finally and perhaps most important is the role that immigration can play in rejuvenating urban centers that were hit hard during the pandemic and for several years prior. This new data makes plain that increased immigration during 2021-22 played a key role in stemming further decline in cities and large metro areas. Immigration policy is something that the government can control and use as a tool to replenish not only the nation’s population but those of its large urban centers.
These and many other questions remain about the future of America’s urban centers, but the trends revealed in this new data suggest that a return to pre-pandemic demographic patterns can still prevail.
Related Content


Author

-
Footnotes
- This data is compiled by the Census Bureau’s population estimates program for counties: evaluation estimates for the period 2010-20 and vintage 2022 estimates for 2020-21 and 2021-22. Metropolitan and nonmetropolitan statistics represent aggregations of these counties. Because the new 2022 vintage release for Connecticut shows planning areas rather than counties, Connecticut counties are omitted from this analysis.
- Urban core areas are defined as counties where more than 95% of the population resides in urbanized areas. Inner suburb counties have between 75% and 95% of their populations residing in urbanized areas, and outer suburbs have less than 75% of their populations residing in urbanized areas.
- Because the new 2022 vintage release for Connecticut shows planning areas rather than counties, it is not possible to compile metropolitan areas and nonmetropolitan areas in Connecticut consistent with current definitions. As a result, the following Connecticut metropolitan areas and nonmetropolitan areas are omitted from this analysis: Hartford (2020 population of 1,213,531), Bridgeport (957,419), New Haven (864,835), Norwich (268,55), the Windham County portion of the Worcester, Mass. metro area (116,418), and the nonmetropolitan county of Litchfield (185,186).
The Brookings Institution is committed to quality, independence, and impact.
We are supported by a diverse array of funders. In line with our values and policies, each Brookings publication represents the sole views of its author(s).