Editor’s note: Ron Haskins delivered the following testimony before the Committee on Homeland Security and Governmental Affairs on June 22, 2016.
Chairman Johnson, Ranking Member Carper, and Members of the Committee:
Thanks for inviting me to testify at this hearing on renewing communities, reducing poverty, and increasing economic mobility. I consider it a privilege to testify before a Senate Committee, especially a committee holding a hearing on such an important topic.
I have been asked to provide background information on federal spending on poverty programs, on trends in poverty and economic mobility and the effectiveness of these programs in relieving poverty, the role of local communities in fighting poverty and creating economic opportunity, and the role of the evidence-based policy movement in strengthening programs to fight poverty and increase economic opportunity.
Federal Spending
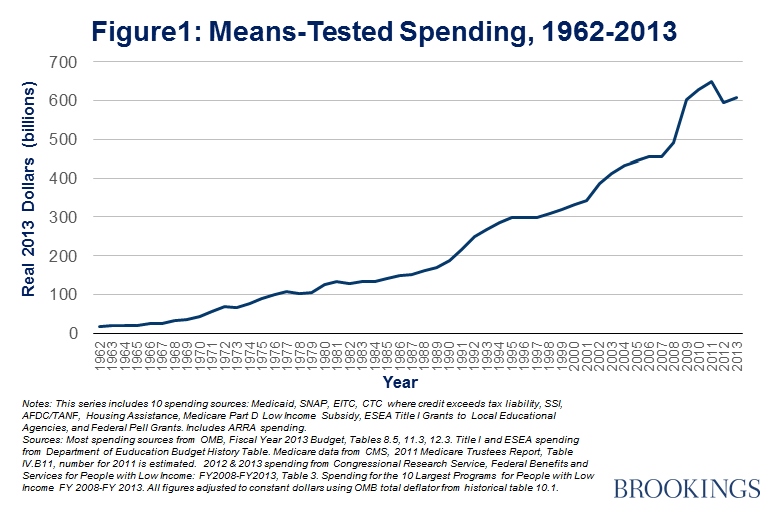
Figure 1, based on spending data from the Office of Management and Budget, traces federal spending on the ten largest means-tested programs between 1962 and 2013 in dollars adjusted for inflation. These ten programs capture about 80 percent of spending on all means-tested programs. Sometimes the word “welfare” is applied to these programs because in order to qualify for the benefit, recipients must have earnings and resources below a specified level which varies substantially from program to program. After more than half a century of steady growth, spending on these programs has slowed in recent years, in part because most of the additional spending on means-tested programs enacted as part of the American Recovery and Reinvestment Act of 2009 to fight the Great Recession has ended. Over the entire period from 1962 to 2013, spending grew from around $17.5 billion to $608.8 billion.
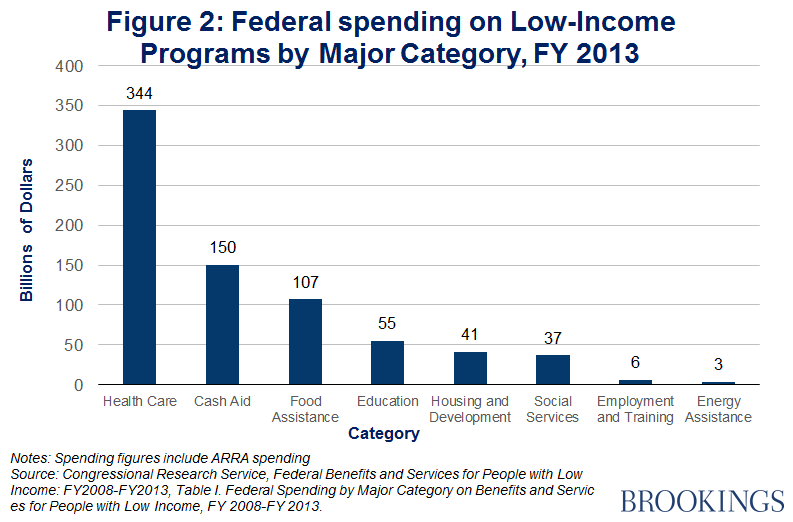
Figure 2, compiled by the Congressional Research Service, shows means-tested spending in 2013 divided into eight categories of programs defined by their major purpose. The categories are health care, cash, nutrition, education, housing and development, social services, employment and training, and energy. The spending in Figure 2 is for all means-tested programs, not just the ten largest. Perhaps the most important point illustrated by the figure is the extent to which means-tested spending is dominated by health care. In 2013, health services for poor and low-income individuals cost $344.0 billion or 46 percent of total spending of $743.7 billion on means-tested programs. It is worth emphasizing that this $344 billion does not include Medicare spending. Spending on cash benefits was also substantial, at $150.3 billion, but still only about 45 percent as much as spending on health.
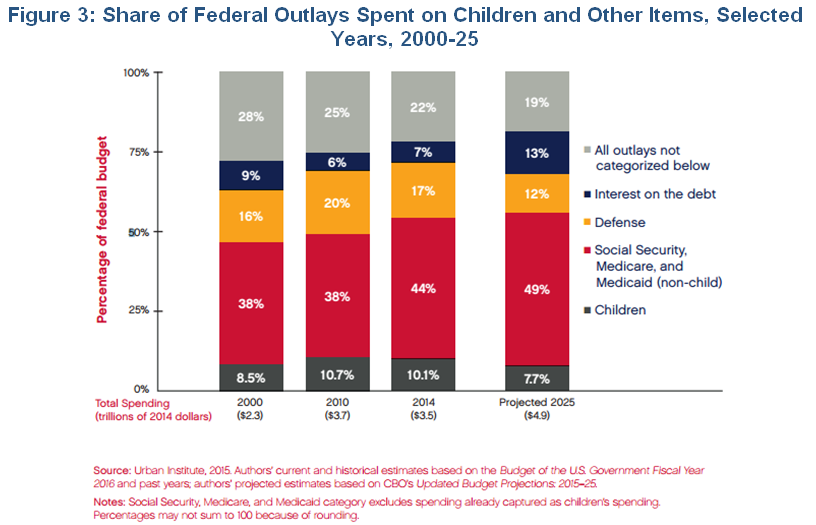
It would be misleading to talk about federal spending on means-tested programs without pointing out how federal spending programs are being squeezed by the rise in the share of federal outlays going to the Big Three entitlement programs: Social Security, Medicare, and Medicaid. Figure 3, based on superb work conducted by a team of researchers at the Urban Institute, shows total federal spending for selected years since 2000 as well as projected spending in 2025. The bar graphs represent federal spending in selected years; the sections within each bar graph divide spending into six non-overlapping categories: all spending on children, most of it on means-tested programs; the Big Three entitlements combined; defense; interest on the debt; and a catch-all category that captures all other outlays. I emphasize two stark conclusions from Figure 3. First, the rise of spending on the Big Three is relentless. In 2000, 38 percent of federal spending went to the Big Three; by 2014, just 14 years later, 44 percent was devoted to them, an increase of about 15 percent in the proportion of federal spending devoted to the Big Three. Second, given that federal revenue has been fairly stable at around 17 percent or 18 percent of GDP in non-recessionary years, the increase in Big Three spending means there is enormous pressure to reduce other spending. Thus, it is no surprise that if projections to 2025 are correct, spending on the categories of defense, children, and all other outlays will decline as a share of federal spending while spending on the Big Three and on interest will increase substantially. Thus, the rapid rise of spending on means-tested programs, including those that support children, that we see in Figure 1 has already come to an end and is likely to moderate or even shrink in the years ahead. It is difficult to believe that spending more on the elderly and less on children will be good for the nation’s future prospects.
Poverty and Economic Mobility
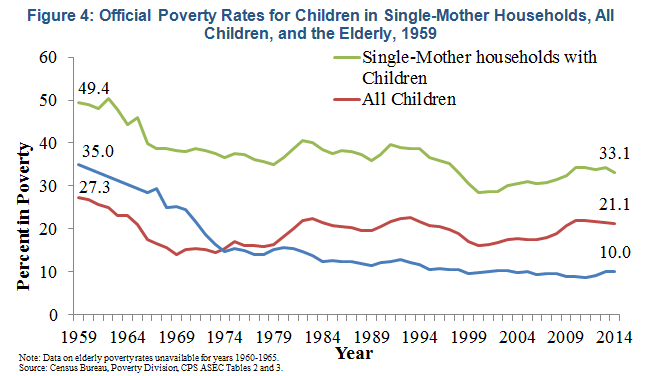
A question that arises when contemplating this federal spending, especially the portions devoted to means-tested programs and children, is whether the spending has an impact on poverty. One view on this issue is shown in Figure 4 which presents poverty rates under the official federal poverty measure among all children, among single-mother households with children, and among the elderly. Single-mother households are especially important in understanding poverty because the poverty rate among these households is about five times the poverty rate among married-couple households. Another reason for emphasizing mother-headed households is that the share of all children living in married-couple households has been declining for four decades while the share living in mother-headed households has been increasing, which has the effect of continually putting upward pressure on the share of children in poverty.
Figure 4 yields three interesting generalizations about poverty trends: the nation continues to make good progress in reducing poverty among the elderly; the poverty rate among children is more than twice the poverty rate among the elderly; and the poverty rate among mother-headed households, despite substantial progress during the 1990s, was and continues to be much higher than the rate for other groups.
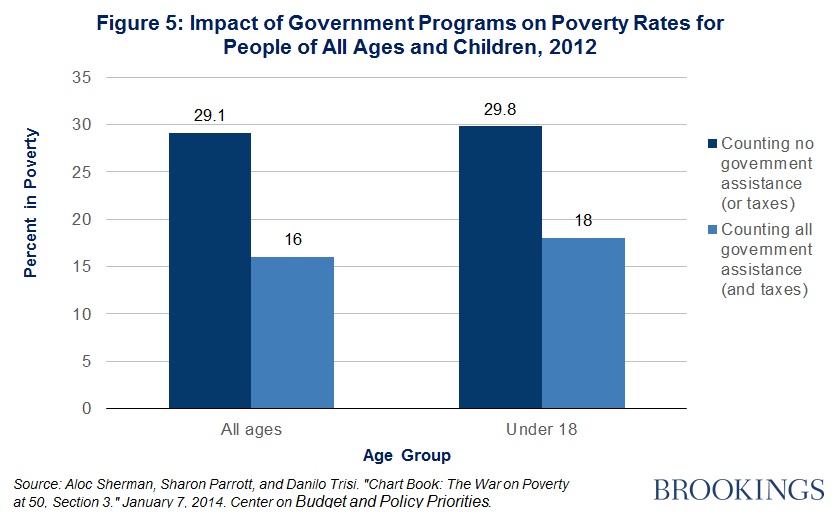
No poverty measure is perfect, but the official federal measure is flawed by the fact that most benefits provided by government, including most cash and in-kind benefits and all benefits provided through the tax code shown in Figure 1, are ignored. If the members of this Committee wish to understand the impact of government spending on poverty, we must include the government benefits as income. The Center on Budget and Policy Priorities has produced a chart showing the dramatic reduction in poverty among both children and people of all ages when these benefits are including as income (Figure 5). For people of all ages, counting all government benefits as income reduces poverty from 29.1 percent to 16.0 percent, a reduction of 45 percent. In the case of children, the reduction is from 29.8 percent to 18 percent, a reduction of 40 percent. Clearly, government benefits reduce poverty a lot more than implied by the official poverty measure.
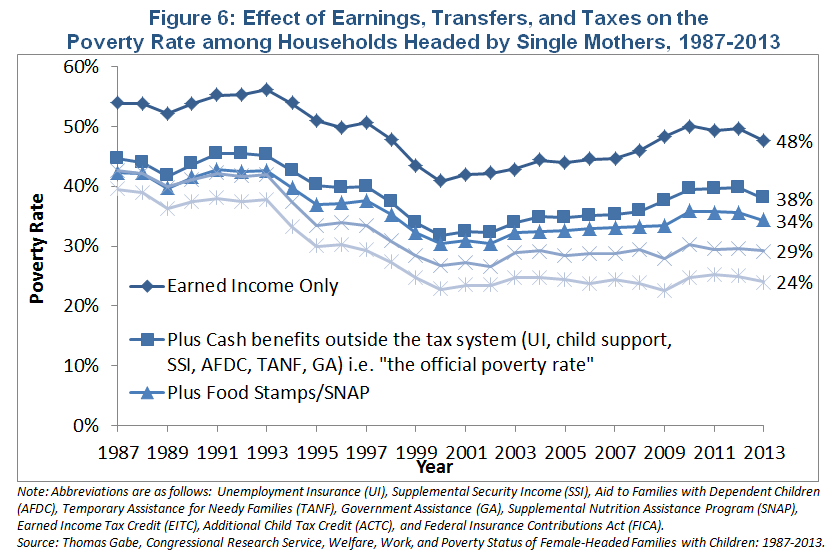
Figure 6, taken from a study by the nonpartisan Congressional Research Service, captures an even more interesting and important feature of the system of benefits provided by government. By the time Congress and President Clinton enacted welfare reform in 1996, Congress has already created a set of programs that provided generous benefits to low-income working families with children. The most important of these work support programs are the Earned Income Tax Credit (EITC), food stamps, and funds for child care (including Head Start). Since 1996, several of these programs have been expanded and an important new program – the Additional Child Tax Credit – has been created. The effect of these programs taken together is to increase the incentive to work and to greatly increase the income and reduce the poverty rate of low-income working families.
The Biblical injunction that the poor with always be with us may be correct, but no one has yet specified the share of a given population that will be poor. Figure 6 shows the impacts of federal benefits and the work support system in reducing poverty among single-mother families. The benefits are added in stepwise fashion so that we can trace the impact of the various programs and combinations of programs on the poverty rate. The most important point of the figure is that federal benefits greatly reduce the poverty rate among mother-headed families; in 2013, for example, they reduced the poverty rate by half, from 48 percent to 24 percent. Another interesting point from the figure is that the system became even more effective in reducing poverty after the mid-1990s and the passage of welfare reform. The likely reason for this improved effectiveness of government programs in reducing poverty is that more and more single mothers worked and earned money that, when combined with government benefits, allowed the mothers and their children to escape poverty. Perhaps the most important feature of the current system of work requirements in welfare and the nation’s generous work support system is that year-after-year this system is effective in reducing poverty. In most years, the benefits reduce poverty by around half, almost certainly making the combination of work requirements to encourage low-income single mothers to work and the benefits provided by the work support system the most effective anti-poverty strategy for able-bodied adults the nation has achieved.
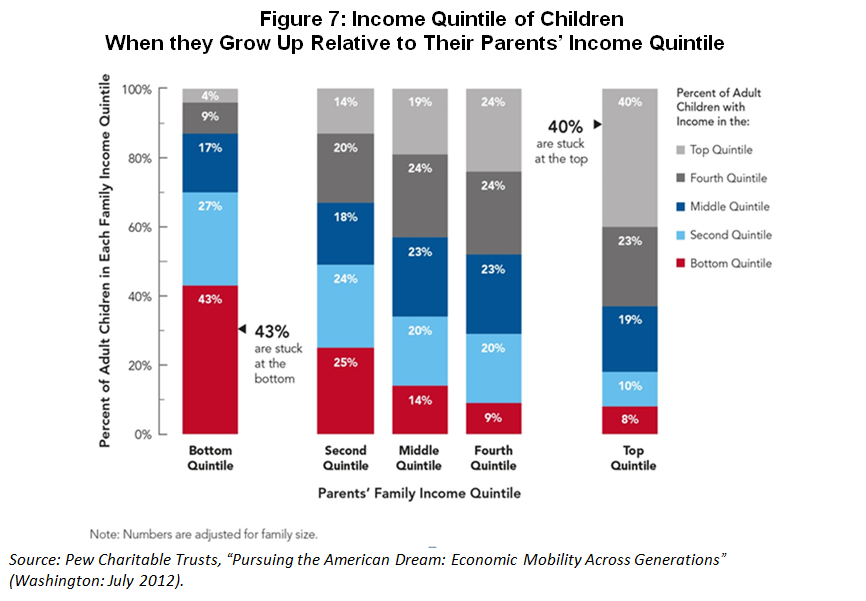
Despite the nation’s progress against poverty, a more fundamental criterion for evaluating the success of our social programs and our educational system is whether kids from poor families have an equal chance of getting ahead. In 1931, the American writer James Truslow Adams said that the American Dream meant that “life should be better and richer and fuller for everyone, with opportunity for each according to ability or achievement.” But as a nation we are very far from providing equality of opportunity. Figure 7 shows the relationship between the family income of children when they grow up and that of their parents. Reading from left to right, the first bar graph shows how children from parents in the lowest fifth of income (below about $21,000 in today’s dollars) fared as adults; the bar graph on the far right shows how children from parents in the highest fifth of income (above about $112,000 or more); the other bar graphs show the middle three fifths respectively. [1] For example, the bar graph on the left shows that 43 percent of adult children from parents in the bottom fifth themselves wind up in the bottom fifth but only 4 percent wind up in the top fifth. If America presented equal economic opportunity for all children regardless of their parents’ income, both figures would be close to 20 percent. Clearly, the income of parents has a dramatic impact on the income of their children – the precise opposite of equality of economic opportunity. This lack of economic opportunity for kids from poor families has not changed in several decades. [2]
Role of Communities
It makes great sense for the Committee to focus attention on the role of local communities in fighting poverty and increasing economic mobility. Bob Woodson, a witness in today’s hearing, is one of the most experienced and distinguished voices in mobilizing local communities to develop and implement their own solutions to poverty and lousy economic mobility. Bob’s career has been based on the assumption that local communities know more about how to solve their problems than people from outside their communities. Listening to Bob will make all of us wiser about how to work with local communities.
The well-known Stanford scholar Raj Chetty and his colleagues have used earnings data from tax records to study the variability in economic mobility across communities in the U.S. [3] Chetty and his colleagues found major differences across communities in the rate at which poor children moved up the economic ladder. In addition, the research team found several factors that are correlated with higher economic opportunity across areas. One of the major predictors of greater mobility was the share of families in the respective communities that are married-couple families. Another was low levels of racial and income segregation.
An important conclusion the Committee could draw from the Chetty et al. results is that rather than trying to characterize the opportunity for economic advancement for American children as a whole, it makes more sense to focus attention on the large differences in economic mobility across communities. The factors associated with greater or lesser mobility offer a way to start thinking about changes that might improve mobility. We may be one nation, but conditions vary greatly from community to community and the solutions to poverty and low mobility are likely to need tailoring to local conditions. Chetty and his coauthors make clear in their reports that the correlations they find between community characteristics and mobility are not causal. Even so, these correlations may provide valuable insights for people trying to figure out community changes that might have at least some chance of improving poverty and mobility.
The Chetty et al. study received a great deal of media attention, which included their identification of the ten communities with the lowest rate of movement from the bottom fifth of income to the top fifth. Communities that were near the bottom on this measure included Charlotte, North Caroline and Cincinnati, Ohio. Members of this Committee might find it interesting to learn that both of these communities with low economic mobility have formed citizen groups composed of a broad representation of leaders from education, business, elected officials, and nonprofit organizations that focus on helping low-income individuals and families. Tip O’Neil used to say that all politics is local. That may or may not be true, but policy implementation is always primarily local. Thus, to have the nation’s communities focused on how to reduce poverty and increase economic mobility is an exceptionally useful thing. There is good reason to think that solutions developed by local communities such as Charlotte and Cincinnati will be more effective than national or even state solutions rigidly imposed from outside the community. [4] [5]
One concrete federal proposal the Congress could consider is the proposal to give communities more control over federal dollars so they could use federal resources in a manner best suited to solve local problems. On an abstract level, this is a worthy proposal. However, many Democrats have expressed concern that states and localities given flexibility might use the money for purposes not anticipated by the elected federal officials who designed our current poverty programs and attached spending stipulations. The misuse of federal resources by state and local officials has been one of the most frequent criticisms of the Temporary Assistance for Needy Families block grant, the main component of the 1996 welfare reform law that is now – in its 20th anniversary year – receiving a great deal of attention.
I think we face a policy situation in which both sides make a strong case. A possible compromise Congress could consider would be to allow for broad waivers in programs such as Food Stamps, housing, and Medicaid. These waivers would permit states and localities to try new uses of the federal resources if they can present strong proposals showing there is reason to believe their use of the money could achieve the objectives of the original programs but do so in a way that is better suited to state and local traditions, ideas, and resources.
Evidence-Based Policymaking
The final topic I have been asked to discuss is evidence-based policymaking. As signaled by the bipartisan passage of the Ryan-Murray Evidence-Based Policymaking Commission, over the last three or four years a bipartisan agreement that evidence can improve social programs has emerged. I regard this agreement as one of the most important developments in social policy in recent decades. There are at least three reasons the time is propitious for a major effort to base the nation’s federal, state, and local policy on evidence.
First, we now have scores of social intervention programs with rigorous evidence of success. These successful programs are spread across every area of social policy including promoting school readiness, increasing high school graduation rates, using employment and training to help young people qualify for better jobs, reducing poverty, avoiding unwed births, helping parents improve their child reading skills, reducing or mitigating the effects of child abuse and neglect, and many others. If federal grant programs can spend most of their funds on evidence-based model programs, we would make much greater progress against the nation’s social programs, especially now that we have many effective programs and the number of such programs is increasing every year.
Second, as suggested by the creation of the Evidence-Based Policymaking Commission by Congress, there are major recent developments in use of existing data sets for policy analysis. These developments include use of state and city data sets, data sets maintained by universities and private agencies, and of course data sets maintained by federal agencies. These various data sets contain a huge amount of information that could be used to improve the understanding of social problems and even to test the efficacy of previous policies. Many analysts believe that random-assignment designs are the gold standard of program evaluation. Because many of the city, state, and federal data sets have data on an entire universe of particular groups of people (such as K-12 students, prisoners, college students, taxpayers, recipients of public benefits, and so forth), often over a period of years, data from these data sets can serve as outcome measures to test the efficacy of programs that address people whose data are in these data sets. In addition, the Evidence-Based Commission is charged with examining the data sets now maintained by the Census Bureau, as well as the data sets maintained by other federal agencies, to determine ways of improving coordination of these data sets and improving access by researchers while maintaining the privacy of individuals. It is entirely possible that within the next decade we could see whole new vistas of policy analysis opened by the use of these existing data sets. The study based on tax return data by Raj Chetty and his colleagues referred to above provides a small taste of the types of sweeping analyses that will be possible in the near future. [6]
Third, even now there are more and more local social intervention programs, often supported by federal and state dollars supplemented by private sector funds, that are being carefully implemented and evaluated. Over the next several years, due to the growing ability of program operators at the local level to employ high-quality evaluations to find out if their programs work and then to use the results of the evaluations to improve their programs, it is reasonable to expect that we will have a growing number of effective social programs to attack leading social problems. Consider the examples of the Teen Pregnancy Prevention (TPP) program and the Maternal, Infant, and Early Childhood Home Visiting Program (MIECHV) created by federal legislation in 2009. Based on thorough reviews of the literature, conducted by the Department of Health and Human Services and the Mathematica Policy Research company, in 2010 HHS concluded that there were 28 TPP programs and 7 home visiting model programs that met the HHS criteria for high-quality evidence showing that the programs produced significant impacts on important measures of teen sexual activity or teen pregnancy for the TPP program and maternal behavior or child outcome for the MIECHV program. By 2016, the literature reviews revealed that 44 programs (not just 28) now meet the TPP criteria and 19 home visiting programs (not just 7) meet the criteria. Although perhaps not increasing as dramatically as evidence-based teen pregnancy and home visiting programs capable of producing substantial impacts on the problem they were designed to address, there are now a constant stream of programs being shown by rigorous evidence to produce impacts in reducing social problems.
Conclusion
If Congress can ensure the continuation of adequate funds for social programs and find the proper balance between the control of social spending at the local, state, and federal levels, the modest success fighting poverty and increasing economic mobility the nation has achieved is likely to increase substantially because of the expanding capacity of evidence-based policy to improve the nation’s social programs.
The views expressed in this statement are my own and do not necessarily reflect those of staff members, officers, or trustees of the Brookings Institution.
[1] The figures come from Table H-1. Income Limits for Each Fifth and Top 5 Percent of All Households: 1967 to 2013. Available at https://www.census.gov/data/tables/time-series/demo/income-poverty/historical-income-households.html.
[2] Haskins & Sawhill, Creating an Opportunity Society
[3] Chetty et al., “Where Is the Land of Opportunity: The Geography of Intergenerational Mobility in the U.S.”
[4] Foundation for the Carolinas Raises 1 Billion in the Past Two years,” March 23, 2016, The Charlotte Observer. Available at: http://www.charlotteobserver.com/news/local/article67856097.html#1
[5] “Exclusive: United way Unveils 100 Million Plan to Reduce Poverty,” March 6, 2015, WCPO Cincinnati. Available at: http://www.wcpo.com/lifestyle/united-way-unveils-100-million-plan-to-reduce-poverty-get-tristate-moving-in-right-direction
[6] For an excellent overview of these possibilities, see Julia Lane, 2016, “Big Data for Public Policy: The Quadruple Helix,” Journal of Policy Analysis and Management 35(3): 708-715; &722-724; and Ron S. Jarmin & Amy B. O’Hara, 2016, “Big Data and the Transformation of Public Policy Analysis,” Journal of Policy Analysis and Management 35(3): 715-721; & 725-727.
The Brookings Institution is committed to quality, independence, and impact.
We are supported by a diverse array of funders. In line with our values and policies, each Brookings publication represents the sole views of its author(s).


Commentary
TestimonyRenewing communities and providing opportunities through innovative solutions to poverty
June 22, 2016