The Great Recession may have ended in 2009, but despite the subsequent jobs rebound and declining unemployment rate, the number of people living below the federal poverty line in the United States remains stuck at recession-era record levels.
The rapid growth of the nation’s poor population during the 2000s also coincided with significant shifts in the geography of American poverty. Poverty spread beyond its historic urban and rural locales, rising rapidly in smaller metropolitan areas and making the nation’s suburbs home to the largest and fastest-growing poor population in the country. Yet, even as poverty spread to touch more people and places, it became more concentrated in distressed and disadvantaged areas.
The intersection between poverty and place matters. Poor neighborhoods come with an array of challenges that negatively affect both the people who live in those neighborhoods—whether they themselves are poor or not—as well as the larger regions in which those neighborhoods are located.1 Residents of poor neighborhoods face higher crime rates and exhibit poorer physical and mental health outcomes. They tend to go to poor-performing neighborhood schools with higher dropout rates. Their job-seeking networks tend to be weaker and they face higher levels of financial insecurity.
The many barriers imposed by living in a poor neighborhood make it that much harder for residents to move up the economic ladder, and their chances of doing soonly diminish the longer they live in such neighborhoods. Moreover, in regions where the poor are more segregated into poor places, the dampening effect on mobility extends beyond distressed neighborhoods to lower economic mobility for the region as a whole.
The concept of concentrated poverty reflects the fact that while pockets of deep neighborhood poverty can affect the well-being of all residents, they are especially troubling for poor families who already face burdens associated with their low incomes, and who may have fewer housing and neighborhood choices available to them. These challenges disproportionately fall to people of color, and, while they have long been particularly pronounced in inner cities, as poverty has spread beyond the urban core, so too has concentrated disadvantage.
Previous analyses have documented the growth and spread of concentrated poverty in the 2000s. But with the latest data from the American Community Survey, for the first time we have non-overlapping five-year estimates—from 2005-09 and 2010-14—that can be used to assess how these trends have evolved following the Great Recession.2 The 2005-09 data reflect both the duration of the downturn and three years of economic growth that preceded it, while the 2010-14 estimates capture a post-recession period characterized by an uneven recovery not widely felt.
In this analysis we use those estimates, together with data from the 2000 decennial census, to measure changes in the concentrated poverty rate—or the share of poor residents living in extremely poor neighborhoods (i.e., census tracts where 40 percent or more of the population lives below the federal poverty line).3 We also employ a broader measure of concentrated disadvantage by taking into account the share of poor residents living in high poverty neighborhoods (i.e., census tracts with poverty rates between 20 and 40 percent) over time. We present findings for the nation as a whole and for different types of communities, paying particular attention to how these trends have played out both across and within the nation’s 100 largest metropolitan areas.4
Interactive data
By 2010-14, 14 million people lived in extremely poor neighborhoods—5 million more than before the downturn and more than twice as many as in 2000.
The 2000 decennial census coincided with an economic high water mark. Together with a slate of targeted public policies, the strong economy of the late 1990s helped drive down the number of extremely poor neighborhoods—and the number of people living in such places—for the first time in decades. However, that progress turned out to be short-lived.
Not long after the 2000s began, the bursting of the dot-com bubble sent the nation into a recession, and the relatively slow job growth in the expansion that followed did little to help struggling families and communities regain lost ground. As a result, not only did the early to mid 2000s see poverty grow, but early indicators revealed the poor population was once again re-concentrating.
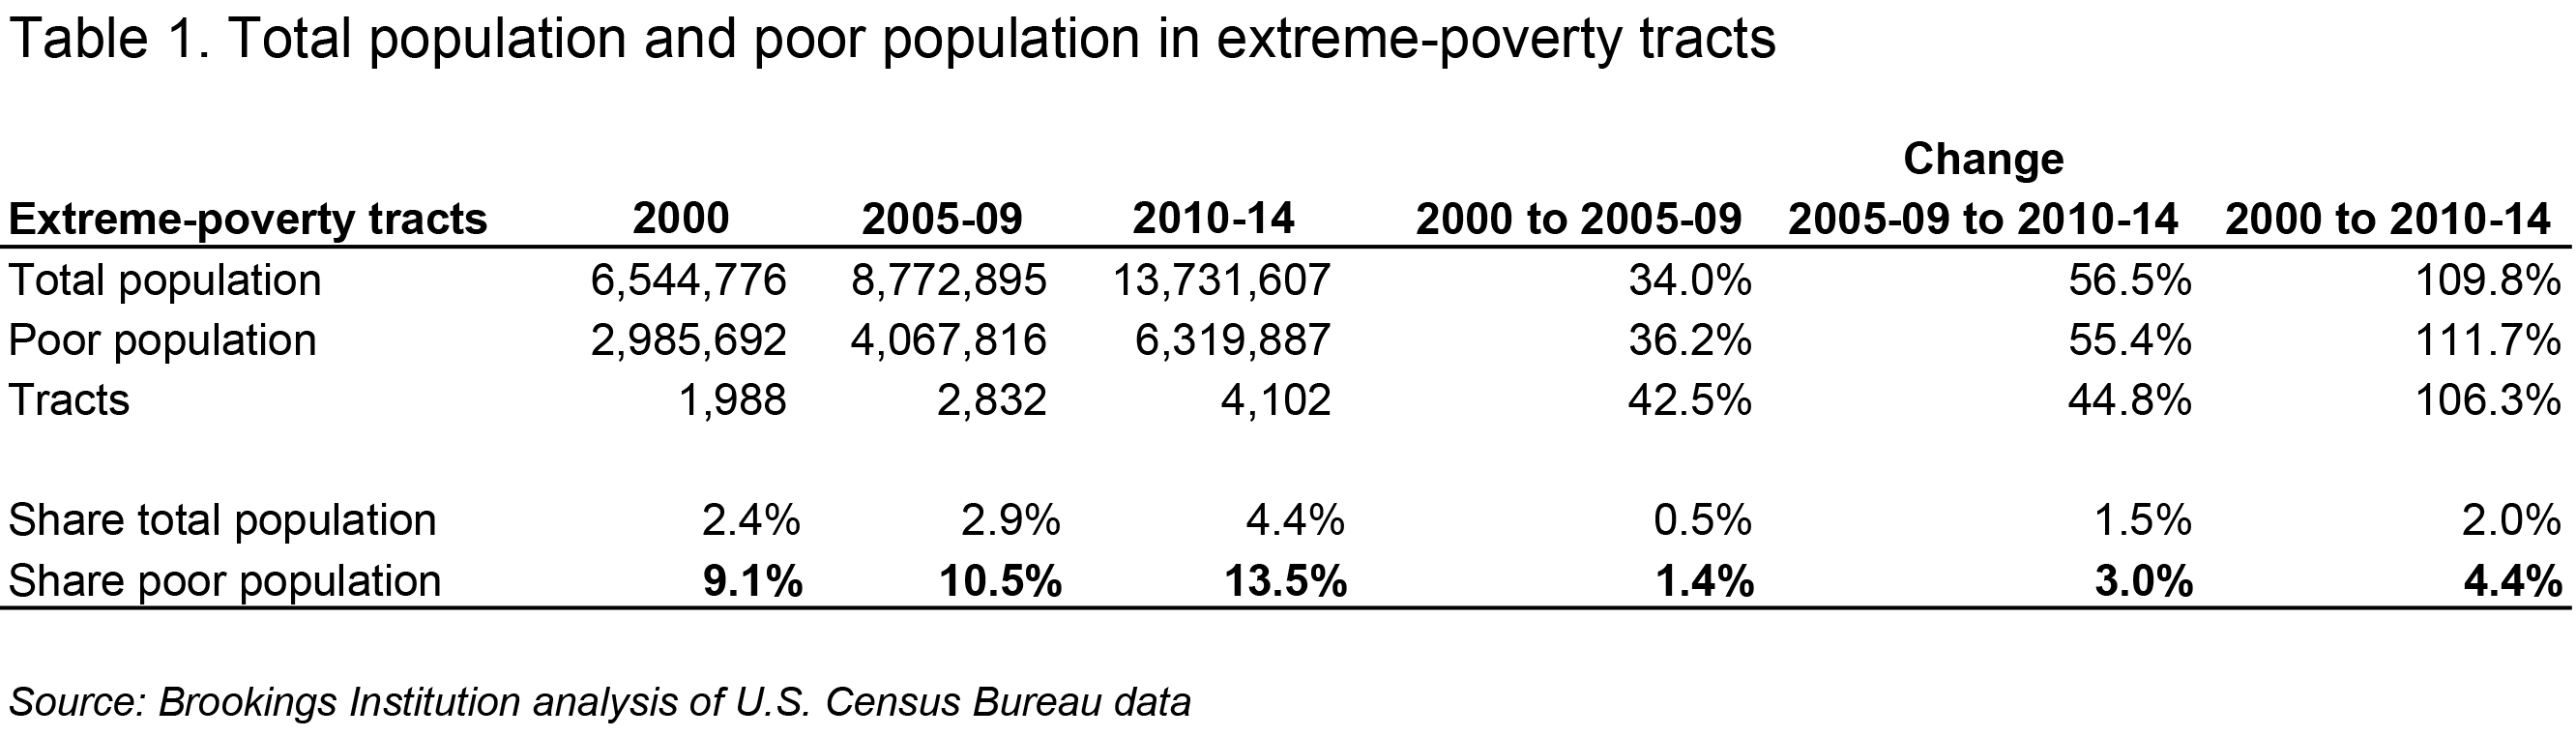
The onset of the Great Recession only served to exacerbate and accelerate those trends. Between 2000 and 2005-09, the number of extremely poor neighborhoods grew by over 40 percent, and the number of people living in those neighborhoods rose by one-third (Table 1). In the post-recession period alone, the number of extremely poor neighborhoods increased by 45 percent. The number of people living in such communities grew at an even faster clip (57 percent) between 2005-09 and 2010-14.
By 2010-14, almost 14 million people lived in neighborhoods with poverty rates of 40 percent or more—more than twice as many as in 2000. Of those residents, 6.3 million were poor. Put differently, 13.5 percent of the nation’s poor population faced the double burden of being poor in a very poor place—an increase of 3.0 percentage points over the late 2000s, and 4.4 percentage points higher than in 2000.
One might question whether the rapid rise of concentrated poverty after 2000 was just an artifact of increases in poverty overall. The national poverty rate rose by 3.2 percentage points between 2000 and 2010-14. If that growth had been shared evenly across places—imagine every census tract experienced the same percentage point increase in its poverty rate—then we might have expected just over 800 neighborhoods to cross the 40 percent threshold to become extremely poor over that time period. Instead, more than 2,700 tracts—over three times the expected number—joined the ranks of extremely poor neighborhoods between 2000 and 2010-14. Such steep increases underscore the uneven ways in which poverty clustered in declining and distressed places as it grew over the course of the 2000s.
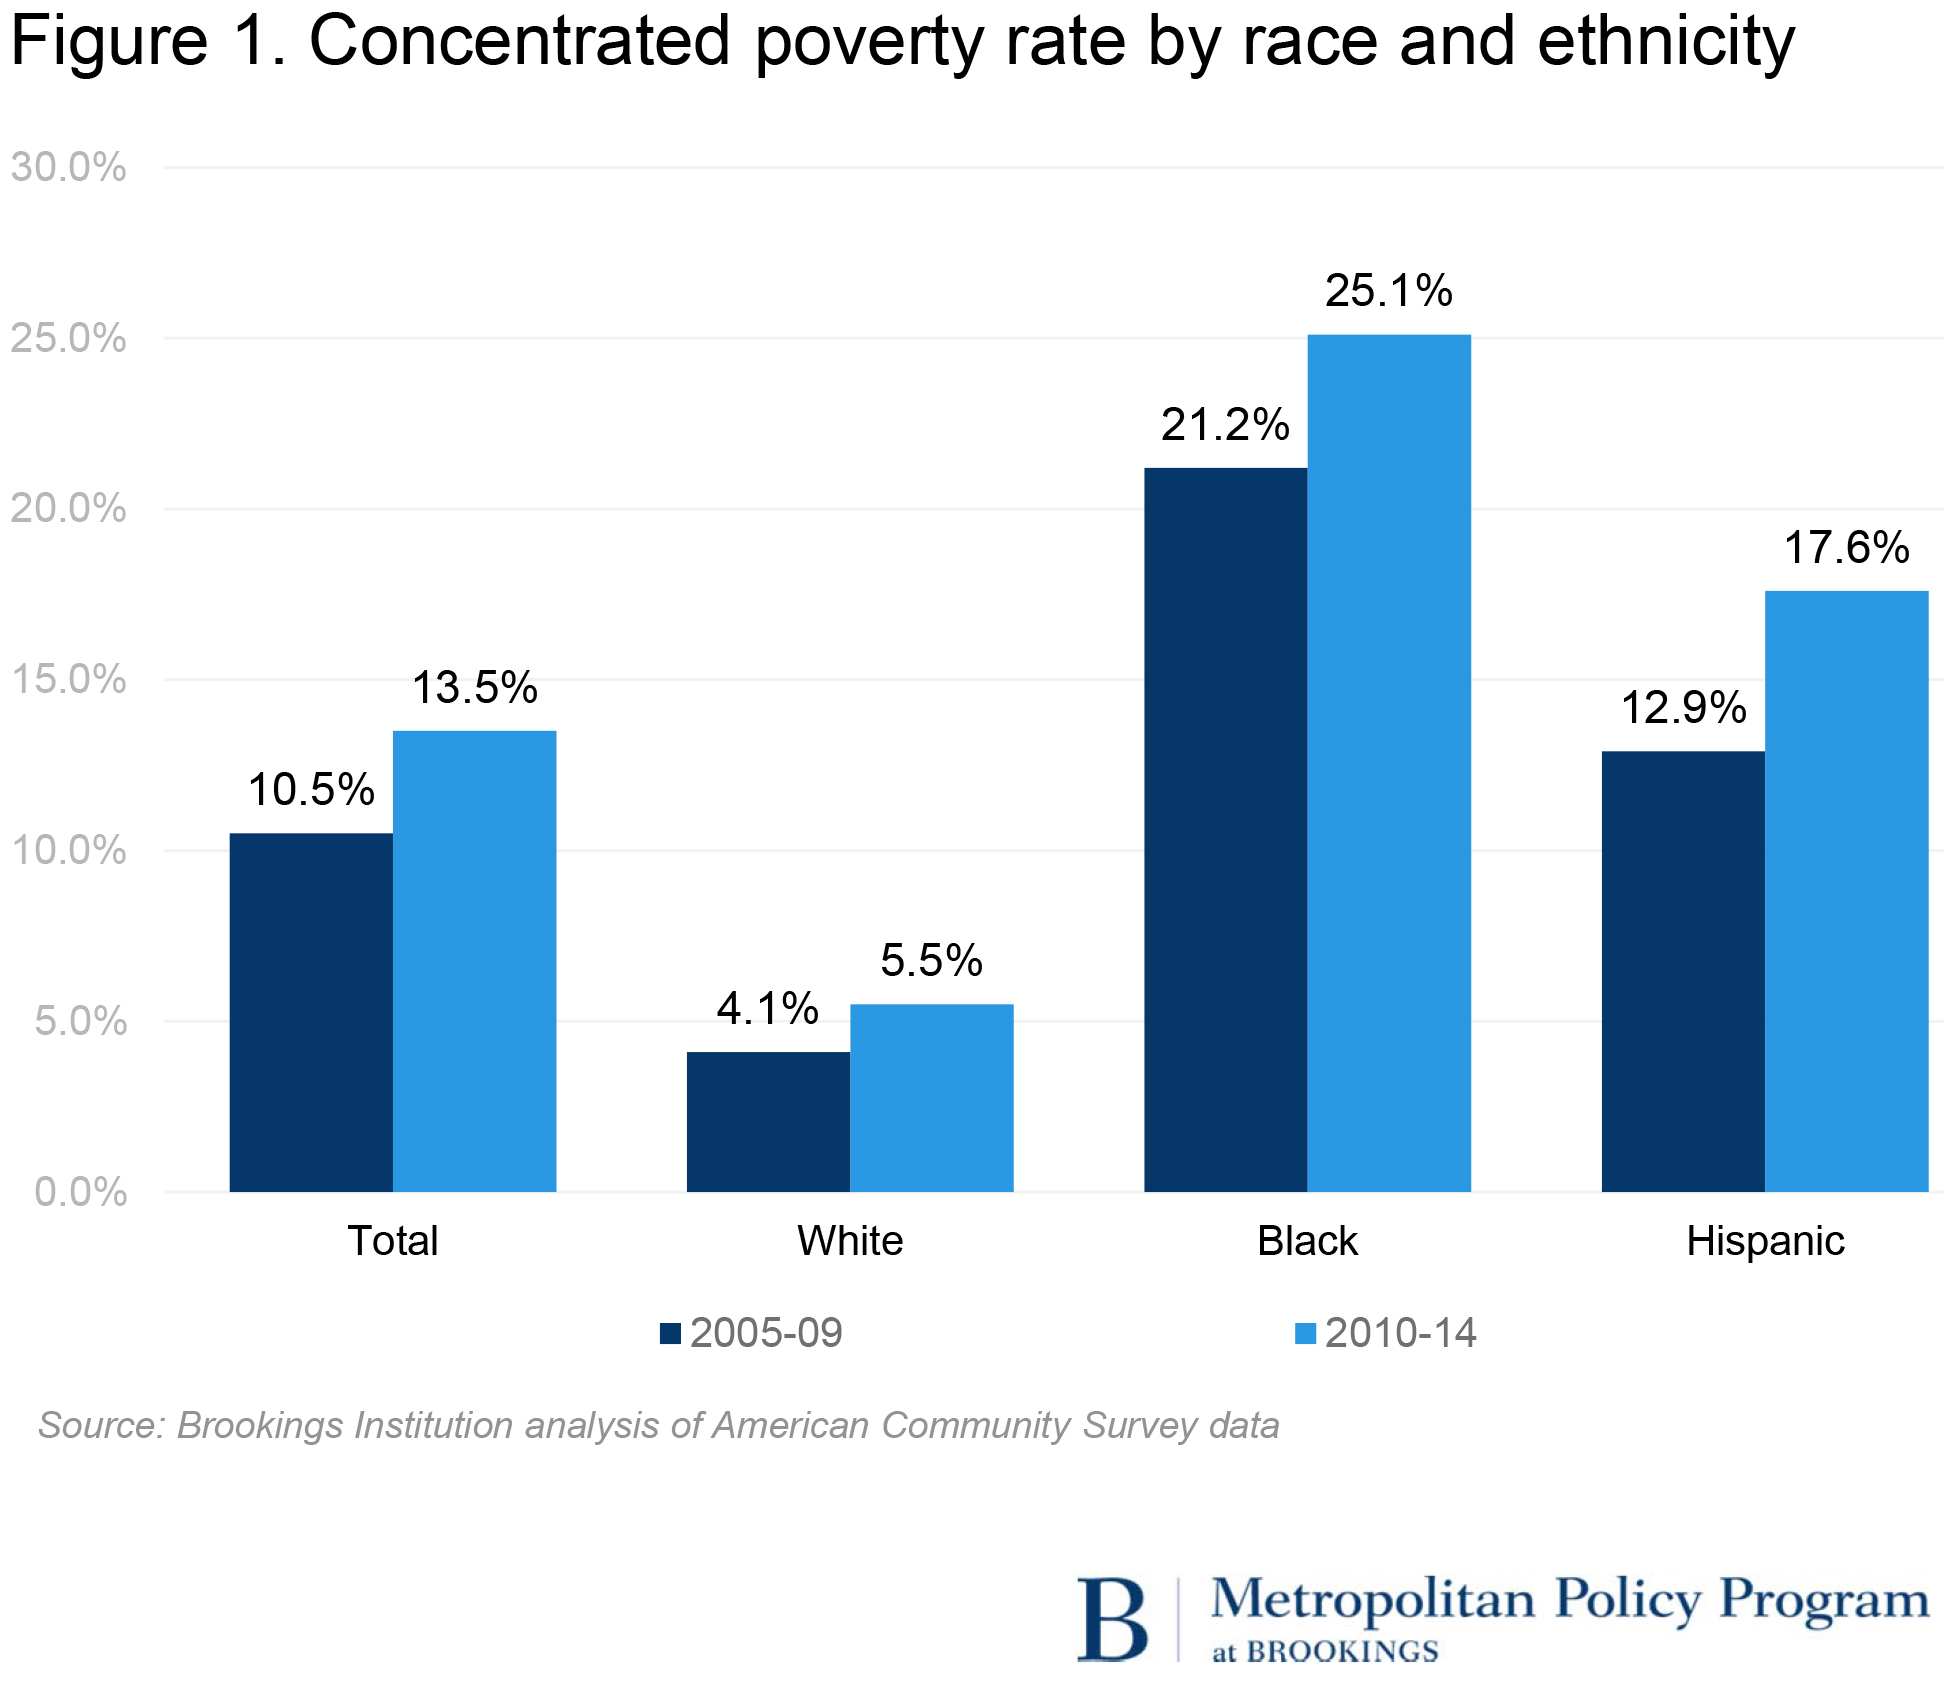
For poor Hispanics and African Americans, concentrations of poverty rose even more sharply, particularly in the post-recession period (Figure 1). Between 2005-09 and 2010-14, the share of poor residents living in distressed neighborhoods climbed by 4.7 percentage points for Hispanics and 3.9 percentage points for blacks, compared to a much more modest increase of 1.4 percentage points for whites. By 2010-14, poor Hispanics were more than three times as likely as poor whites, and poor blacks were almost five times as likely as poor whites, to live in an extremely poor neighborhood. Although whites made up 44 percent of the nation’s poor population in that time period, they accounted for just 18 percent of poor residents living in extremely poor neighborhoods. High levels of neighborhood distress thus remain a much more prominent feature in the lives of poor blacks and Hispanics than for their white counterparts.
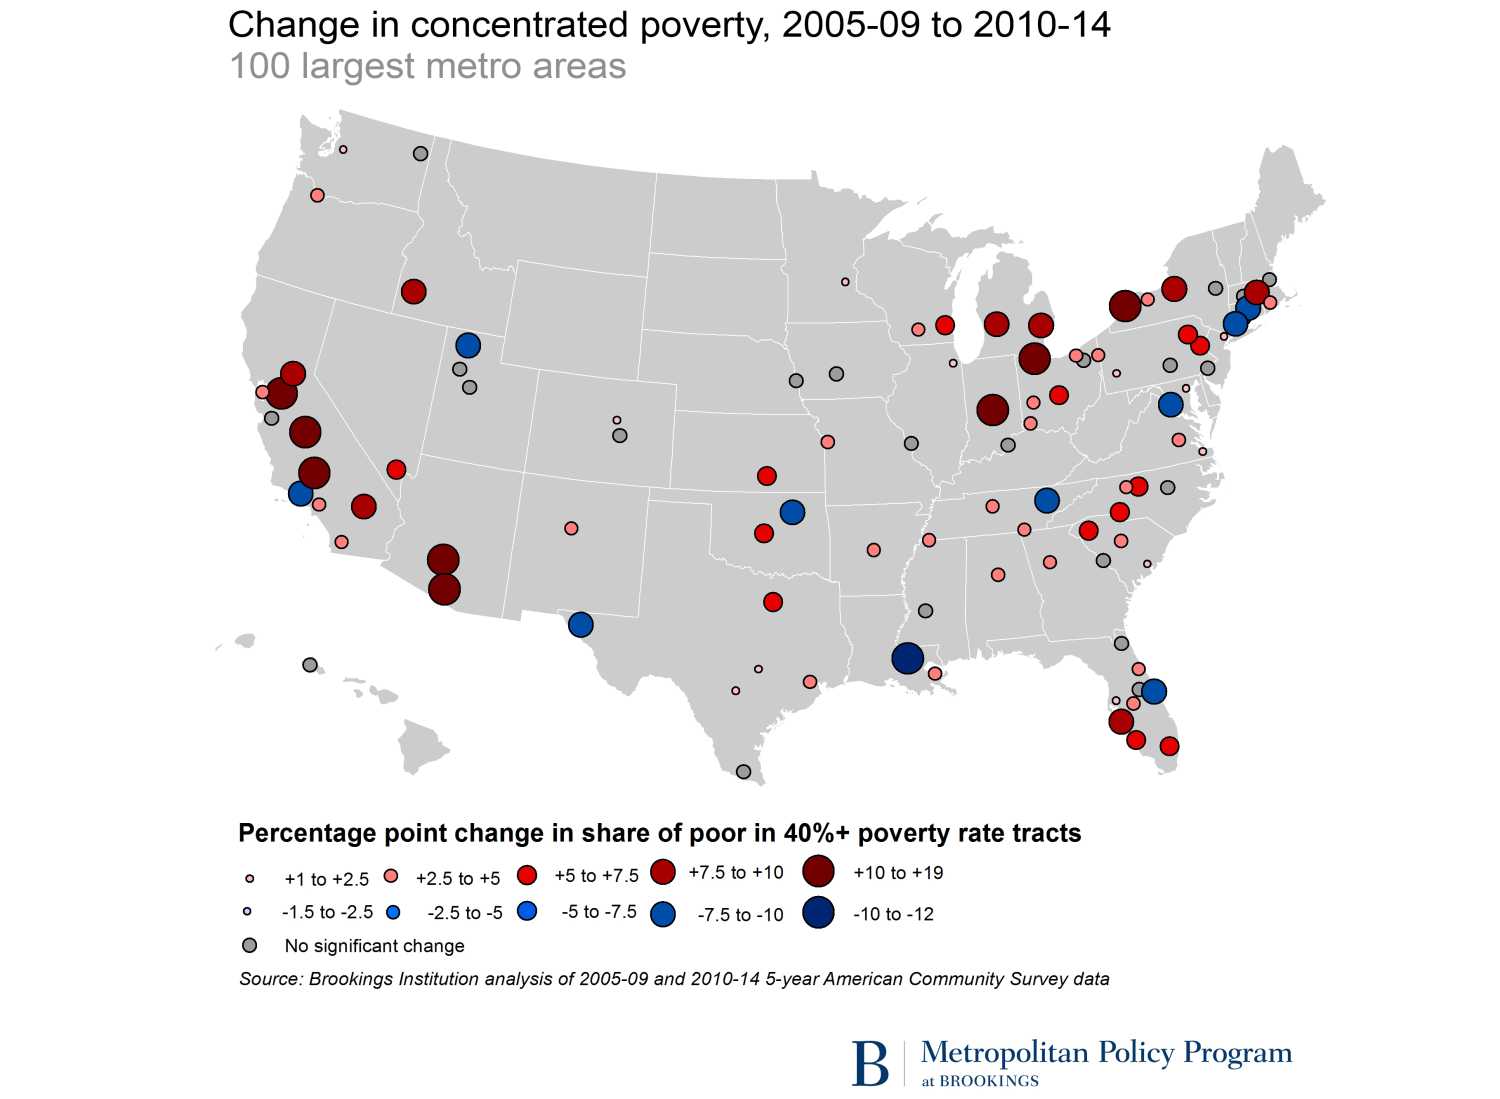
Concentrated poverty increased in 67 of the 100 largest metro areas between 2005-09 and 2010-14.
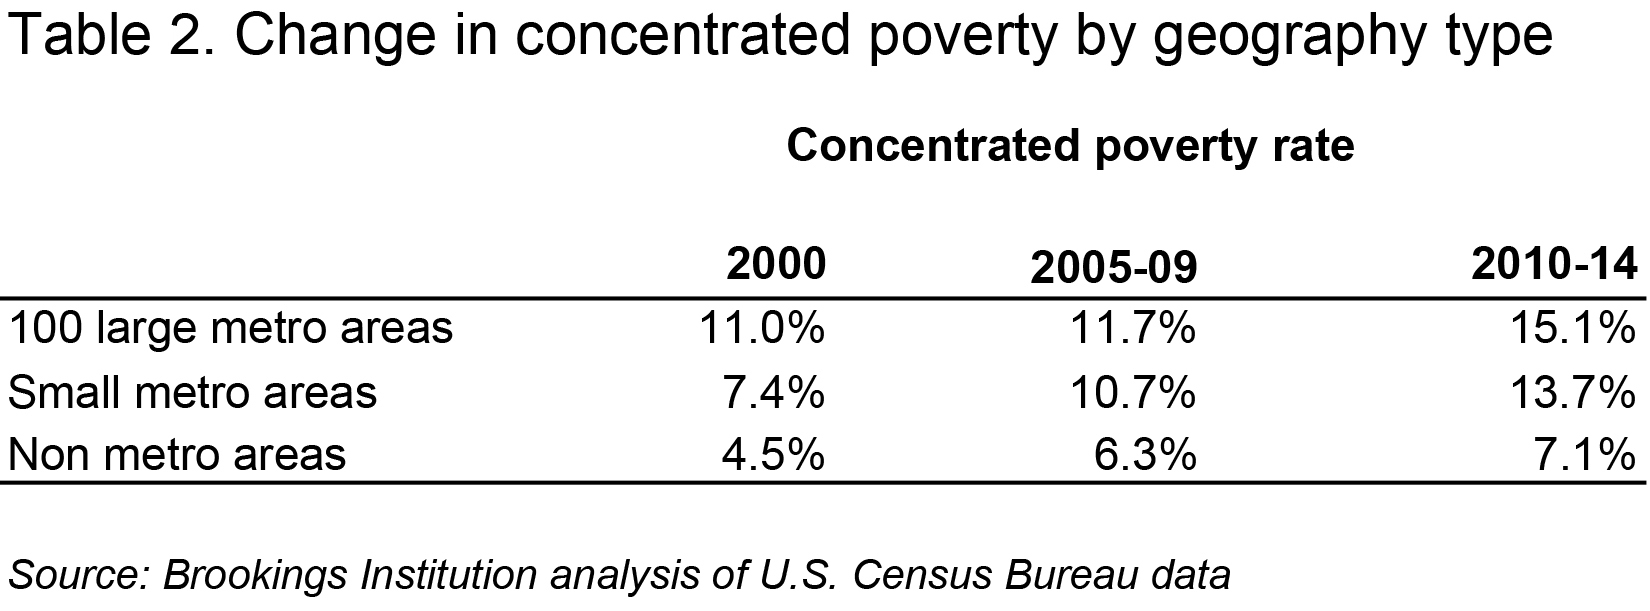
The growth of concentrated poverty in the 2000s touched a diverse array of communities. The increasing incidence of concentrated poverty was particularly pronounced in smaller metropolitan areas even before the onset of the Great Recession (Table 2). After the recession hit, small and large metro areas alike registered the steepest increases in the number of extremely poor neighborhoods and in the share of poor living in those places. Yet, even with the rapid growth experienced by small metro areas and more modest upticks in rural America, in 2010-14 the nation’s 100 largest metro areas remained home to more than 70 percent of all poor individuals living in extremely poor neighborhoods. And a higher share of major metro area poor lived in concentrated poverty (15.1 percent) than in small metro areas (13.7 percent) or rural communities (7.1 percent).
Among the nation’s largest metro areas, two-thirds (67) saw concentrated poverty grow between 2005-09 and 2010-14 (Map 1). The metro areas that registered the largest upticks included a number of Sun Belt metro areas hit hard by the collapse of the housing market—like Fresno, Bakersfield, and Stockton in California, and Phoenix and Tucson in Arizona—and older industrial areas in the Midwest and Northeast—like Indianapolis, Buffalo, and Syracuse. (See the appendix tables for detailed information about individual metro areas.)
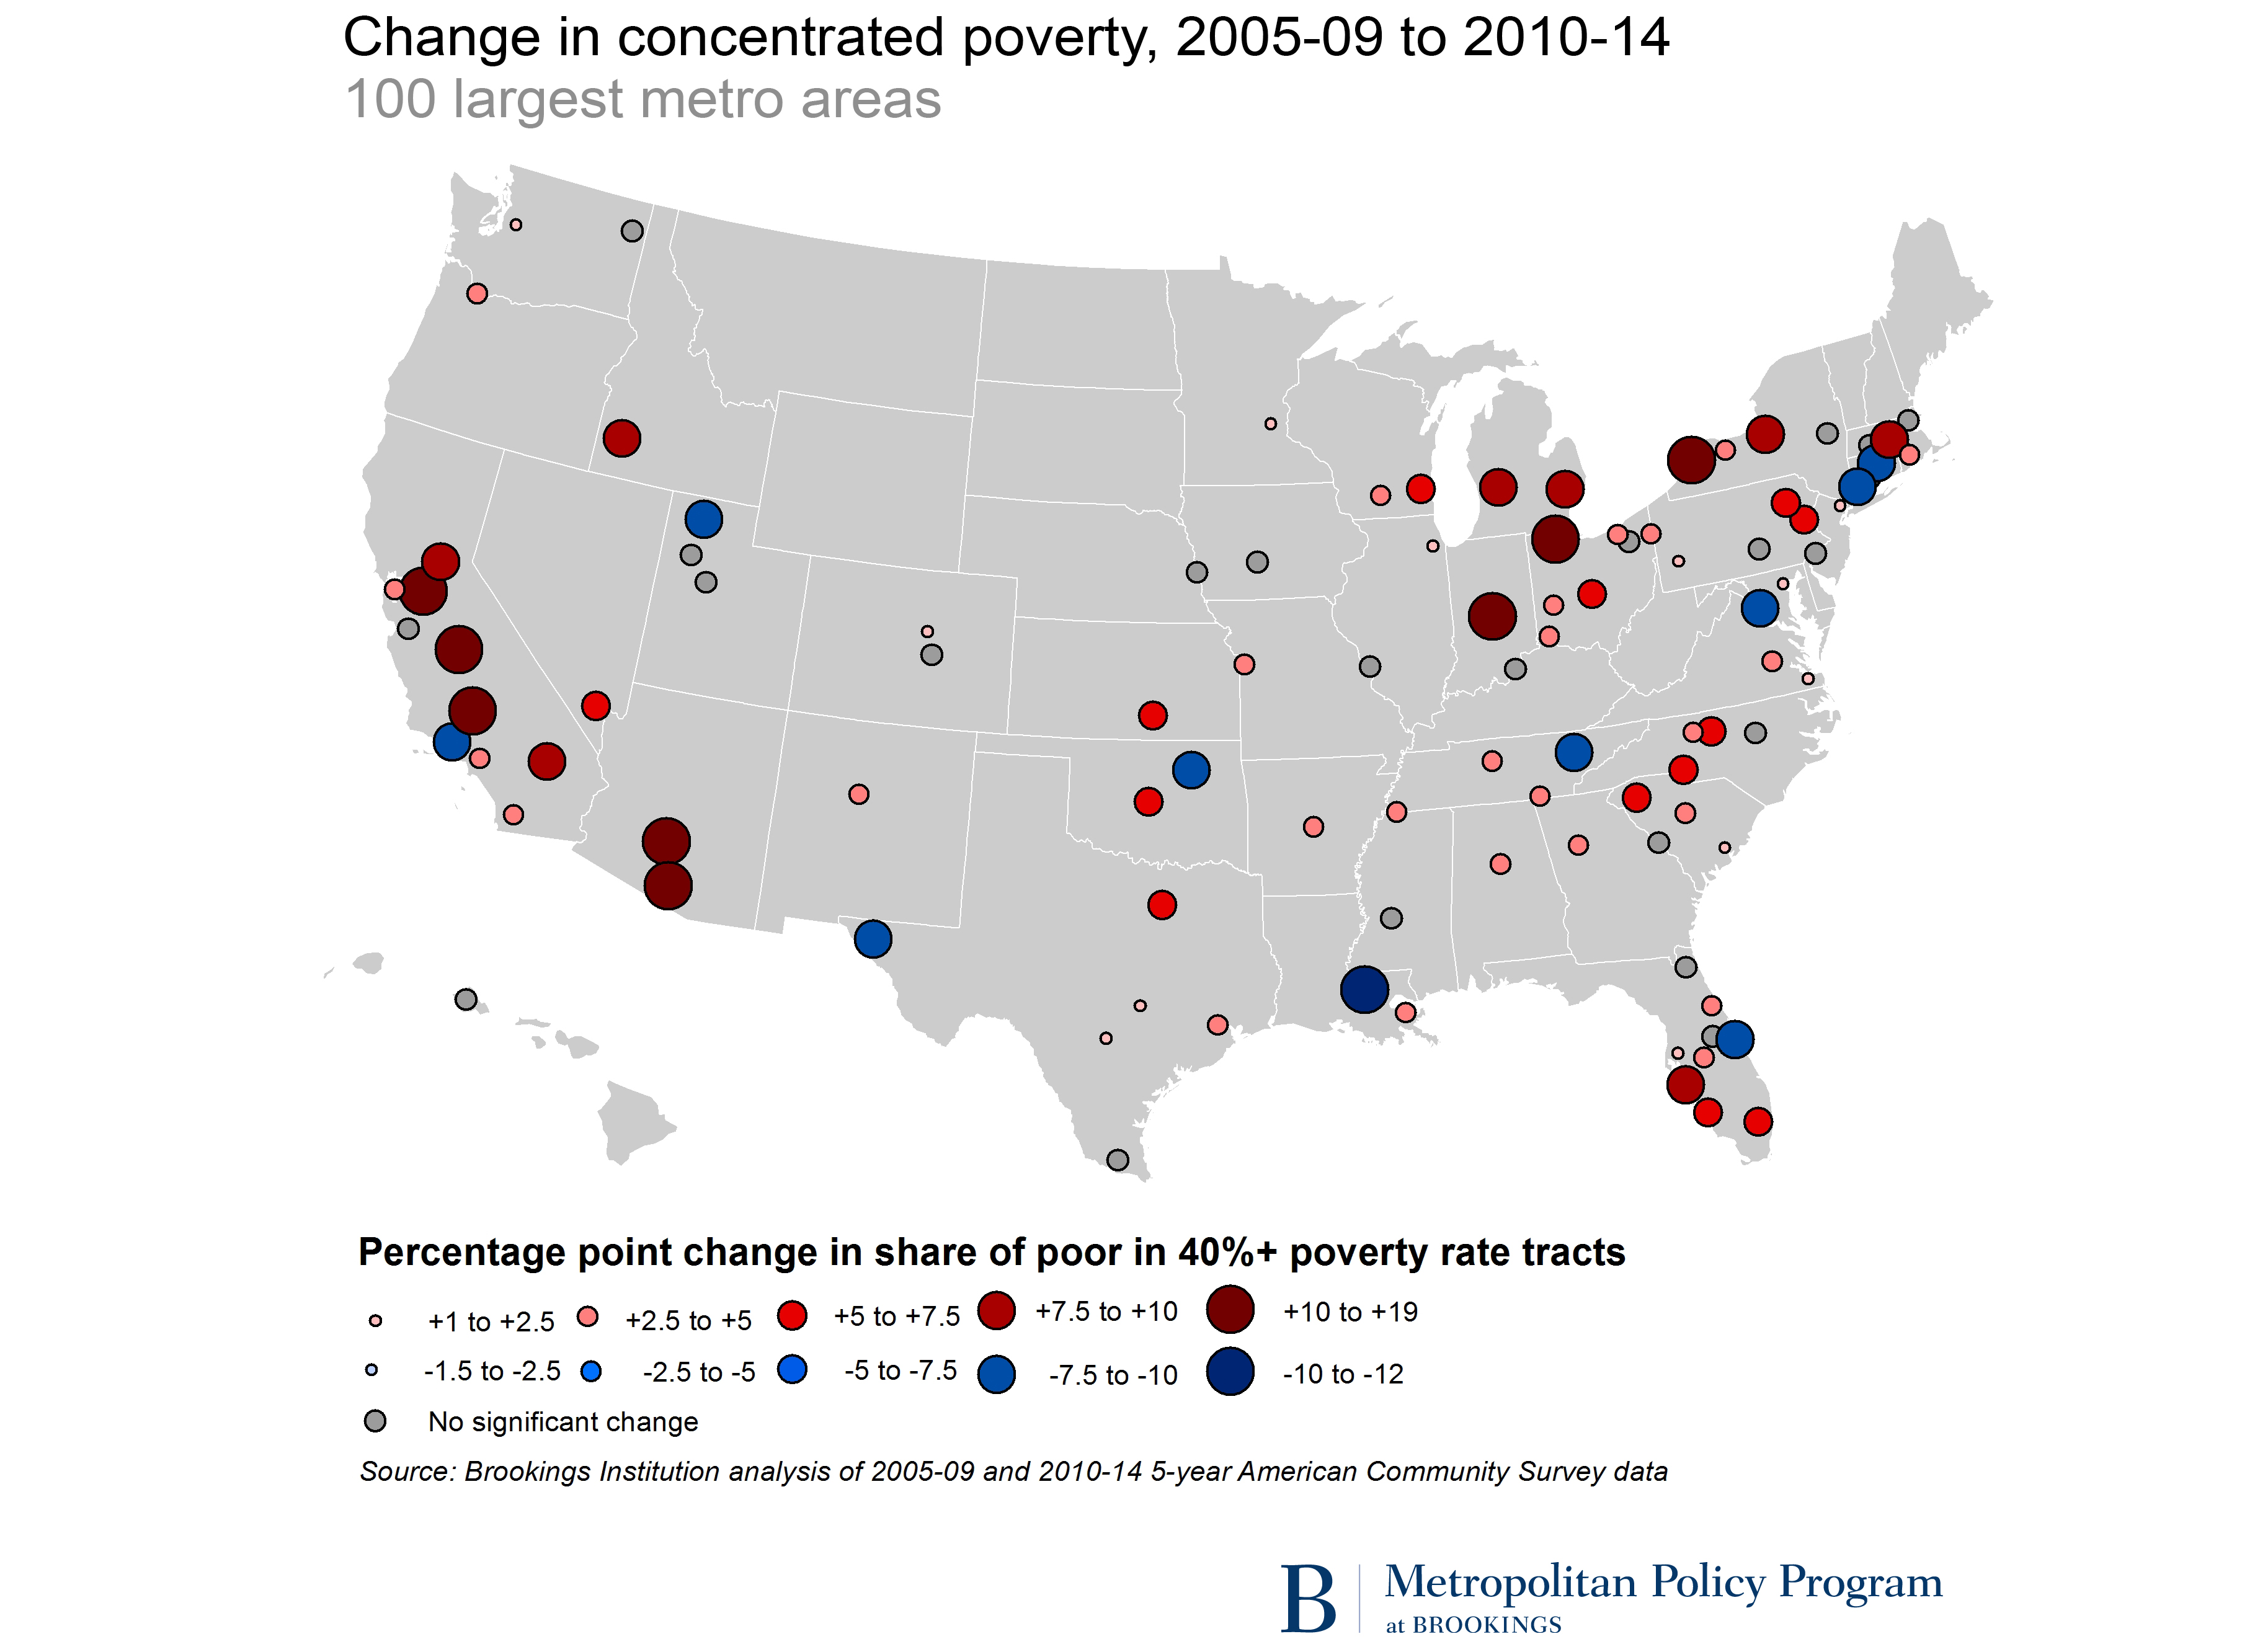
Only 10 major metro areas achieved significant decreases in concentrated poverty in the post-recession period. In some cases—like Washington, D.C.—the decline came not because the number of poor residents in distressed neighborhoods fell, but because the poor population grew at a faster pace elsewhere. In other regions, including Baton Rouge, Bridgeport, and El Paso, the number of distressed neighborhoods and the number of poor residents living in those areas dropped. El Paso, however, continued to rank among the regions with the highest concentrated poverty rates in 2010-14 (Table 3).
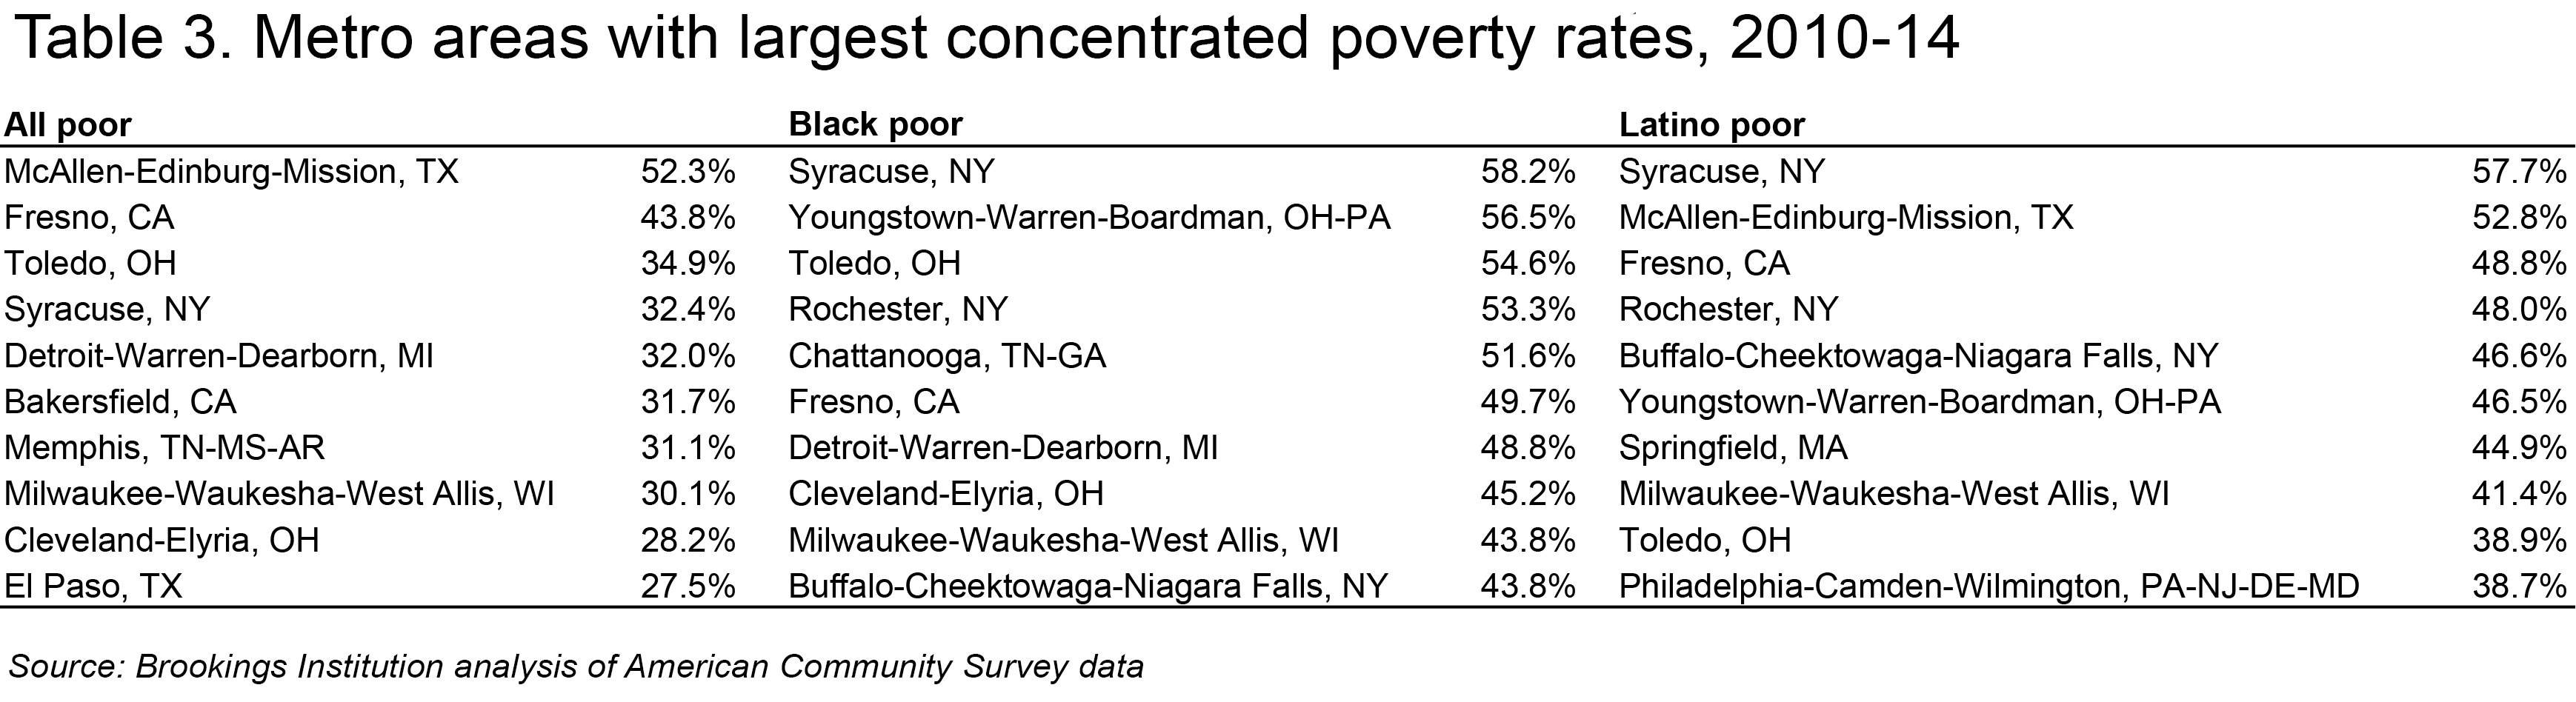
Like El Paso, some regions with greatest concentrations of poverty in 2010-14 were also among the poorest metro areas overall, including McAllen, Tex., where more than half (52 percent) of the poor population lived in extremely poor neighborhoods, and Fresno and Bakersfield in California’s Inland Empire. But other regions like Syracuse, Detroit, and Milwaukee, showed among the greatest geographic concentrations of the poor even though they did not likewise rank highly for their overall poverty rate. All in all, by 2010-14, eight metro areas registered concentrated poverty rates above 30 percent, putting them at levels at least twice as high as the 100 metro area average.
Considerable numbers of metro areas exhibited high rates of concentrated poverty among black and Latino residents. In 17 metro areas, more than 30 percent of poor Latino residents lived in concentrated poverty, with rates reaching well above 40 percent in metro areas like Buffalo, Fresno, Rochester, and Syracuse (Table 3). Syracuse also led the list for the concentrated poverty rate among black residents, with nearly 59 percent of poor black residents living in extremely poor neighborhoods in 2010-14. Nearly one-third (30) of the nation’s largest metro areas had more than 30 percent of their poor black residents living in concentrated poverty in the post-recession period, and in five regions, more than half of poor blacks lived in extremely poor neighborhoods.
Following the recession, the number of poor people living in concentrated poverty in suburbs grew nearly twice as fast as in cities.
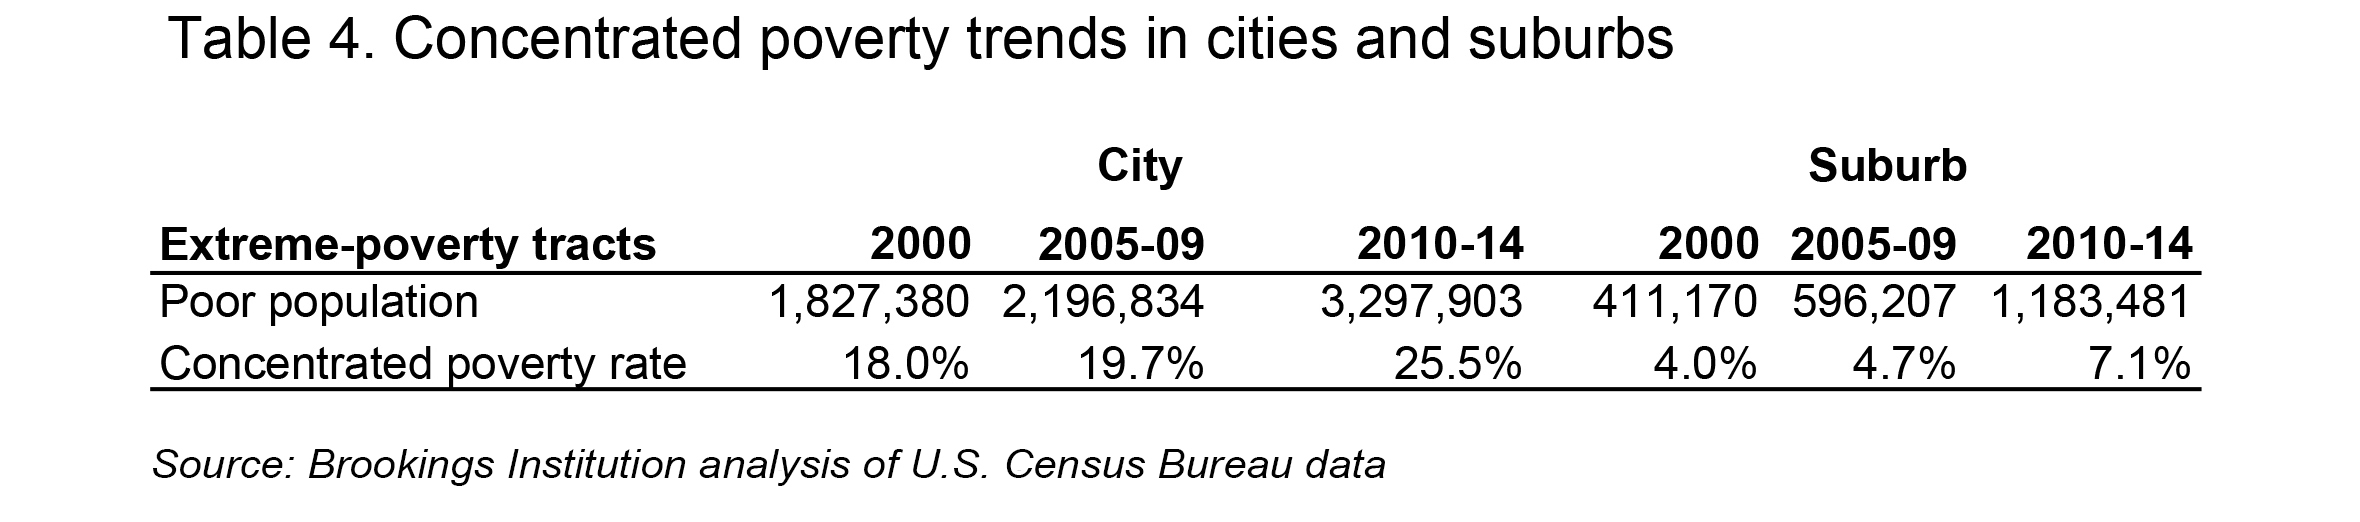
Within the nation’s major metro areas, concentrated poverty spread rapidly beyond the urban core in the 2000s. By 2010-14, almost 1.2 million suburban poor lived in concentrated poverty—nearly double the number compared to 2005-09 and almost three times as many as in 2000. In the post-recession period alone, the suburban concentrated poverty rate jumped 2.4 percentage points to reach 7.1 percent (Table 4).
Yet, while the number of poor living in concentrated poverty grew twice as fast in suburbs as in urban areas, big cities remained home to roughly three-quarters (74 percent) of the major metro area poor population living in extremely poor neighborhoods. By 2010-14, 26 percent of the urban poor—or 3.3 million people—lived in an extremely poor neighborhood (Figure 2). The shares reached even higher for poor black residents in big cities (36.3 percent), who lived in concentrated poverty at more than two and a half times the rate of poor white residents (13.4 percent).
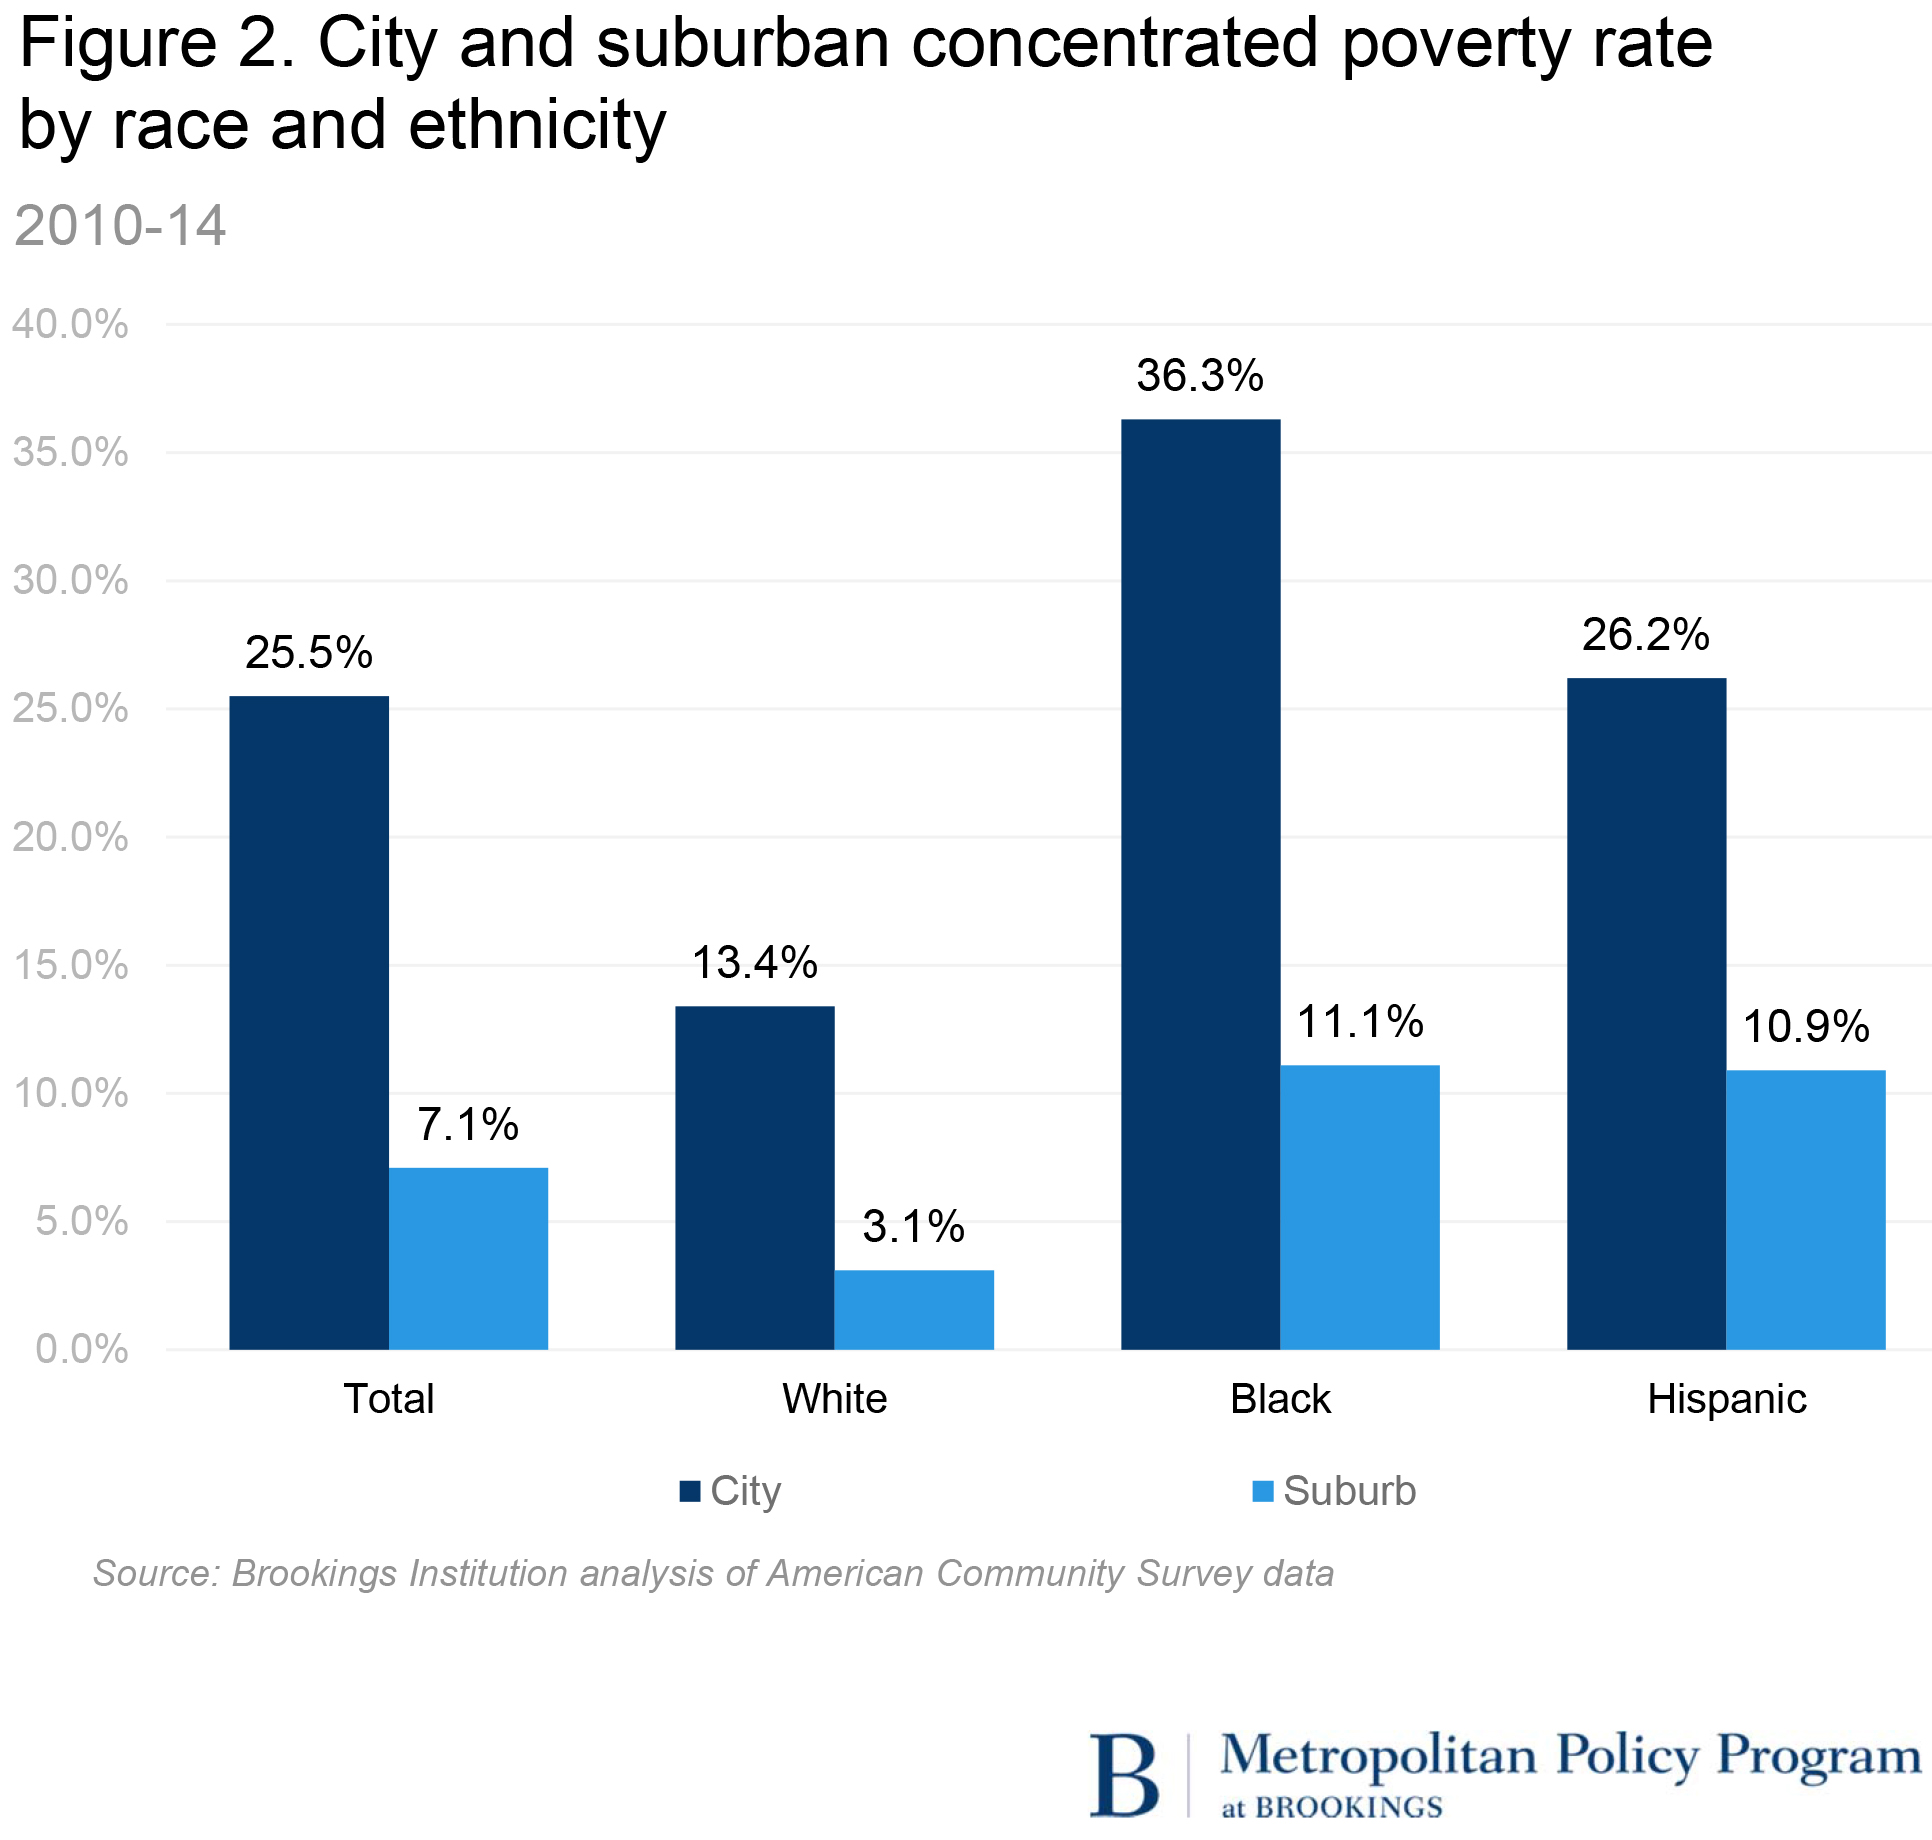
The gap between white and black concentrated poverty rates was even more pronounced in suburbs than in cities. Poor black residents of suburbs were more than three and one-half times as likely to live in extremely poor neighborhoods as poor whites in suburbs. However, both groups experienced concentrated poverty at much lower rates than their urban counterparts. Just over one in 10 poor black suburban residents lived in extremely poor neighborhoods in 2010-14, and just over 3 percent of poor white suburban residents were located in such neighborhoods.
Extremely poor suburban neighborhoods are often located in communities that do not necessarily fit the popular Leave It to Beaver stereotype of the suburbs. They are more likely to fall in older industrial regions in the Midwest and Northeast, often in inner-ring suburbs (e.g., Harvey and Chicago Heights or Cleveland Heights and East Cleveland) or in smaller industrial cities (e.g., Paterson and Camden, New Jersey or Pontiac, Mich.) that have experienced longer-run economic restructuring and decline and lie outside their region’s economic core. Or they fall in the semi-rural parts of poorer metro areas like Fresno, El Paso, and McAllen. However, the late 2000s also saw a number of extremely poor neighborhoods emerge in fast-growing regions in the South and Intermountain West, in places like Atlanta’s Cobb, DeKalb, and Clayton Counties, Las Vegas’ inner-ring suburbs of North Las Vegas and Paradise, and Surprise, Ariz.—one of the fastest-growing communities in metropolitan Phoenix.
More than half of all poor residents in the United States now live in high poverty or extremely poor neighborhoods.
George Galster’s research has shown that the negative effects of concentrated poverty—like its influence on crime, school dropout rates, and the duration of poverty—actually begin to emerge once a neighborhood’s poverty rate exceeds 20 percent, and grow rapidly before leveling off around the 40 percent threshold.5 Thus, in addition to the growth in concentrated poverty, policymakers and practitioners should be concerned by the rapid rise in the number of high poverty neighborhoods in recent years.
Between 2005-09 and 2010-14, the number of high poverty neighborhoods (with poverty rates between 20 percent and 40 percent) nationwide grew by more than 4,300—more than three times the growth in extremely poor neighborhoods (with poverty rates exceeding 40 percent) over that time period. With that growth, the share of the nation’s poor population living in high poverty or extremely poor neighborhoods rose by more than 7 percentage points. As a result, the majority of poor people (55 percent) in the United States now live in a high poverty or extremely poor area (Table 5).6 This was also true for big cities, small metro areas, and rural communities.
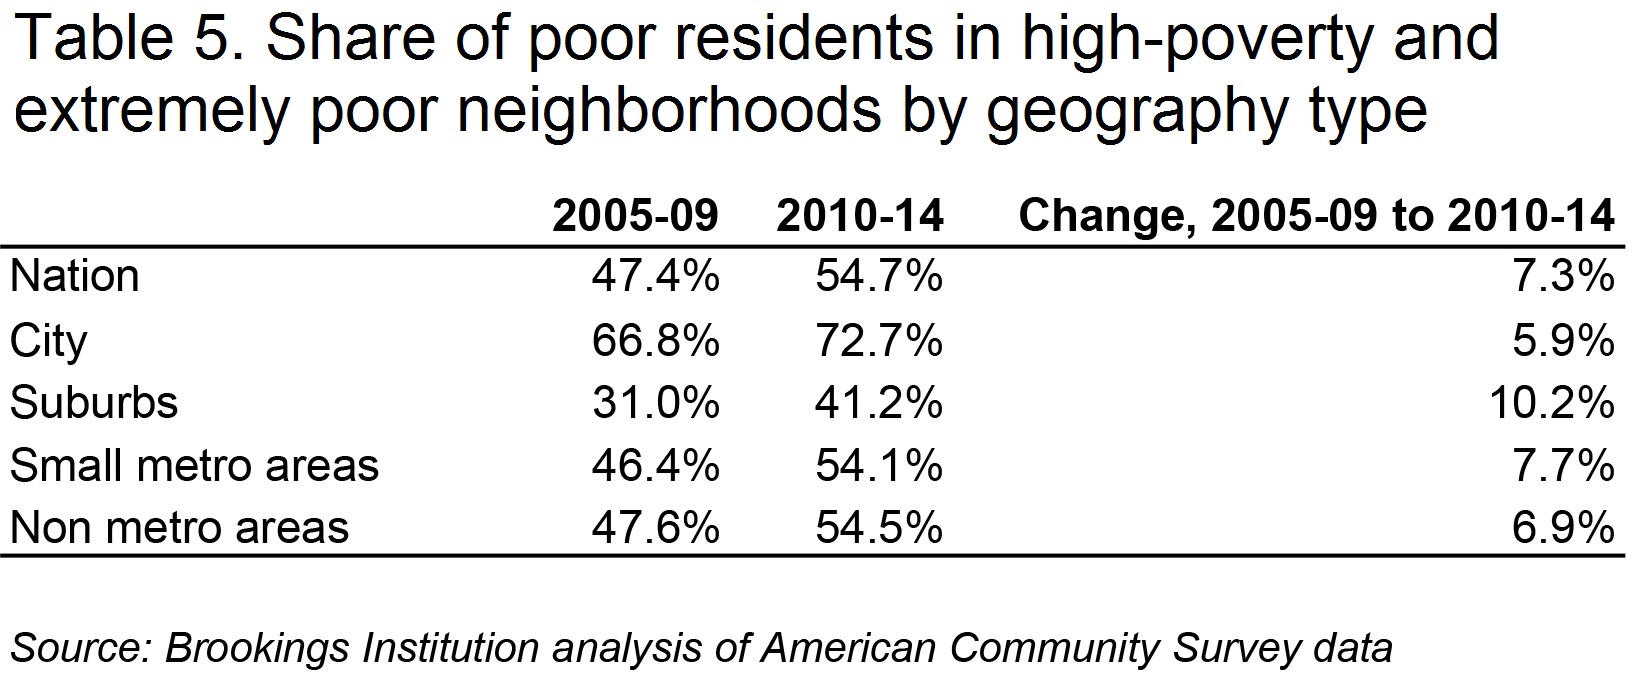
While only 41 percent of poor suburban residents lived in such communities in 2010-14, a number of indicators suggest that neighborhood distress is on the rise in suburbs. Following the recession, suburbs posted a 10 percentage point increase in the share of poor residents living in neighborhoods with poverty rates of at least 20 percent—almost double the increase in big cities and a larger uptick than those in small metro areas or rural communities. Nationally, suburbs accounted for one-third (33.3 percent) of newly high poverty neighborhoods (census tracts that had poverty rates below 20 percent in 2000 but above that level by 2010-14)—a higher share than cities (24.4 percent), rural communities (21.5 percent), or small metro areas (20.9 percent).
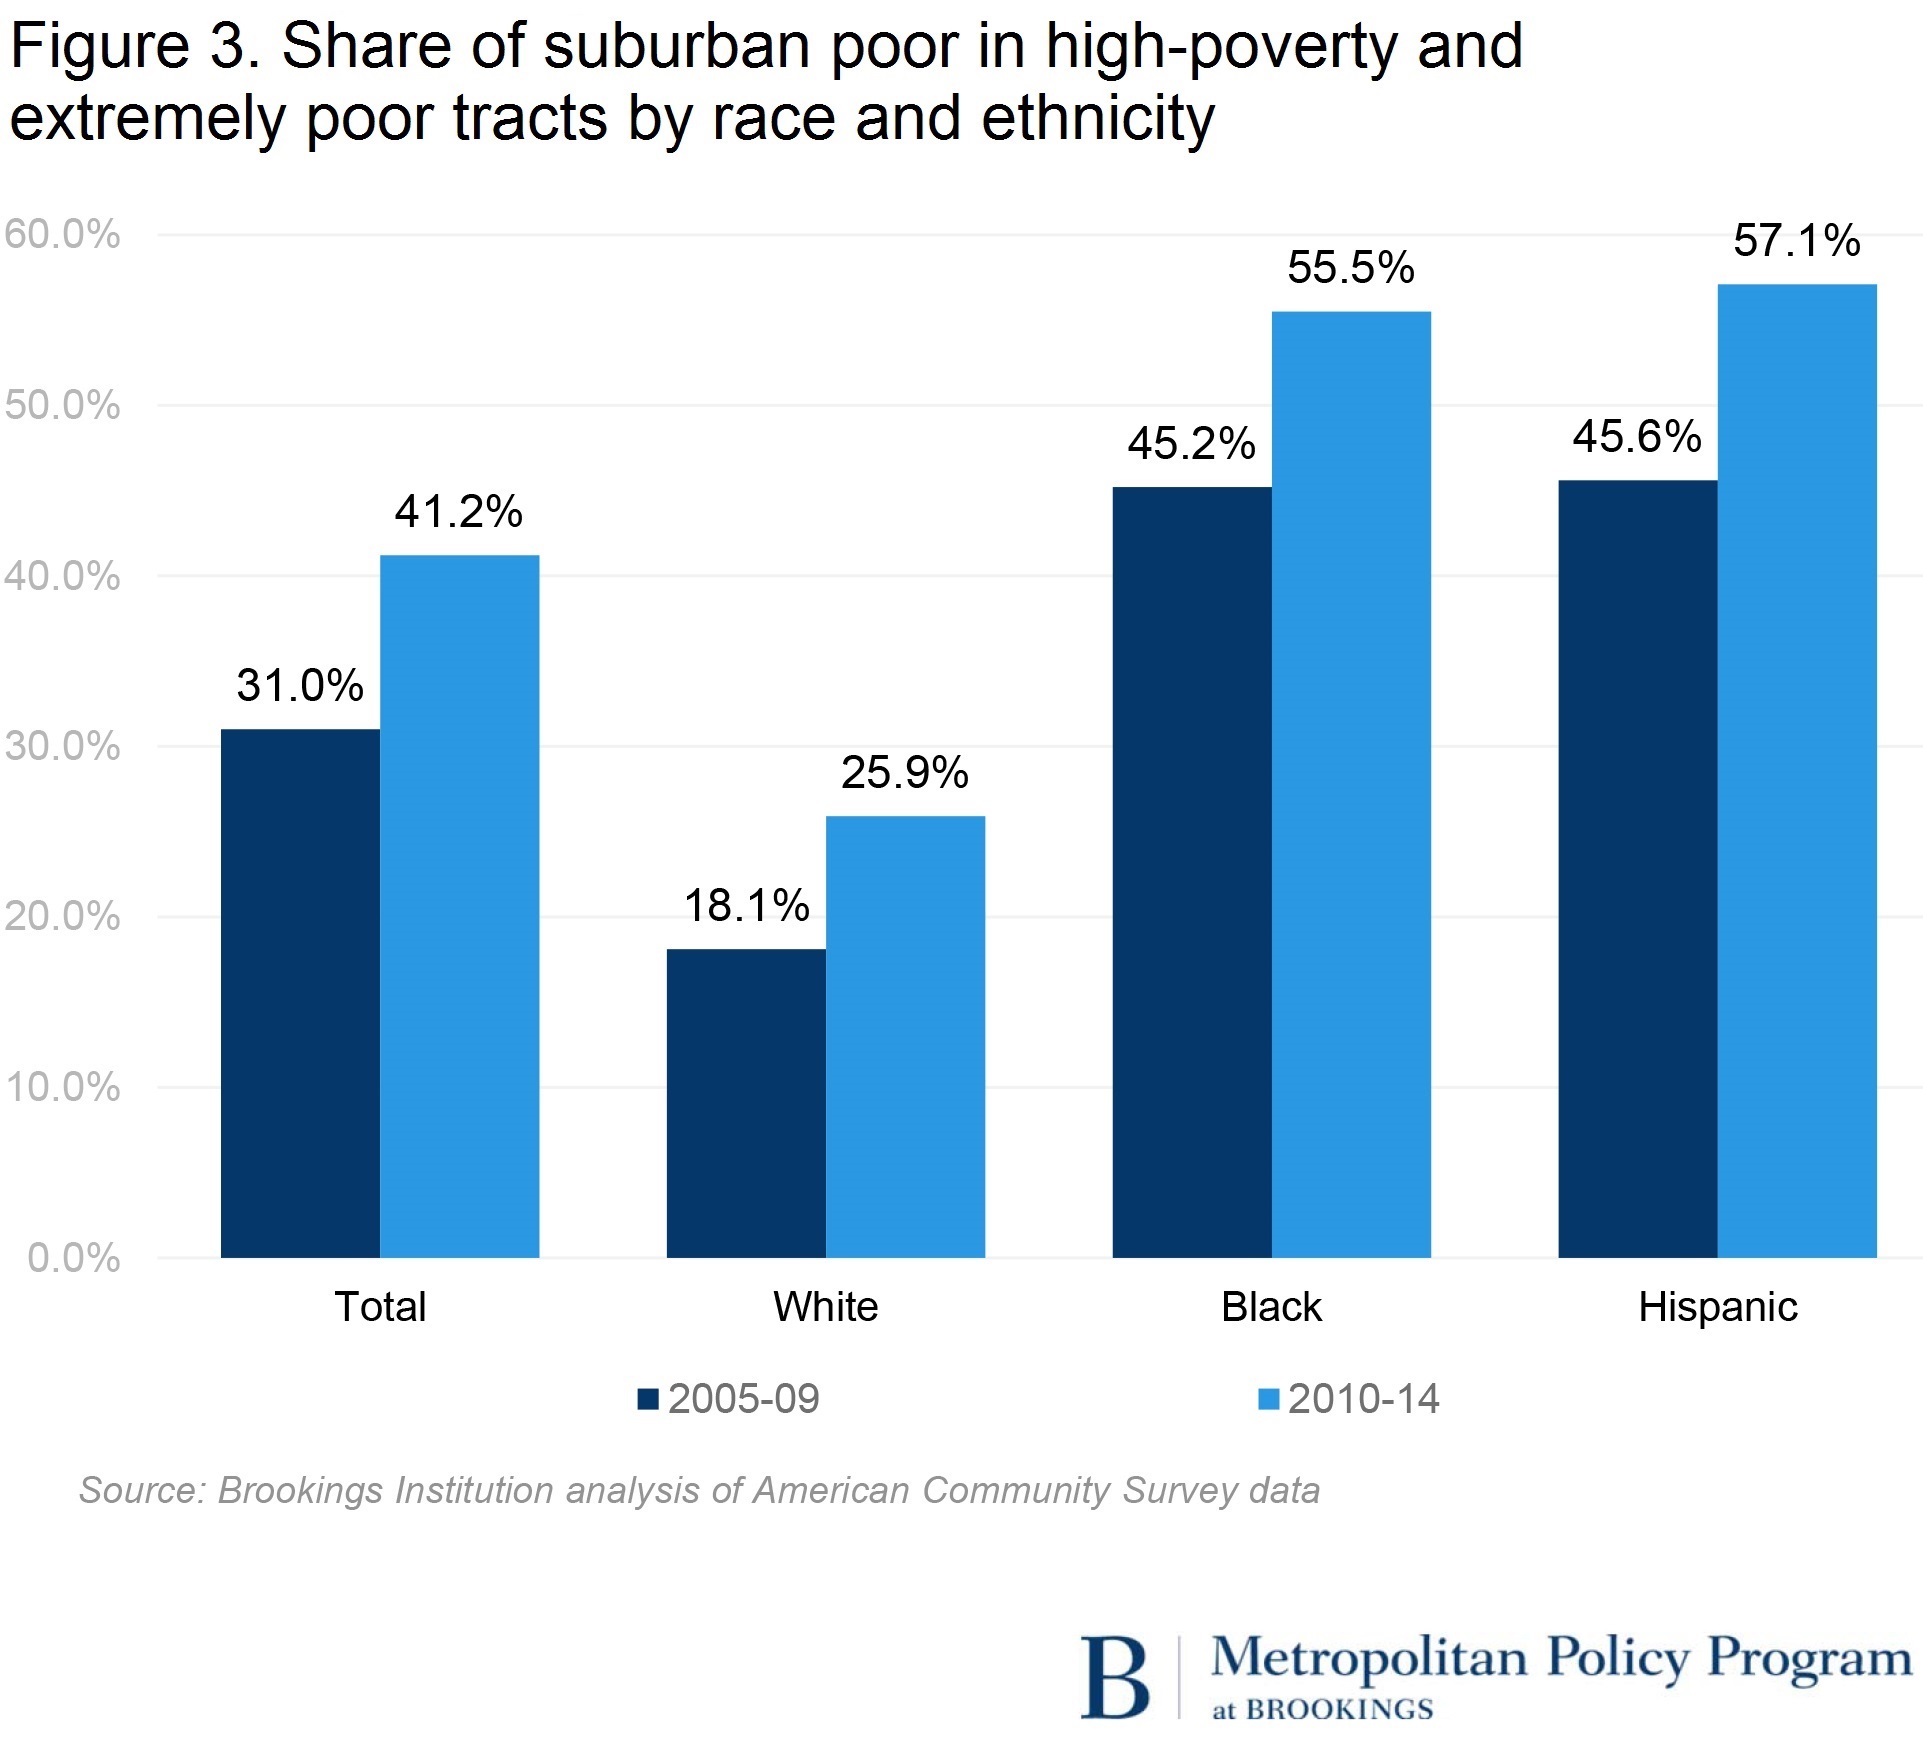
What is more, the likelihood of living in a disadvantaged suburban neighborhood in the post-recession period varied markedly depending on race and ethnicity. The share of poor black and Hispanic suburban residents living in neighborhoods with poverty rates of at least 20 percent climbed by more than 10 percentage points between 2005-09 and 2010-14 (Figure 3). While poor white residents in the suburbs experienced an uptick of almost 8 percentage points in concentrated disadvantage in that period, just one in four lived in high poverty or extremely poor neighborhoods in 2010-14. Poor black and Hispanic residents experienced concentrated disadvantage at more than twice that rate. Tracking the national average, more than half of poor black and Hispanic residents in the suburbs lived in a neighborhood with a poverty rate of at least 20 percent.
While high poverty neighborhoods grew in the same regions and types of communities that experienced upticks in extremely poor tracts, they also emerged in an even broader array of places in recent years. The Washington, D.C., region is home to some of the wealthiest counties in the country, yet high poverty neighborhoods have developed in places like Gaithersburg, Silver Spring, and Wheaton in Montgomery County, Maryland, and in communities like Annandale, Bailey’s Corners, and Reston in Fairfax County, Virginia. Long Island’s Nassau County also ranks among the nation’s wealthiest but is home to pockets of high poverty in places like New Cassel and Hempstead. Nor were strong regional economies immune to these trends, with high poverty neighborhoods cropping up in communities like Albany, Antioch, and Concord in San Francisco’s East Bay suburbs and in places like Everett, Kent, and SeaTac in Seattle’s suburban ring.
Conclusion
The rapid spread of poverty and its increasing concentration outside of the urban core, particularly following the Great Recession, challenges long-held assumptions about where poor people live and where distressed neighborhoods are located within regions. But not only has public perception lagged behind the changing landscape of poverty, the traditional policy and practice playbook that has evolved over decades to address poverty in place has also failed to keep up with the larger scale and more diverse geography of need that exists today.
As a first order challenge, the proliferation of distressed and disadvantaged neighborhoods in recent years further strains already limited resources—from the federal level to the local—targeted to such places. The rapidly increasing likelihood that these neighborhoods are located in suburban communities or smaller metropolitan areas brings additional layers of complexity because these places often lack the necessary infrastructure, safety net supports, and capacity to address these challenges. Add to that the fact that struggling suburbs are often set up to compete, rather than collaborate, with urban areas for what resources and programs exist to address poverty in place. While many cities have been dealing with concentrated poverty for longer and continue to have critical needs, they also tend to have developed more capacity and experience navigating these issues and the policy landscape as a consequence. In that context, suburbs and other similarly situated communities often fail to attract what resources are available through competitive funding streams, which only perpetuates the resource and capacity gaps that plague many of the communities hit hardest by recent, but rapid, increases in poverty.
Adapting to today’s geography of poverty does not and should not mean shifting limited (and often inadequate) resources from cities, where need remains high, to suburbs, where need has quickly grown. Rather, the increasingly regional footprint of poverty and concentrated disadvantage calls for regional solutions that work across city and suburban boundaries. Whether targeting investments to help improve and revitalize distressed neighborhoods or implementing mobility strategies that open up opportunities for low-income residents in other lower-poverty areas, striking the right balance and effectively implementing those strategies requires a regional perspective. It also requires an integrated approach to decisionmaking at the metropolitan scale around transportation, economic and workforce development, and—perhaps most important to overcoming patterns of segregation—land use, zoning, and affordable housing.
Many metro areas across the country are already working regionally on strategies to increase access to opportunity for urban and suburban residents alike. In the Denver region, Mile High Connects is helping to leverage the expansion of the transit network to increase access to housing choices, jobs, and services for low-income and minority residents. In regions like Chicago and Baltimore, metro areas are finding ways to strategically use housing subsidies to increase options in higher opportunity areas for low-income families. To modernize the outdated playbook of place-based, anti-poverty policies, policymakers and practitioners can learn from and help scale up the innovative models regions have already begun building to address shared challenges in more cross-jurisdictional and integrated ways. Failing to do so not only risks further entrenching concentrations of disadvantage in long-struggling cities, but also creating a new wave of chronically distressed places in the nation’s suburbs.
A data error in the original publication of this report slightly overstated the number of high- and extreme-poverty census tracts. It has been corrected.
Endnotes
1. For a more in-depth review of the literature on the effects of concentrated poverty, see the Federal Reserve System and the Brookings Institution, “The Enduring Challenge of Concentrated Poverty in America: Case Studies from Communities Across the U.S.” (Richmond, VA: 2008); and Patrick Starkey, Stuck in Place: Urban Neighborhoods and the End of Progress Toward Racial Equality (Chicago: University of Chicago Press, 2013).
2. The American Community Survey is the successor to the long form decennial Census, providing detailed annual data on demographic and economic characteristics of people and households in the United States. Although the survey is conducted on a large sample of approximately 3.5 million U.S. households each year, multiple years of data must be pooled to produce reliable estimates for small geographic areas. The Census Bureau instructs that data users should not compare overlapping multi-year estimates. Because estimates for census tracts are only available using five-year data, the release of 2010-14 five-year data represents the first time since the ACS’s inception that non-overlapping estimates for census tracts are available.
3. The 2000 data come from GeoLytics and have been normalized to 2010 census tract boundaries, allowing for direct comparisons of change at the neighborhood level between 2000 and 2010-14. We eliminate tracts from the analysis that (1) have small populations (i.e., fewer than 500 residents) or (2) have large student populations (i.e., more than half of residents are enrolled in a college or graduate school).
4. In this analysis, we use the 2013 metropolitan statistical area (MSA) definitions determined by the U.S. Office of Management and Budget and the U.S. Census Bureau. The 100 largest metro areas are the most populous regions based on 2010 population counts. “Small” metro areas include any other official MSA outside the top 100, while “rural” communities include any county that is not a part of an official MSA (note that counties belonging to micropolitan statistical areas are also considered rural). Within the top 100 metro areas, “cities” comprise the first-named city in the MSA title and any other city in the title with a population of 100,000 or more. “Suburbs” make up the remainder of the MSA outside the primary city or cities.
5. George C. Galster, “The Mechanism(s) of Neighborhood Effects: Theory, Evidence, and Policy Implications.” Presentation at the ESRC Seminar, St. Andrews University, Scotland, UK, 4–5 February 2010.
6. The five-year estimates from 2007-2011 (the first to capture more years from the recession era than years from the previous expansion) were the first to show that more than half of all poor (50.8 percent) lived in concentrated disadvantage. For decades, the share of poor living in high poverty and extremely poor neighborhoods remained just above 40 percent (40.8 percent in 1970, 41.7 percent in 1980, and 43.5 percent in 2000). The exception was in the 1990 census, which showed 48.6 percent of the nation’s poor living in concentrated disadvantage after rapid increases in the 1980s. At 54.7 percent, the 2010-14 estimates reflect the highest recorded share of poor living in high poverty and extremely poor neighborhoods to date.
Authors


The Brookings Institution is committed to quality, independence, and impact.
We are supported by a diverse array of funders. In line with our values and policies, each Brookings publication represents the sole views of its author(s).