From urban renewal to highway expansion, metropolitan development in the United States has often come at the expense of long-term Black residents—either by the direct destruction of their homes or the slow push of rising costs and community dispersion. Now, that story is again playing out in the city of Detroit, where residents and practitioners have been holding their breath, waiting to see who benefits from a surge of new developments.
Today, downtown Detroit is nearly unrecognizable from previous decades, with new features such as the QLine streetcar system, a renovated Detroit Tigers ballpark, a riverwalk, and Campus Martius Park. Yet as surrounding neighborhoods appreciated in value with increased amenities and services, rising costs pushed out the mostly Black, longtime residents—excluding them from the benefits of development.
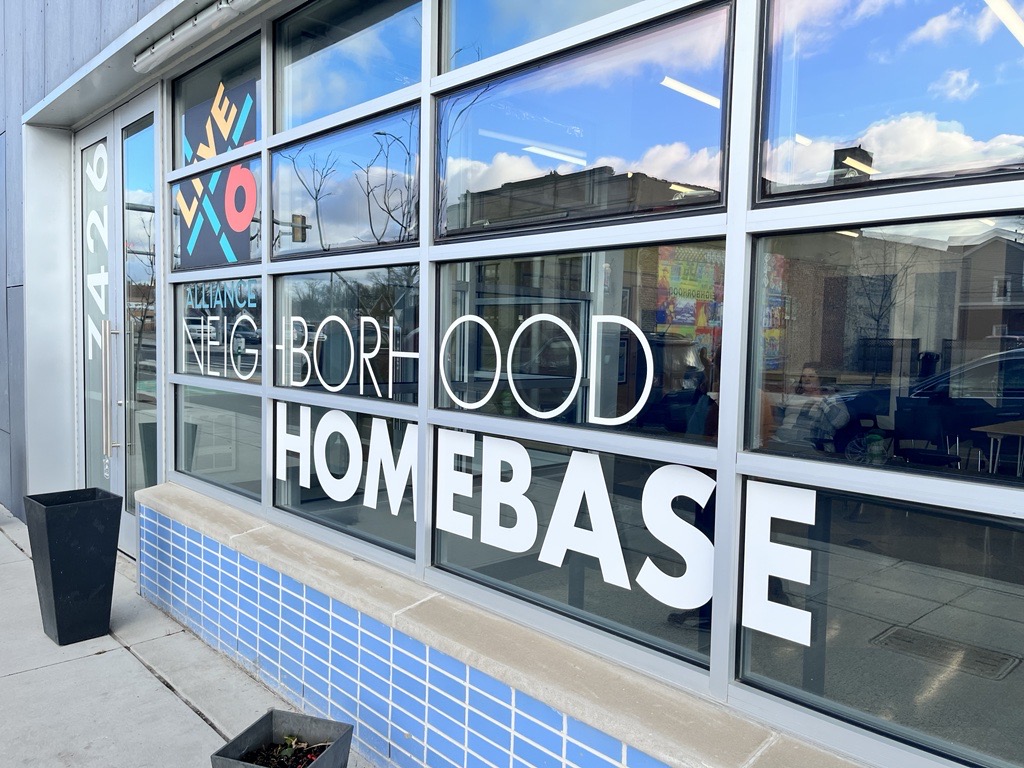
Consequently, many Detroiters see this downtown resurgence as a cautionary tale for our focus area, Livernois-6 Mile, also known as Livernois-McNichols—an area in northwest Detroit that has seen an uptick in investment since 2015.
In Livernois-6 Mile, new home and business owners drove recent population growth and positive change. Changes in the neighborhood’s physical condition are apparent: Renovated buildings, new streetscapes, a refurbished park, and improved greenways clearly mark recent boosts in investments from the city and philanthropic groups. Yet for many Black people in Detroit, such development is bittersweet after witnessing the displacement in downtown.
In this report, we explore demographic shifts among the five neighborhoods of Livernois-6 Mile relative to recent investments, and if such investment can enter a majority-Black neighborhood without displacing longtime residents. We briefly discuss key factors at play in the strategic development of Livernois, and end by providing thoughts on what investment practitioners should consider to avoid displacement in these neighborhoods and others.
A healthy neighborhood, an economic crash, and a resurgence
Long-term and former residents remember the Livernois-6 Mile area as an idyllic neighborhood, one that exemplified a golden era for the city’s Black middle class. There was a time when before the streetlights came on, children could be heard playing on streets lined with single-family homes. After the sun set, adults would gather at the popular Avenue of Fashion, which drew people from across the city to buy the latest threads. These insights—gathered from interviews with Livernois-6 Mile residents and other Detroiters—paint a picture of what we lose when we stop investing in our neighborhoods.
It felt like my childhood…It felt like the familiar thing that I wanted as an adult.
Chase Cantrell, homeowner and businessman
Two concurrent economic shocks—the 2007 housing crisis and the 2008 Detroit auto crisis—upended Livernois-6 Mile and the stability of its residents. In less than a decade, an area known for manicured lawns, block parties, and elaborate Christmas decorations became known for blight and vacancy. Businesses along Livernois Avenue closed and houses north and south of 6 Mile Road lay empty. From 2000 to 2010, the area’s population plummeted by 56%, going from 72,110 people to just under 32,000.
From 2015 to 2020, the area’s population rose by 2%—its first increase in two decades. When asked why he moved to Livernois-6 Mile in 2018, homeowner and businessman Chase Cantrell said, “It felt like my childhood…It felt like the familiar thing that I wanted as an adult.”
Despite the overall fluctuation in population, Livernois-6 Mile remained 90% Black. And while investment there has skyrocketed by 490% since 2010, median income has increased a modest 3%, to roughly $44,000 per household. In the same period, home occupancy rebounded to 77%, with a 56% homeownership rate and a gradual increase in residents’ educational attainment.
Methods
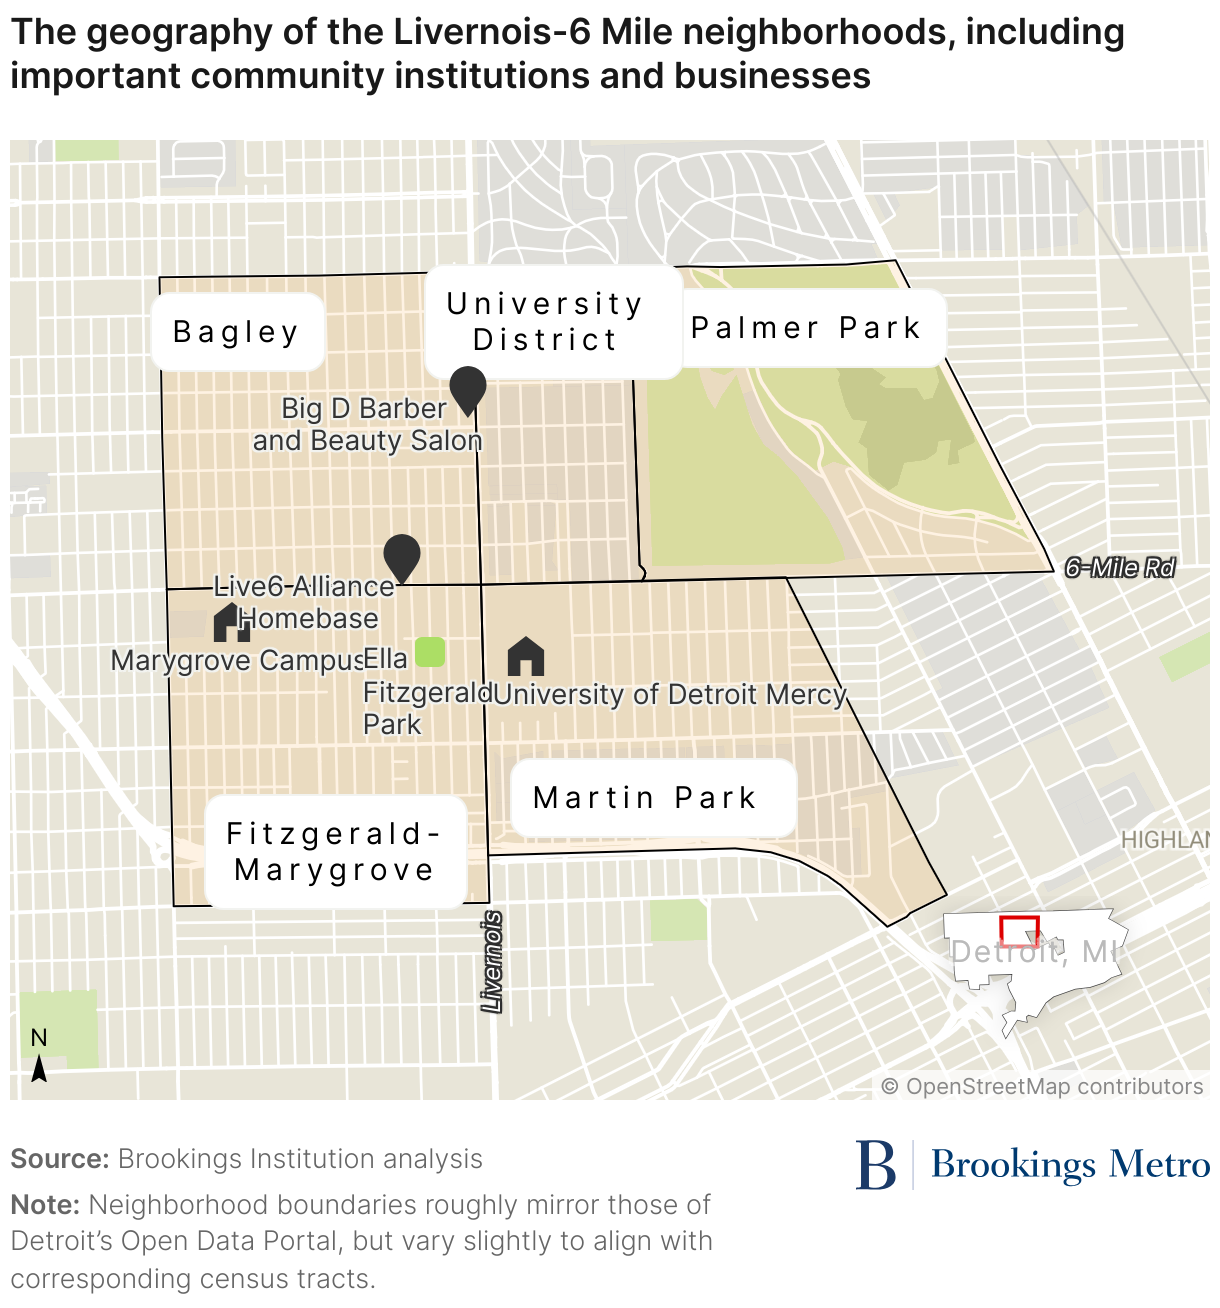
This report uses demographic and financial data from 2000 to 2020, aggregated to five-year increments within the census tracts of the five neighborhoods that comprise Livernois-6 Mile: Bagley, University District, Palmer Park, Fitzgerald-Marygrove, and Martin Park. Demographic data is pulled from 2005-2020 American Community Survey five-year estimates, and the 2000 decennial census provides demographic estimates for 2000 to 2005. Census tract boundaries did not change throughout the 20-year period.
We aggregated census-tract-level data into four time blocks: 2000 to 2005 (a period of stability); 2005 to 2010 (a steep economic decline); 2010 to 2015 (a period of further decline and stagnation); and 2015 to 2020 (a shift toward renewed investment).
In defining demographic variables, we considered neighborhoods’ racial makeup. We left out Latino or Hispanic identifications from the analysis due to their extremely low population in the area and high margin of error in the data set. Race is broken up into two categories: Black and non-Black, both of which are non-Latino racial groups. Non-Black populations consist of those who identify as white, Native American, Asian American, Pacific Islander, or other. Notably, the census did not track Middle Eastern and North African (MENA) or Arab American populations until 2020, instead coding these groups as white. Detroit has one of the highest MENA/Arab American populations in the nation and borders Dearborn, which is majority-MENA/Arab American. Therefore, the non-Black population of Livernois-6 Mile is likely a more diverse group than just Caucasian white residents.
We gathered additional economic and social indicators from corresponding census data, including median income, median rent, household occupancy and vacancy, educational attainment, and move-in years.
Measuring displacement
To study residents’ displacement after increased investment, many reports measure macro-level data to detect national patterns and micro-level data—such as in our study—to identify the unique variables at play in a given focus area. Our report looks at qualitative indicators of displacement as developed by previous practitioners, while providing supplemental interview data to understand what these data points truly mean to the residents experiencing them.
Based on previous literature, we measured displacement using a combination of indicators, including population change by race, homeownership, tenure of residents, changes in median income and rent, and changes in educational attainment—many requiring a component of localized comparison.
In their 2022 study on inclusive prosperity, Rohit Acharya and Rhett Morris identified several indicators of community displacement, including a 5% or greater decline in the Black and Latino or Hispanic population and a decline greater than one standard deviation compared to these racial groups’ national population changes. We applied these displacement indicators to the Livernois-6 Mile area, in contrast to population shifts across Detroit as a whole. As previous research has shown, the study of displacement inherently involves comparisons between one section of town with the region overall to see the context of demographic change.
A 2019 University of Minnesota report used a mixed-methods approach to study gentrification in Saint Paul and Minneapolis—highlighting home prices, median rent, and vacancies as additional indicators of displacement at the neighborhood level. And according to a systematic review of quantitative displacement studies, markers of displacement include homeownership rates in addition to changes in the racial and socioeconomic composition of a neighborhood—encompassing both income and educational attainment. A 2020 study by Zawadi Rucks-Ahidiana expanded the body of research on gentrification, emphasizing that displacement varies across different neighborhood types. In majority non-white areas such as Livernois-6 Mile, changes in educational attainment emerge as a consistent indicator of gentrification alongside shifts in racial demographics.
Measuring investment
We collected investment data following guidance from an Urban Institute report focusing on Detroit-specific financing. We tracked various types of funding, including community development financial institution (CDFI) funding; home loans sourced from the Consumer Financial Protection Bureau’s Home Mortgage Disclosure Act database (comprising conventional, Federal Housing Administration, and refinancing loans) for a 20-year period; and small business loans from the Federal Financial Institutions Examination Council database.
However, the picture of investment in Livernois-6 Mile is incomplete without tracking philanthropic investments. We acquired an estimate of philanthropic giving through informational interviews with key funders in the area, including the Live6 Alliance, Invest Detroit, and the Kresge Foundation. During this process, we engaged seven community stakeholders to acquire neighborhood-level funding estimates, which we aggregated to the projects’ corresponding five-year period based on when funding was allocated.
Lastly, holistically measuring displacement and investment requires qualitative feedback from community members. For feedback and clarification, we interviewed community members and stakeholders who have lived and/or worked in the five Livernois-6 Mile neighborhoods, including three business owners, three former residents, and three current residents. Some of these respondents worked in organizations that directly invested in the area, while others were witnesses to its decades of change. Our list of questions asked about their lived experiences and perceptions of change in the neighborhood.
Data findings: How investment and displacement changed in Livernois-6 Mile
The first component in measuring displacement is the movement of people in and out of Livernois-6 Mile, measured through demographic change, the vacancy and homeownership rate, and legacy residency. (A “legacy resident” is defined as someone who moved in prior to 2010.) The second component is the change in affordability, which we examine through median income and median rent. The last component, social change, is captured by shifts in educational attainment.
You had so many families with children, and we were able to go outside and play and have race and tag up and down the street.
Stephanie Harbin, legacy resident of Fitzgerald-Marygrove
Throughout the 20-year study period, Livernois-6 Mile remained over 90% Black despite overall losses in population, and as of 2020, retained 41% of legacy residents. Homeownership rates stayed largely unchanged—the largest variation between periods was 3%. Since the onset of investment in 2015, vacancies declined as people moved in, but median income and rent did not spike. Educational attainment gradually increased over the 20-year period, yet the lack of significant change when compared to citywide variation—an 8% increase in residents who attained a bachelor’s degree or higher—indicates that rebounding investment did not economically or socially displace the residents of Livernois-6 Mile.
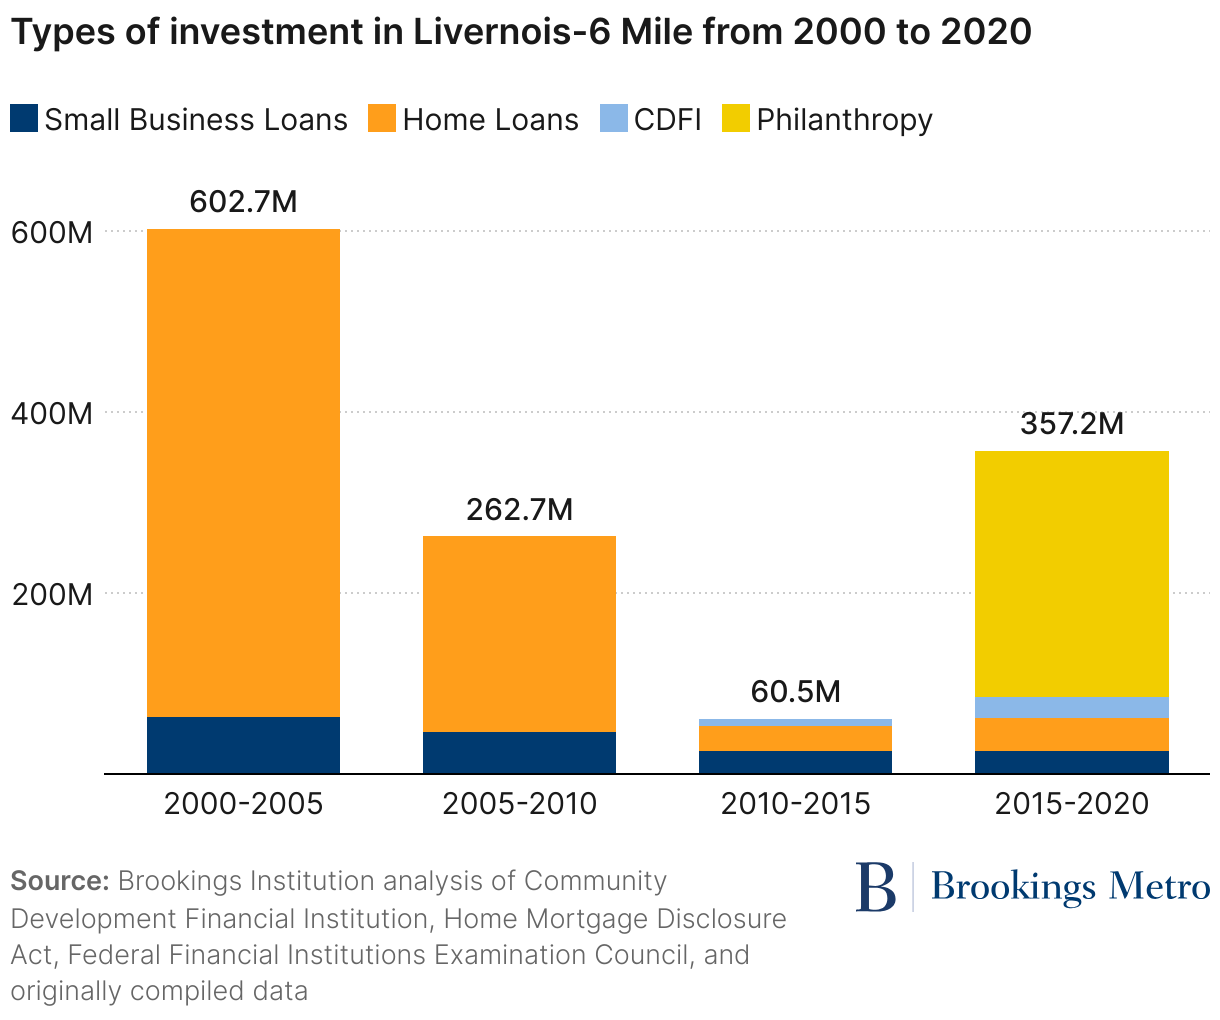
In terms of investments, home loans made up 90% of investments from 2000 to 2005, with the rest consisting of 1,804 small business loans.
Those who filled these homes made the neighborhood a flourishing community. When describing Livernois-6 Mile before the economic downturn, Stephanie Harbin, a legacy resident of Fitzgerald-Marygrove, said, “You had so many families with children, and we were able to go outside and play and have race and tag up and down the street.” And Lauren Hood, a former resident of Bagley, proudly said, “It was clean, it was safe. We were happy. I didn’t feel like there were things we didn’t have.”
Subsequently, in the period of declining investment between 2005 and 2010, home loans remained the dominant form of investment, at 82%. But the overall investment amount decreased to less than half of the previous period. And from 2010 to 2015, investment was one-tenth of the investment at the turn of the century. A small amount of philanthropic dollars entered the area during this period; the one and only CDFI loan made up 12% of investment.
After 2015, overall investment surged, but funding sources shifted from mostly home loans to business- and infrastructure-focused philanthropy. From 2015 to 2020, mission lending and philanthropic contributions made up a substantial 83% of the total investment dollars in Livernois-Six-Mile, while home loans made up only 10%.
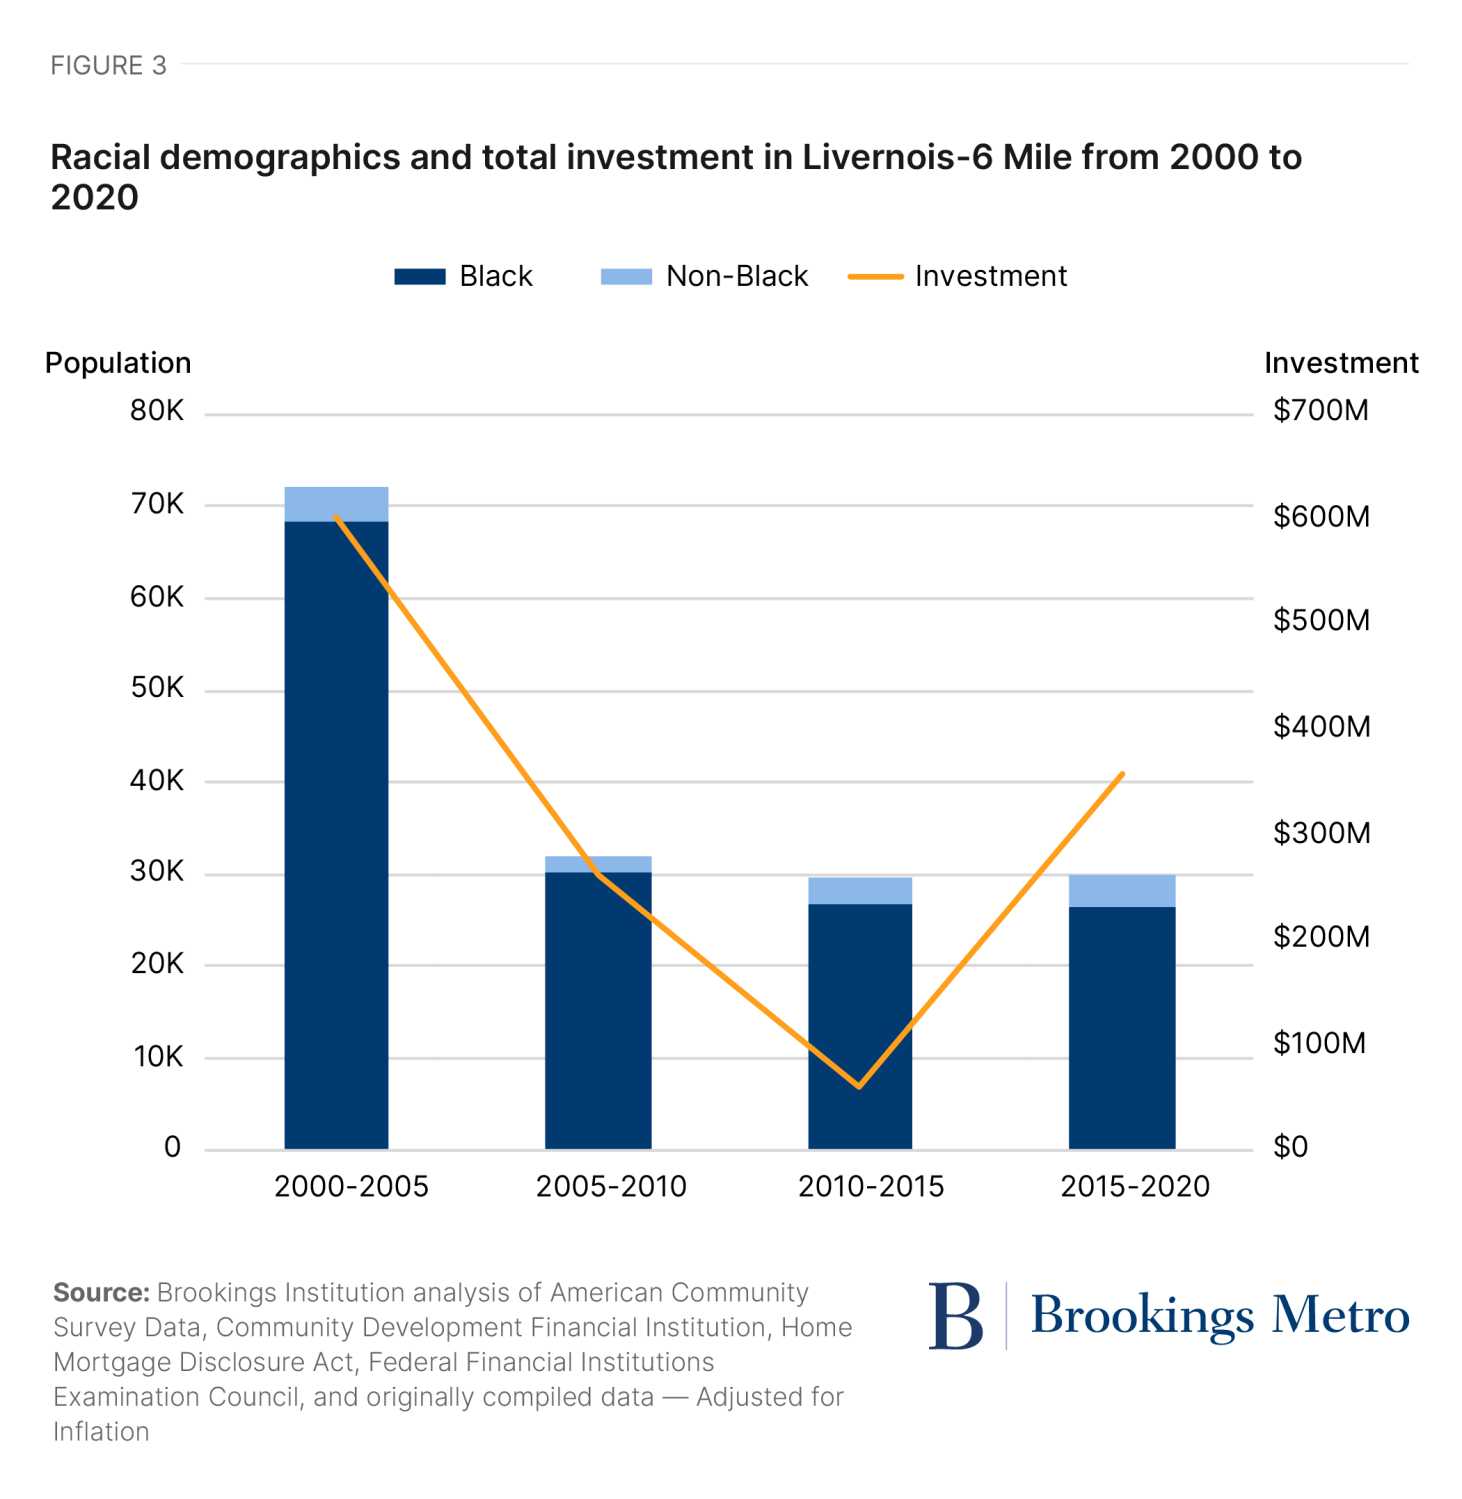
The relationship between the loss of investment and the loss of people corroborates that the neighborhoods of Livernois-6 Mile lost most of their Black residents due to divestment after 2005, as did most of Detroit. At the start of the century, Livernois-6 Mile had 72,110 residents and was 95% Black. Over the next two decades, the proportion of Black residents dropped less than 5%, even as the overall population fell significantly. In 2020, the Black population made up 90% of the nearly 30,000 residents, with most non-Black residents concentrated in the University District and Martin Park neighborhoods on the east side of Livernois-Six-Mile.
Comparatively, Detroit’s population also dropped over the 20-year study period, from over 951,000 people to roughly 639,000. Following Acharya and Morris’ model, we compared five-year change rates to the standard deviation of population and demographic changes through the entire city. The economic downturn devastated the Livernois-6 Mile area, and populations of all racial groups there declined significantly more than that of the broader city from 2000 to 2010. However, looking at changes in the following decade, Livernois-6 Mile’s overall population and Black resident shifts remained within the standard deviation for Detroit—the first indicator that displacement did not occur in tandem with renewed investment.
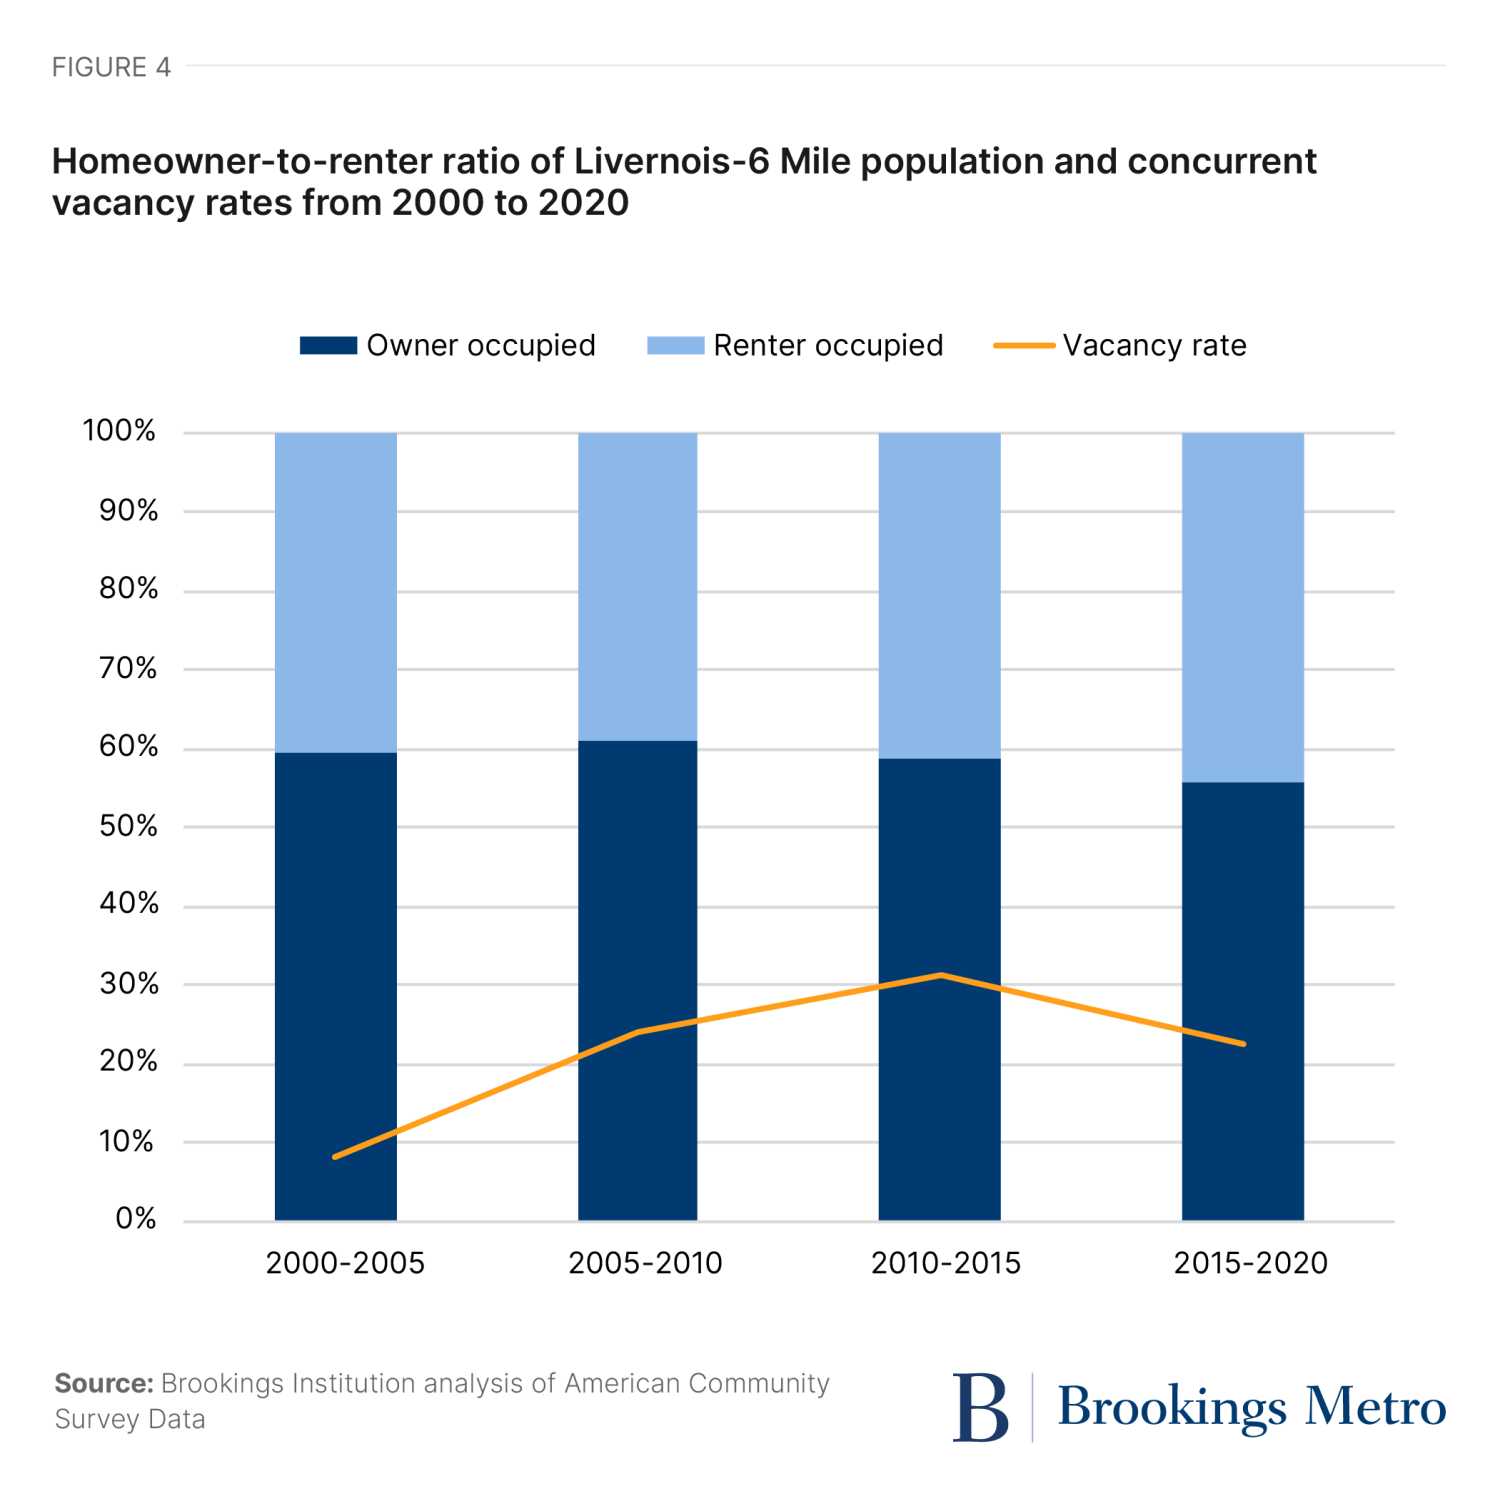
During Livernois-6 Mile’s 2000-to-2005 peak for both population and home loan activity, the occupancy rate stood at 92% and the homeownership rate reached 59%. In the following 10 years, vacancy rates increased, reaching a peak of 31%. In our interviews, participants frequently mentioned blight and vacancy in reference to this period. Residents who grew up in the area recounted the sadness they felt as homes were left empty. Jermaine Ruffin, vice president of Invest Detroit, mentioned the demolition of homes, saying, “There is an emotional toll and impact that takes place…when you have all those memories attached to these physical spaces that are no longer existing, and those families that lived in those homes.”
The loss of people and investment took a toll on the community. During our interviews, every former resident mentioned a loss of safety and a rise in violent crime as reasons their family left the area.
“One of the reasons that we moved was a safety issue,” said Wanda Paige, who had lived in Livernois-6 Mile her entire life before moving out of state. “My parents were elderly at that point. And it just was scary.” Another former resident shared that her parents were the victims of a home invasion: “The level of violence associated with a home invasion, I think it just caught me, my mom, and dad off guard. So they left the neighborhood and moved to the suburbs at that point.”
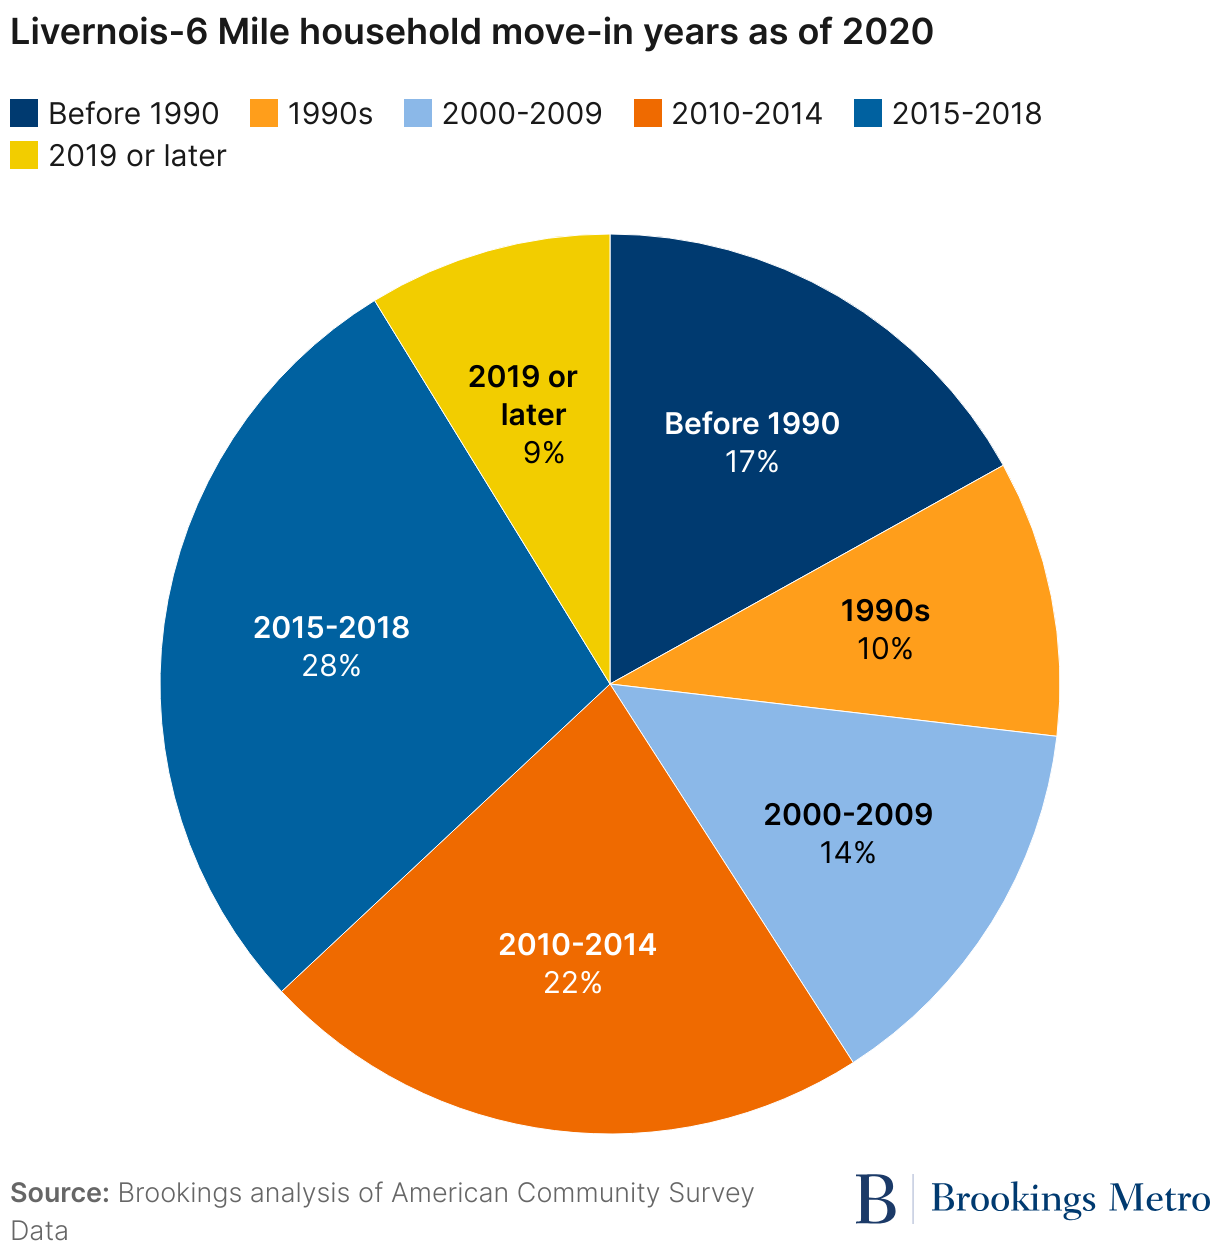
Still, many legacy residents remained, and between 2015 and 2020, these durable occupants made up 41% of households in Livernois-6 Mile. Although it had been changed and strained, the neighborhoods retained a sense of “community”—a word interview participants frequently mentioned in reference to the vibrancy of their past community, the loss of community members after the economic downturns, the presence of community organizations, and even the feeling of community that remains today. For legacy resident Stephanie Harbin, community is why she remains in the neighborhood: “That’s the reason why I’m still here now, because I want to be part of this community, I want to see it better for our children, for our seniors, even for myself.”
Measuring displacement: Affordability and social change
With many of Livernois-6 Mile’s legacy residents choosing to remain in the area, the question then becomes: Can they continue to afford to live there amid increased investment?
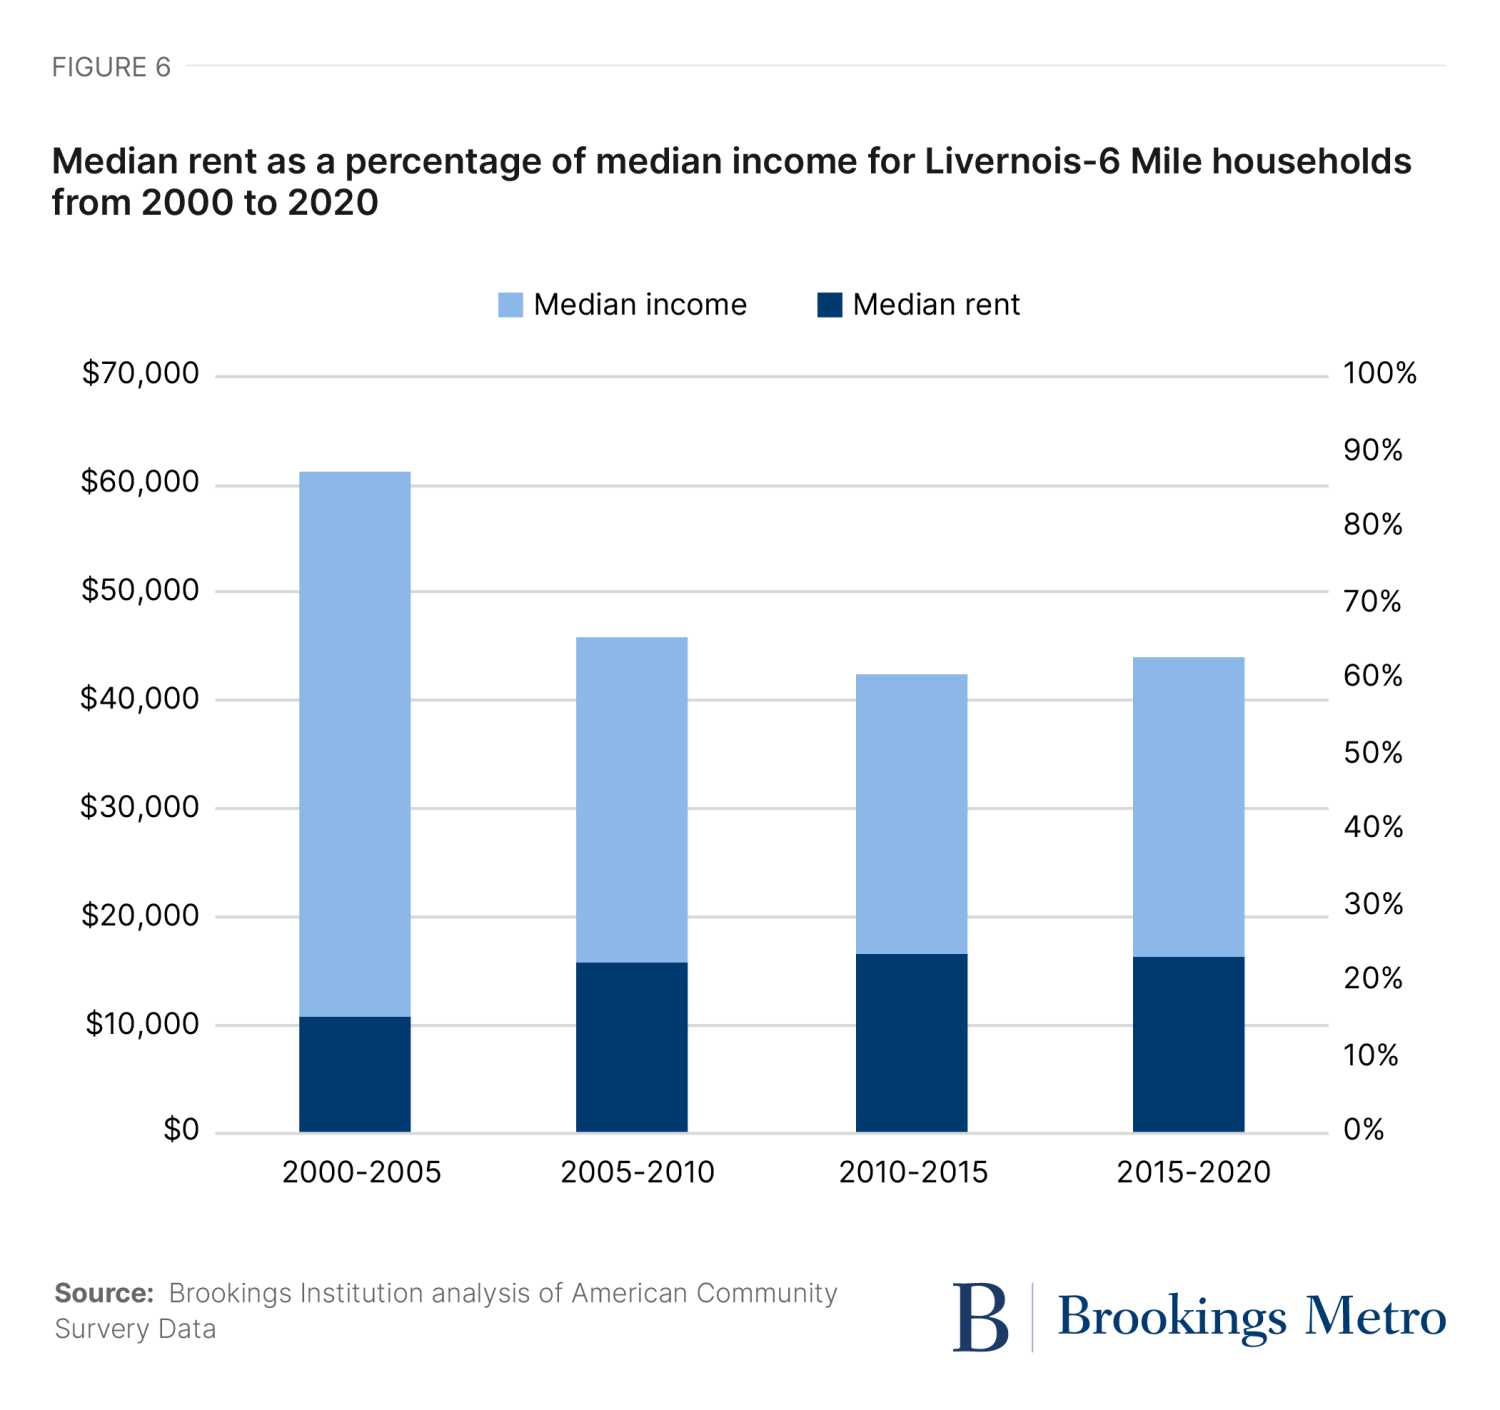
Median income—a key indicator of investment-induced displacement—decreased in Livernois-6 Mile from 2000 to 2020, from approximately $61,000 to $44,000 in 2020 inflation-adjusted dollars. As with demographic changes, we compared these shifts to citywide standard deviations. From 2000 to 2020, median income in Detroit overall declined, with a standard deviation of 13%. From 2005 to 2010, median income in Livernois-6 Mile declined by 25%—another indicator that the economic downturn hit these neighborhoods particularly hard.
Between 2010 and 2020, median income in Livernois-6 Mile increased by 3%, while it increased 16% across Detroit overall. Therefore, changes in median income do not indicate investment-induced displacement in the 2015-to-2020 period, but reconfirms that the loss of investment and people between 2005 and 2010 caused significant changes to the socioeconomic realities of Livernois-6 Mile residents.
Across Livernois-6 Mile neighborhoods, the average median rent in 2020 inflation-adjusted dollars steadily increased throughout the study period. This trend follows that of rental prices nationally, and indicates that Livernois-6 Mile is not insulated from the growing gap between median income and median rent throughout the country. Figure 6 shows median rent as a percentage of median income, both adjusted for inflation. At the beginning of the study period, median income was at its highest and rent at its lowest—indicating that rent was most affordable during this time. Despite the economic shifts, median rent remains below the critical 30% line of median income.
To understand social change in Livernois-6 Mile, we categorized educational attainment for residents age 25 and older into three groups: 1) individuals without a high school diploma or an equivalent; 2) those with a high school diploma; and 3) those with a bachelor’s degree or higher.
From 2000 to 2020, the number of high school and college graduates in Livernois-6 Mile consistently rose. The area’s increase in individuals with a bachelor’s degree did not exceed Detroit’s standard deviation of 8%, which indicates that this social change is widespread and not an indicator of investment-induced displacement. Put simply, well-educated, wealthy people are not overtaking legacy residents, and instead Detroit and Livernois-6 Mile are becoming more educated across the board.
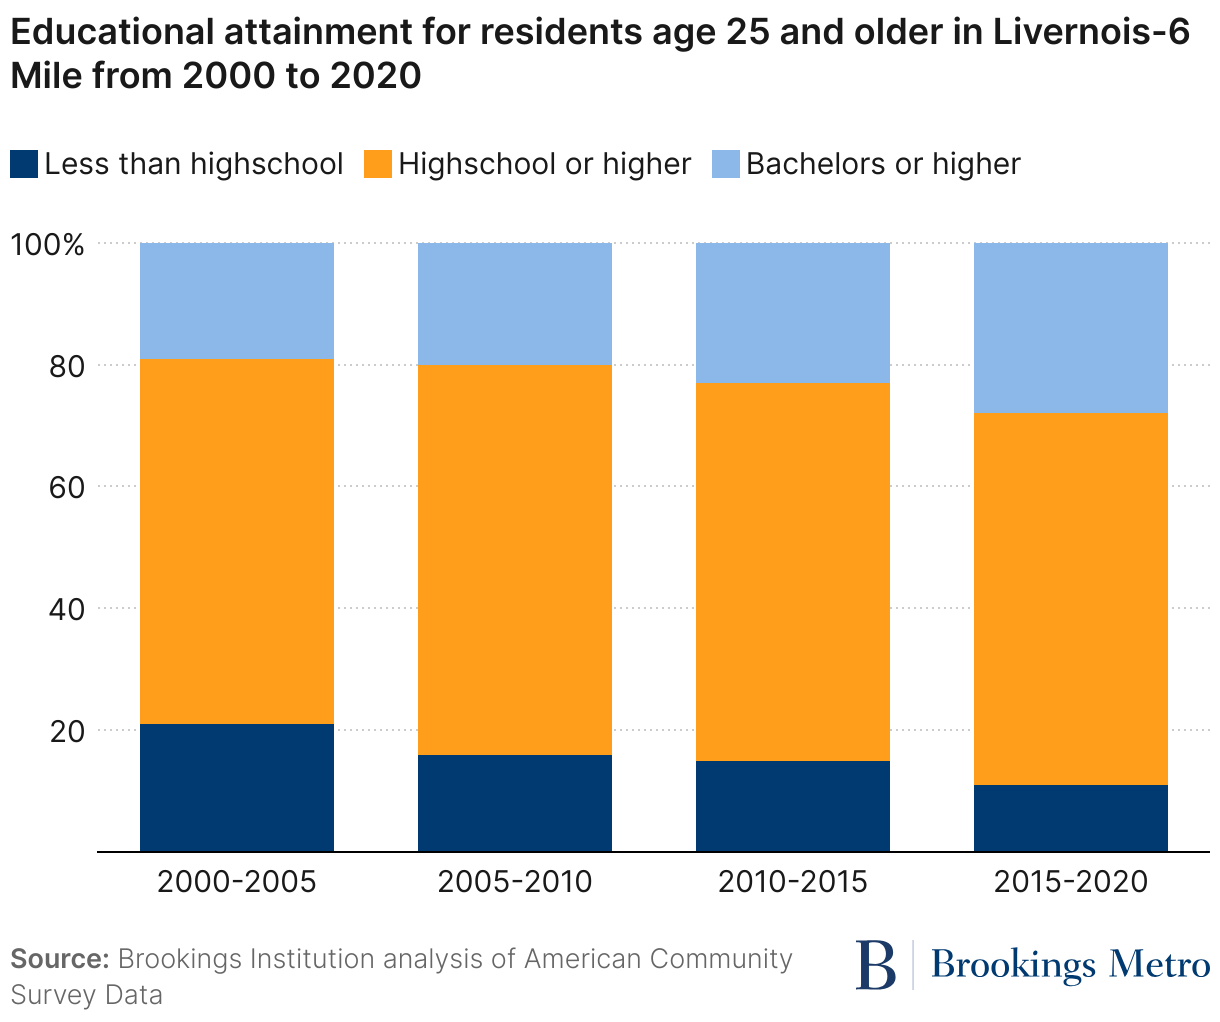
The steady growth in the proportion of college and high school graduates from 2000 to 2020 suggests that this trend isn’t inherently linked to increased investment, but does indicate the importance of long-standing investments in higher education in Livernois-6 Mile. Until the final year of the study period, the area was served by two higher education institutions: Marygrove College and the University of Detroit Mercy (UDM). However, Marygrove College ceased operations in 2019; the Kresge Foundation is now retrofitting the campus into an educational hub for pre-K to bachelor’s degree students.
Data findings: How different neighborhoods changed
Although connected by a blossoming commercial corridor and newly installed greenway, the neighborhoods in Livernois-6 Mile are distinct, many with their own block clubs, housing stock, and community identities. Bagley remained the most populated neighborhood yet lost its standing as the most invested-in, while Fitzgerald-Marygrove—which saw extensive vacancies—ended up receiving 72% of all CDFI loans after 2010. University District saw the largest proportion of non-Black resident growth, and Martin Park, which houses UDM, lost the largest proportion of legacy residents. Finally, Palmer Park stands out for being mostly a public park and private golf course, while housing the largest rental community with the lowest median income. Given the differences in these neighborhoods, their responses to rebounding investment varied as well.
Map 1Demographics and investment
Source: Source: Brookings Institution analysis of American Community Survey Data, Community Development Financial Institution, Home Mortgage Disclosure Act, Federal Financial Institutions Examination Council, and originally compiled data.
Notes: Adjusted for inflation.
The Bagley neighborhood remains the largest in terms of residential population, with many tree-lined streets and brick-faced single-family homes. Fitzgerald-Marygrove and Martin Park have fluctuated between the second- and third-most populated throughout the study period; these neighborhoods have less uniform housing stock and hold the campuses of Marygrove College and UDM as well as Ella Fitzgerald Park. University District is relatively small, never having more than 7,000 residents; despite an initial population decline at the beginning of the study period, it grew steadily from 2005 to 2020. Palmer Park is the least populated neighborhood and hasn’t seen much change—oscillating around 2,000 residents from 2005 to 2020. This neighborhood is geographically made up of mostly green space, and most residents live in a small section of apartments.
Residents in each neighborhood experienced a variety of demographic changes. While the overall Livernois-6 Mile area witnessed only slight declines in the proportion of Black residents over the 20-year study period, University District and Martin Park saw a more significant decline in the Black share of the population, down to 72% and 86%, respectively. As one of the smaller neighborhoods, University District might be particularly impacted by this demographic shift—potentially leading to distinct cultural or social differences compared to the surrounding area. Moving eastward, Palmer Park experienced fluctuations but ultimately saw an increase in the proportion of Black residents, which reached 92% in the 2015-to-2020 period.
On the west side of Livernois-6 Mile, the most densely populated neighborhoods continued to be predominantly Black. Bagley’s racial composition fluctuated but consistently remained over 94% Black throughout the study period, while Fitzgerald-Marygrove consistently maintained a Black population between 97% and 99%.
Understanding investment patterns at both the neighborhood and census tract level presents challenges, primarily because philanthropic investments were focused on thoroughfares crossing neighborhoods or allocated to multiple locations within the Livernois-6 Mile area. However, we know that among the total CDFI loans disbursed, 72% were directed to the Fitzgerald-Marygrove neighborhood. This allocation facilitated the development of Ella Fitzgerald Park, a greenway walking path, and the revitalization of 13 homes.
Private lending varied slightly across neighborhoods as well. Home loans were concentrated mainly in Bagley and University District during the first decade of the study period, but declined for all neighborhoods after 2010. In Bagley, the impact of previous investments remains visible today through distinctive differences in housing stock compared to other neighborhoods.
The amount of small business loans was more evenly distributed across the area in the first five-year period. Although Bagley received the highest amount of small business investment, Fitzgerald-Marygrove and Palmer Park closely followed suit. These investments then decreased similarly across neighborhoods, with a significant spike in Martin Park, rising from 141 loans totaling $3.9 million between 2010 and 2015 to 244 loans totaling $11.5 million between 2015 and 2020. By contrast, in Bagley—historically the investment hub—small business loans totaled only about $5 million between 2015 and 2020.
Neighborhood changes: Legacy residents, homeownership, and vacancy
Map 2Legacy residents and homes
Source: Source: Brookings analysis of American Community Survey Data, 2000-2020.
Notes: *Legacy residents are those who moved in befoe 2010 (to measure how many people have stayed in the area)
Bagley and University District have maintained the largest proportion of legacy households. University District, interestingly, has also had the largest proportional racial demographic shift, indicating that its non-Black residents are likely newer to the neighborhood. Notably, 74% of Palmer Park households moved in during the 2015-to-2020 period.
Vacancy rates increased across most Livernois-6 Mile neighborhoods from 2000 to 2015, with the exception of University District, where vacancies slightly declined from 2010 to 2015. In Palmer Park, over 50% of homes were vacant from 2015 to 2020; the neighborhood had a homeownership rate of 7%, the lowest overall. Our analysis identified a noteworthy negative correlation between homeownership and vacancy rates in the Livernois-6 Mile area. Neighborhoods such as Bagley, with high homeownership rates, saw significantly fewer vacancies over time. Scholars studying displacement have observed that renters are often more susceptible to the impacts of neighborhood changes, which appears to be manifesting in Livernois-6 Mile.
From 2015 to 2020, vacancies decreased across the board in Livernois-6 Mile, including a comeback story in Palmer Park, where vacancies dropped by 13 percentage points while homeownership increased by 5%.
Neighborhood affordability and social changes: Median income, median rent, and educational attainment
Map 3Income, rent, and education
Source: Source: Brookings analysis of American Community Survey Data, 2000-2020.
From 2015 to 2020, University District had the highest median income among Livernois-6 Mile neighborhoods, at just under $80,000 per household; all the other neighborhoods had median incomes at nearly half that level. Over the entire study period, adjusting for inflation, median incomes in all neighborhoods decreased, with the most significant drop observed in University District (38%). Concurrently, rental prices increased by 20% in this neighborhood. Interestingly, rental prices in University District did not reach their peak after the investment spike, but rather showed a steady rise from 2000 to 2015, and slightly decreased from 2015 to 2020.
I remember when I started to initially engage people around the fact that there was this new organization in town doing community development, people explicitly said, ‘Don't make us like Midtown.’
Former resident and community developer
Conversely, Palmer Park exhibits both the lowest median income and the lowest median rent. Fitzgerald-Marygrove also maintains relatively low rental prices for the area, although it has seen considerable fluctuations. Rental rates peaked in the 2005-to-2010 period, dropped notably from 2010 to 2015, and rose again to approximately $785 per household per month in the last five years of the study period. Despite these fluctuations, rent in the Livernois-6 Mile area remains considerably lower than the national average.
Finally, educational attainment increased across all neighborhoods during the study period, with University District maintaining the highest proportion of residents with bachelor’s degrees or higher. However, Palmer Park witnessed the most significant change in residential education, with a substantial increase in residents holding bachelor’s degrees or higher in the 2015-to-2020 period.
The demographic, financial, and educational changes in these neighborhoods still do not make the case for displacement, but do show that residents might be experiencing social changes in different ways as people move back into the area. During our interviews with residents, displacement was mentioned a total of five times without prompting, and the word “gentrification” was never explicitly mentioned. Multiple interviewees mentioned being wary of changes that would bring more demographic change or take away the character of the neighborhood. One former resident and community developer recounted, “I remember when I started to initially engage people around the fact that there was this new organization in town doing community development, people explicitly said, ‘Don’t make us like Midtown.’” These kinds of comments reflect the fear many legacy residents and Detroiters in general have around investments that do not include or value them.
Investing in people, not just place
I really hope as a Detroiter, that all of [the investment] can happen without losing the flavor and character of the neighborhood.
Amanda Paige, former resident and community advocate
The Livernois-6 Mile area stands out because development looks different there than it has in other historically Black neighborhoods. Black residents are staying, and more are moving in.
Almost every person we interviewed used the word “hope” when discussing the area’s current or future situation. Investment-induced changes are not complete, yet neighborhood residents are cautiously optimistic about what is to come. One former resident and community advocate, Amanda Paige, summed up this hope by saying, “I really hope as a Detroiter, that all of [the investment] can happen without losing the flavor and character of the neighborhood.” Such a sentiment signals that intentionality in future investments is crucial.
To pursue that intentionality and center people in investment in Livernois-6 Mile and beyond, we recommend:
- Creating educational and employment opportunities with local postsecondary institutions.
- Including long-standing community organizations in the investment planning process.
- Investing in affordable housing and homeownership.
- Paying attention to neighborhood dynamics and protecting legacy residents.
Our analysis did not find investment-induced displacement in Livernois-6 Mile; rather, the largest displacement was due to the loss of investment between 2005 and 2015. The area remained overwhelmingly Black, with no significant spikes in median income.
However, increases in median rent and educational attainment may indicate a future loss of affordability and social change, especially around UDM. The role of this higher education institution is noteworthy given its facilitation of philanthropic investment to the area via the Live6 Alliance, which organized the community and funders around physical neighborhood changes such as Ella Fitzgerald Park. UDM also plays a part in shaping the social dynamics of Livernois-6 Mile, for better or worse. One interviewee mentioned tension between residents and the campus, stating that admissions officers “don’t encourage [students] to go to the businesses on Livernois. They encourage them to go to Ferndale.” In any event, educational institutions will continue to be important to the social, financial, and physical characteristics of the area.
There definitely is a community here, a very strong, active community. The Bagley Community Council, other neighborhood improvement associations, block clubs like this—this is a very active community. And being able to plug into those resources is actually easier here than in some other places.
Current resident and lifelong Detroiter
Another key component of investment outcomes in Livernois-6 Mile appears to be its long-established block clubs, which consulted during the investment planning process. Half of our interviewees described block clubs as assets to community development. Yet one former resident mentioned not feeling connected to block clubs as a kid, while another said she had noticed a decrease in block clubs, but that the remaining ones played essential roles. A current resident and lifelong Detroiter stated that the area’s block clubs stood out compared to other areas of the city: “There definitely is a community here, a very strong, active community. The Bagley Community Council, other neighborhood improvement associations, block clubs like this—this is a very active community. And being able to plug into those resources is actually easier here than in some other places.”
Additionally, it is critical that future investments focus on housing in a similarly intentional manner than that of the latest business and infrastructure investments. Rebounding investment has mostly been made up by philanthropic dollars focused on business development, yet home loans never returned to their former peak from the 2000-to-2005 period, when they made up 90% of all investments. By the 2015-to-2020 period, the ratio of the number of business loans to home loans was 5 to 1. Initial plans for revitalization in Fitzgerald-Marygrove aimed to renovate 100 homes along with the construction of Ella Fitzgerald Park, but only 13 homes were completed, due in part to challenges during the COVID-19 pandemic. For residents, this gap leaves much to be desired, especially south of 6 Mile Road, which had less housing investment prior to the economic downturn.
The neighborhoods within Livernois-6 Mile are experiencing changes differently. Although there is no indication of displacement overall, local practitioners should keep an eye on the demographic shifts in Martin Park and University District, and take steps to protect legacy residents, especially from rising rental prices. It is also crucial to continue to foster social networks and community organizations in these neighborhoods to protect from further cultural displacement.
Bagley is notable as the area’s most stable neighborhood, with large numbers of legacy residents, a lower vacancy rate, and active block clubs. Resources should be allocated to help older residents there age in their homes. Similarly, Fitzgerald-Marygrove still has a large population of legacy residents and active block clubs that should be fostered and resourced, but this neighborhood has seen many more vacancies. Investments should continue to go toward revitalizing homes in order to bring in residents while preserving the culture of the neighborhood.
In a single decade, investment in Livernois-6 Mile increased by nearly 500%, yet still did not reach the level of investment it once had. These rapid and extreme changes have an emotional and cultural impact, not just physical or fiscal. As people move back to Livernois-6 Mile, it is important to remember the original assets of these neighborhoods: the people. In the words of our local interviewer, Orlando Bailey, “We have to love the people more than we love the capital return.” Because people are what truly make a neighborhood.
Authors


The Brookings Institution is committed to quality, independence, and impact.
We are supported by a diverse array of funders. In line with our values and policies, each Brookings publication represents the sole views of its author(s).