

Executive Summary
The release of institution-level earnings information as part of the Obama Administration’s new College Scorecard data has already spawned new “value-added” rankings based on the economic outcomes of students who attended similar institutions. These emerging rankings are an improvement on simple unadjusted rankings, but the wide variance within and among these rankings prompt questions about the precision of this methodology.
We propose a value-added model that parallels a type of value-added model commonly used in K-12 education—one that examines the same metric over time. Just as K-12 value-added models use growth in student achievement to assess teacher impacts, the most compelling value-added model for higher education institutions tracks student earnings from prior to enrollment to after leaving college.
We demonstrate the feasibility of this method by calculating an economic mobility indicator for two groups of students: the mostly older students who were independent for federal financial aid purposes, and the younger students who filed as dependents. We find substantial variation in economic mobility across colleges, including among colleges where students come from similar socioeconomic backgrounds.
An economic mobility ranking provides a more conceptually streamlined approach than many existing ranking methods, but doing it well requires more detailed data than are currently available. The most important limitations of current data are: 1) they report family income prior to college but individual data after, and 2) they report income prior to college for all federal aid recipients but only report earnings after college for former students who are employed. We recommend that the next release of College Scorecard data facilitate economic mobility rankings of colleges by reporting more detailed earnings breakdowns that address these limitations.
Introduction
New data released by the U.S. Department of Education on the earnings of former students at thousands of U.S. colleges and universities have already begun to make their way into college rankings. An increasingly popular ranking methodology is to calculate each college’s “value add” by comparing the outcomes of similar colleges. But for a value-added metric to work well, it needs to be grounded in a clear conceptual model, the right analytical tools, and appropriate data. An economic mobility ranking based on improved earnings data would fit the bill.
The new earnings data, published as part of a revised College Scorecard, reveal the average economic success of federal aid recipients who attended thousands of postsecondary institutions across the country, ranging from elite research universities to beauty schools. (For more background on the new Scorecard, see the previous report in this series by Whitehurst and Chingos.[i])
In late October, The Economist published its first-ever college rankings and the Brookings Institution’s Jonathan Rothwell issued an updated ranking based on the new Scorecard data.[ii] Both rankings rely on earnings data from the new College Scorecard to rank colleges based on measures of their impact, or value add, on student earnings. The typical value-added methodology uses regression analysis to compare the average (or median) earnings of a cohort of college attendees relative to attendees of other colleges with similar characteristics, such as test scores, graduation rates, degrees offered, and demographics.
The adjustments made by value-added methods are usually better than making no adjustments at all. Non-value-added rankings tend to be biased in favor of more selective colleges, which admit academically well-prepared students who are likely to be successful regardless of where they go to college. Value-added rankings attempt to mitigate this bias by comparing the outcomes of colleges that enroll similar students.
But how close value-added rankings come to making accurate and fair comparisons among colleges depends on how well the data capture differences across campuses in the student characteristics most likely to affect earnings after college. For example, the absence of a consistent measure of academic preparation across all colleges is a key challenge to ranking colleges based on the quality of the service they provide. A careful examination of the limitations of existing federal data, including the new Scorecard, raises the question of what else is needed to do value-added better.
A value-added model is most compelling when it tracks the same indicator over time. In K-12 education, value-added modeling is frequently used to measure the effects that individual teachers have on their students’ test scores. A significant body of research shows that these models generally work well in part because they track the same outcome—test scores—over time.[iii] K-12 education datasets do not capture detailed socioeconomic data on students, but, for the purpose of measuring teacher effects, the test score from the end of the prior school year serves as a very good proxy for students’ family background and other unmeasured characteristics.
Put simply, K-12 teacher value-added models work because last year’s test score is the best predictor of this year’s test score, much as yesterday’s weather is the best predictor of today’s weather. In higher education, the earnings of former students are an outcome of great interest, both as a measure of real-world importance and given the lack of other outcome data such as standardized measures of student learning.
Conceptually, it is straightforward to imagine an economic mobility ranking of colleges based on how their students’ incomes change after going to college. Such a ranking would track the earnings of students from before they entered college through a number of years after matriculation (or graduation). This ranking could also take into account other student characteristics, but the conceptual core of the value-added model would be to track earnings over time and reward the colleges where attendance coincides with economic prosperity down the road.
Existing rankings do this to some degree. The Economist ranking includes the percentage of Pell grant recipients as a socioeconomic indicator.[iv] The Brookings ranking includes average family income (from the new Scorecard data) in the value-added model, although this measure combines the household incomes of older independent students with previous careers with the parental incomes of younger students—two substantially different constructs.[v]
Constructing an Economic Mobility Ranking
The new College Scorecard provides some but not all of the tools needed to carry out an economic mobility ranking of colleges. The main thing it does well in this regard is to separately report data for students who are considered “dependent” for financial aid purposes, all of whom are less than 24 years old and are required to include their parents’ income in their financial aid application, from “independent” students, most of whom are 24 or older and do not report their parents’ income.
These two groups of students must be considered separately for the purpose of tracking earnings growth over time, as their pre-college earnings data are very different in terms of whether they include parent income. For the purpose of constructing an economic mobility ranking, the case of independent students is more straightforward—they report their personal household income prior to entering college, rather than their parents’. Independent students make up a majority of students receiving federal aid at 31 percent of the two-year colleges and 84 percent of the four-year colleges in the Scorecard data.[vi]
The problem with using Scorecard data to compare the economic mobility of independent students is that the earnings measures are not defined in the same way before and after college, nor are they reported for the same group of people. Pre-college earnings are from the FAFSA and include the student’s earnings and those of her spouse, whereas post-college earnings only include the former student’s own earnings.[vii] Furthermore, while pre-college earnings are measured for all recipients of federal aid, post-college earnings are only measured for those working and not enrolled in school.
These data limitations render comparisons of specific colleges potentially misleading. But we can use the Scorecard data to illustrate what economic mobility indicators might look like. For independent students, we examine the average pre- and post-college earnings over a 10-year window for the 2001 and 2002 entering cohorts. We exclude the small number of colleges where fewer than half of independent students were working and not enrolled 10 years after beginning college. We focus on the colleges that primarily award associate and bachelor’s degrees (1,074 and 1,194, respectively).[viii]
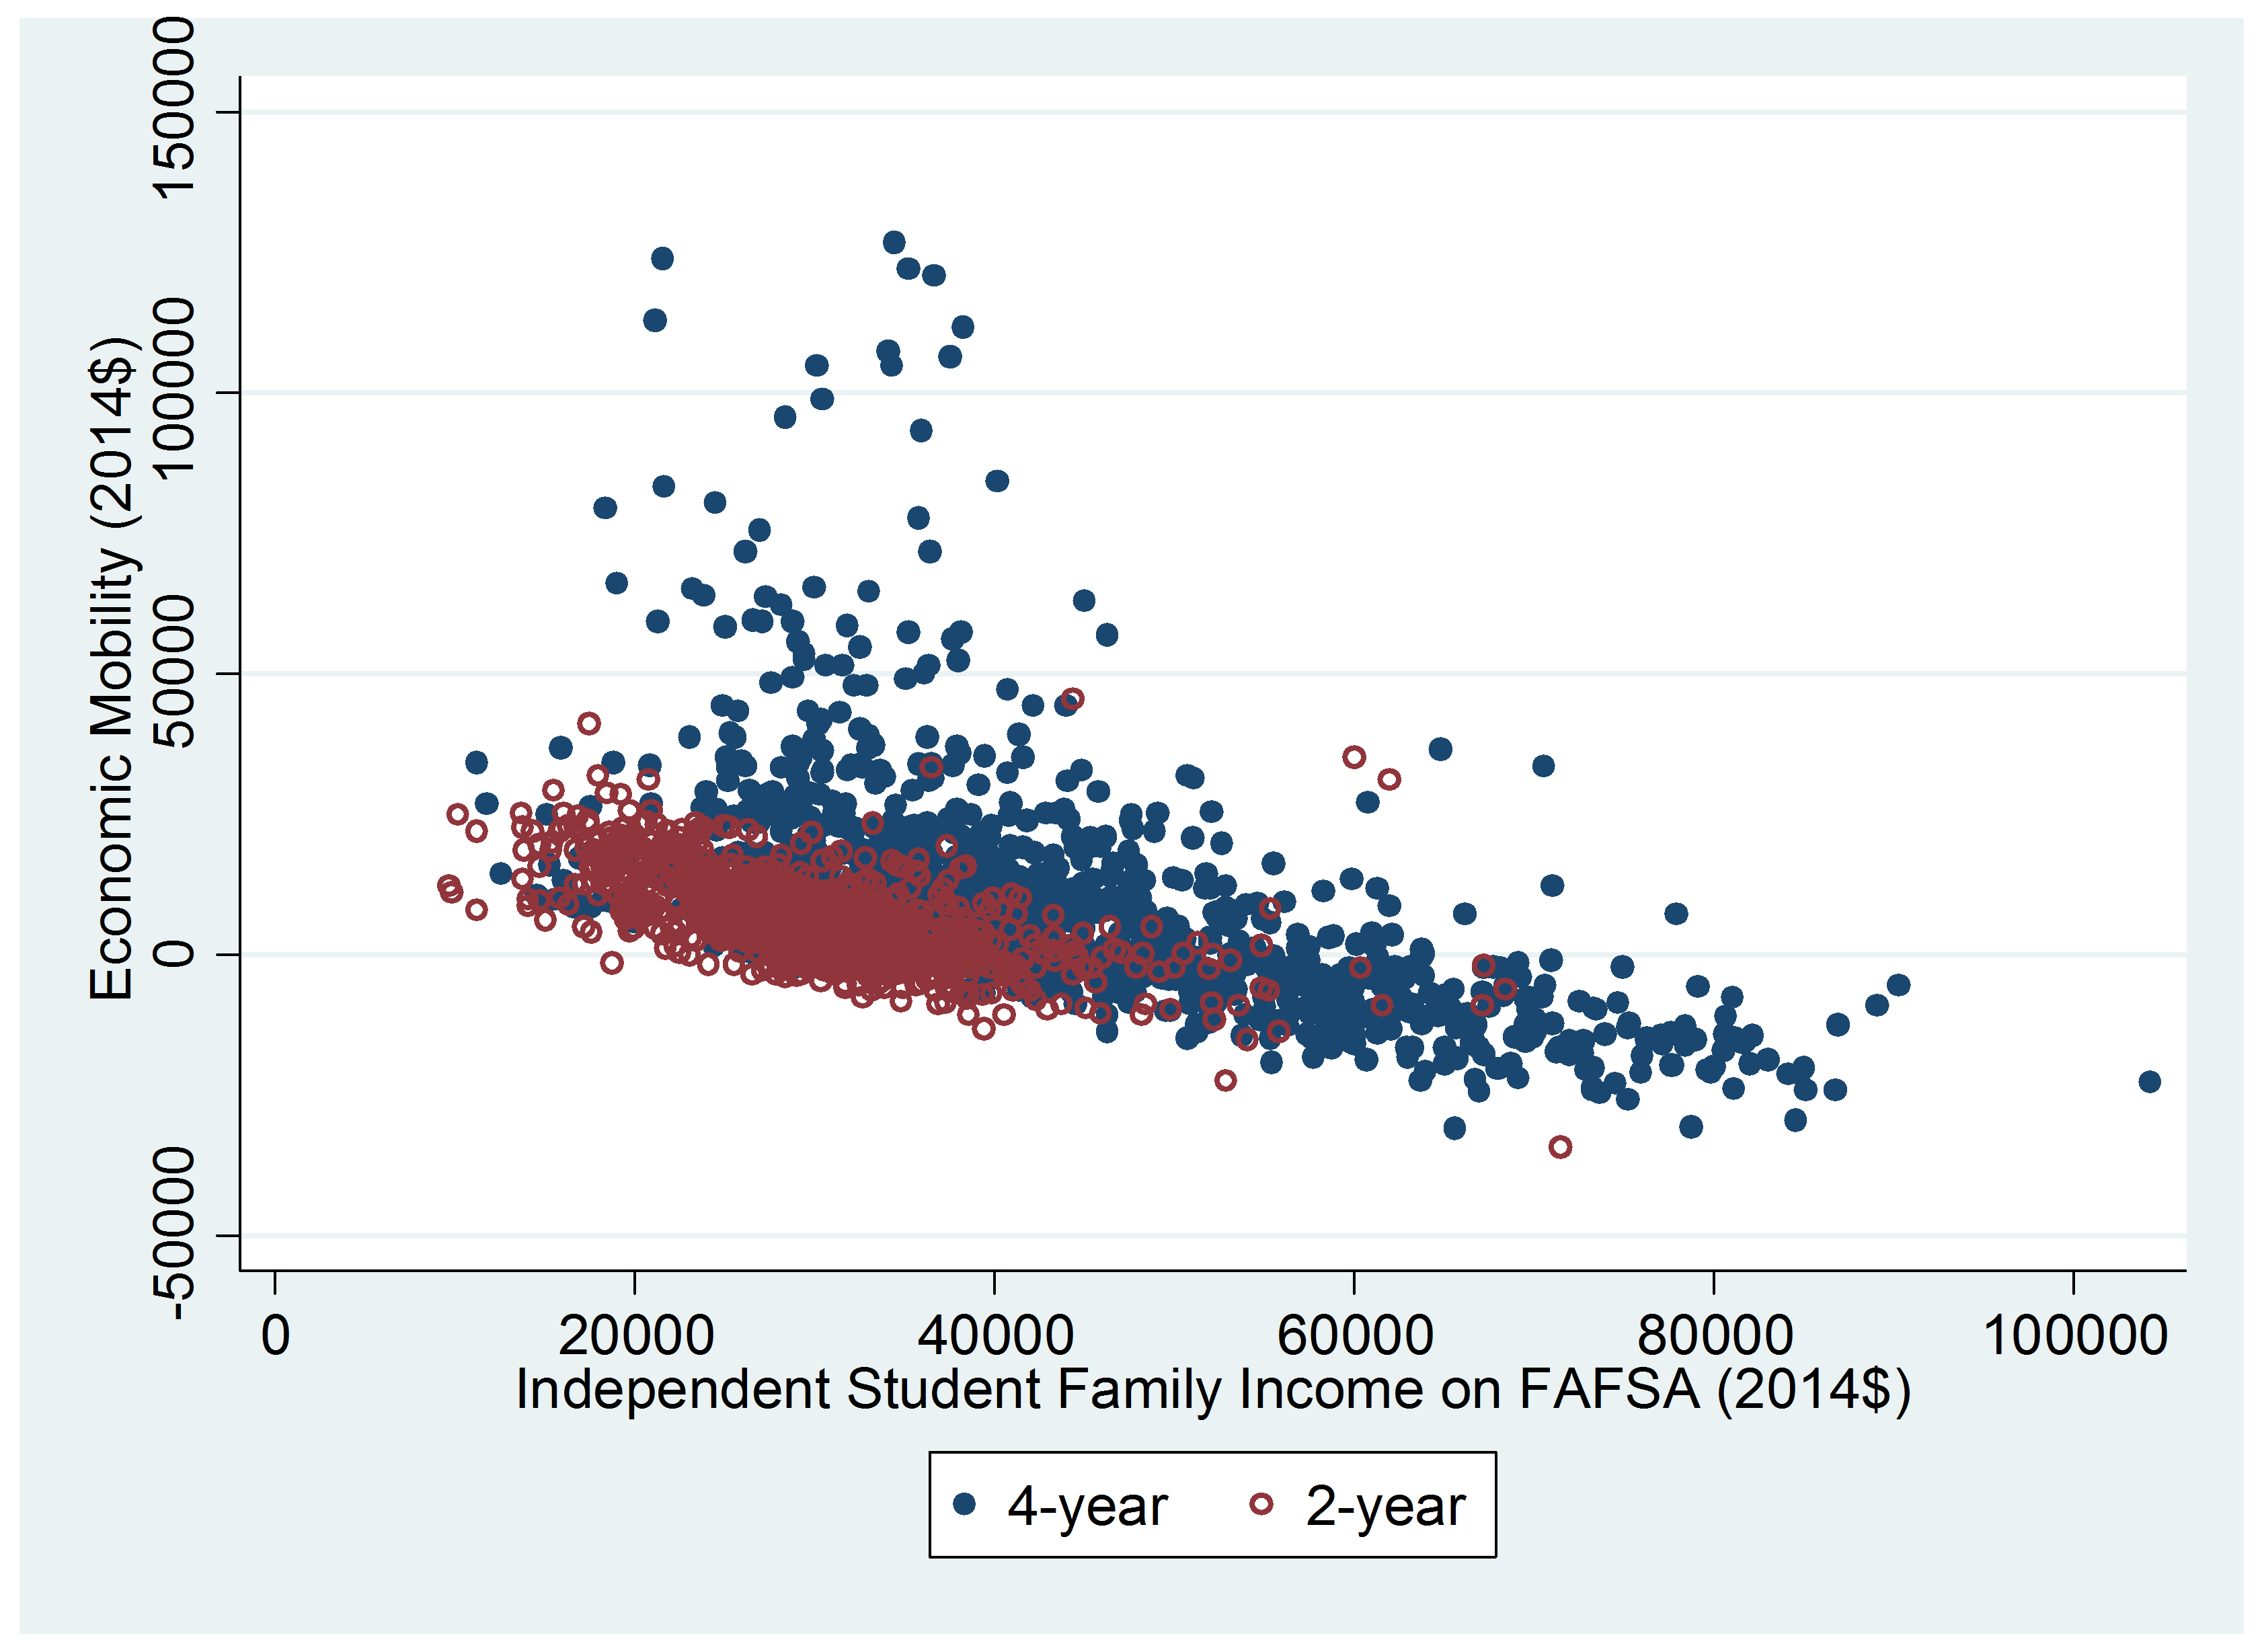
These data are displayed in Figure 1, which shows the average economic mobility (change in income from before to after college, in inflation-adjusted dollars) of independent students at each college alongside the average pre-college income. There is significant variation in the economic mobility measure across these 2,268 colleges, especially among colleges that enroll relatively low-income students. For example, among colleges with average starting incomes of $40,000, the economic mobility measure (i.e. by how much post-college earnings exceeded $40,000) ranges from less than $0 to more than $100,000.
Figure 1. Economic Mobility of Independent Students vs. FAFSA Personal Household Income
This type of analysis is trickier for dependent students, who typically do not work full-time prior to attending college. However, given the expectation that colleges are an engine for socioeconomic mobility, it is still conceptually appealing to compare how well similarly situated colleges (in terms of the student body makeup) fare in terms of the post-college incomes of their dependent students. The data limitations of doing this with the College Scorecard data are similar to those for independent students, but we can carry out the same illustrative analysis, assessing the 1,104 two-year colleges and 1,406 four-year colleges where at least 50 percent of dependent students were working and not enrolled 10 years after matriculation.
We calculate a relative economic mobility measure for dependent students using a simple regression analysis that compares the post-college earnings of institutions with similar pre-college family incomes.[ix] This is a relative measure (with an arbitrary average of zero), not an absolute measure like the one we calculated for independent students.
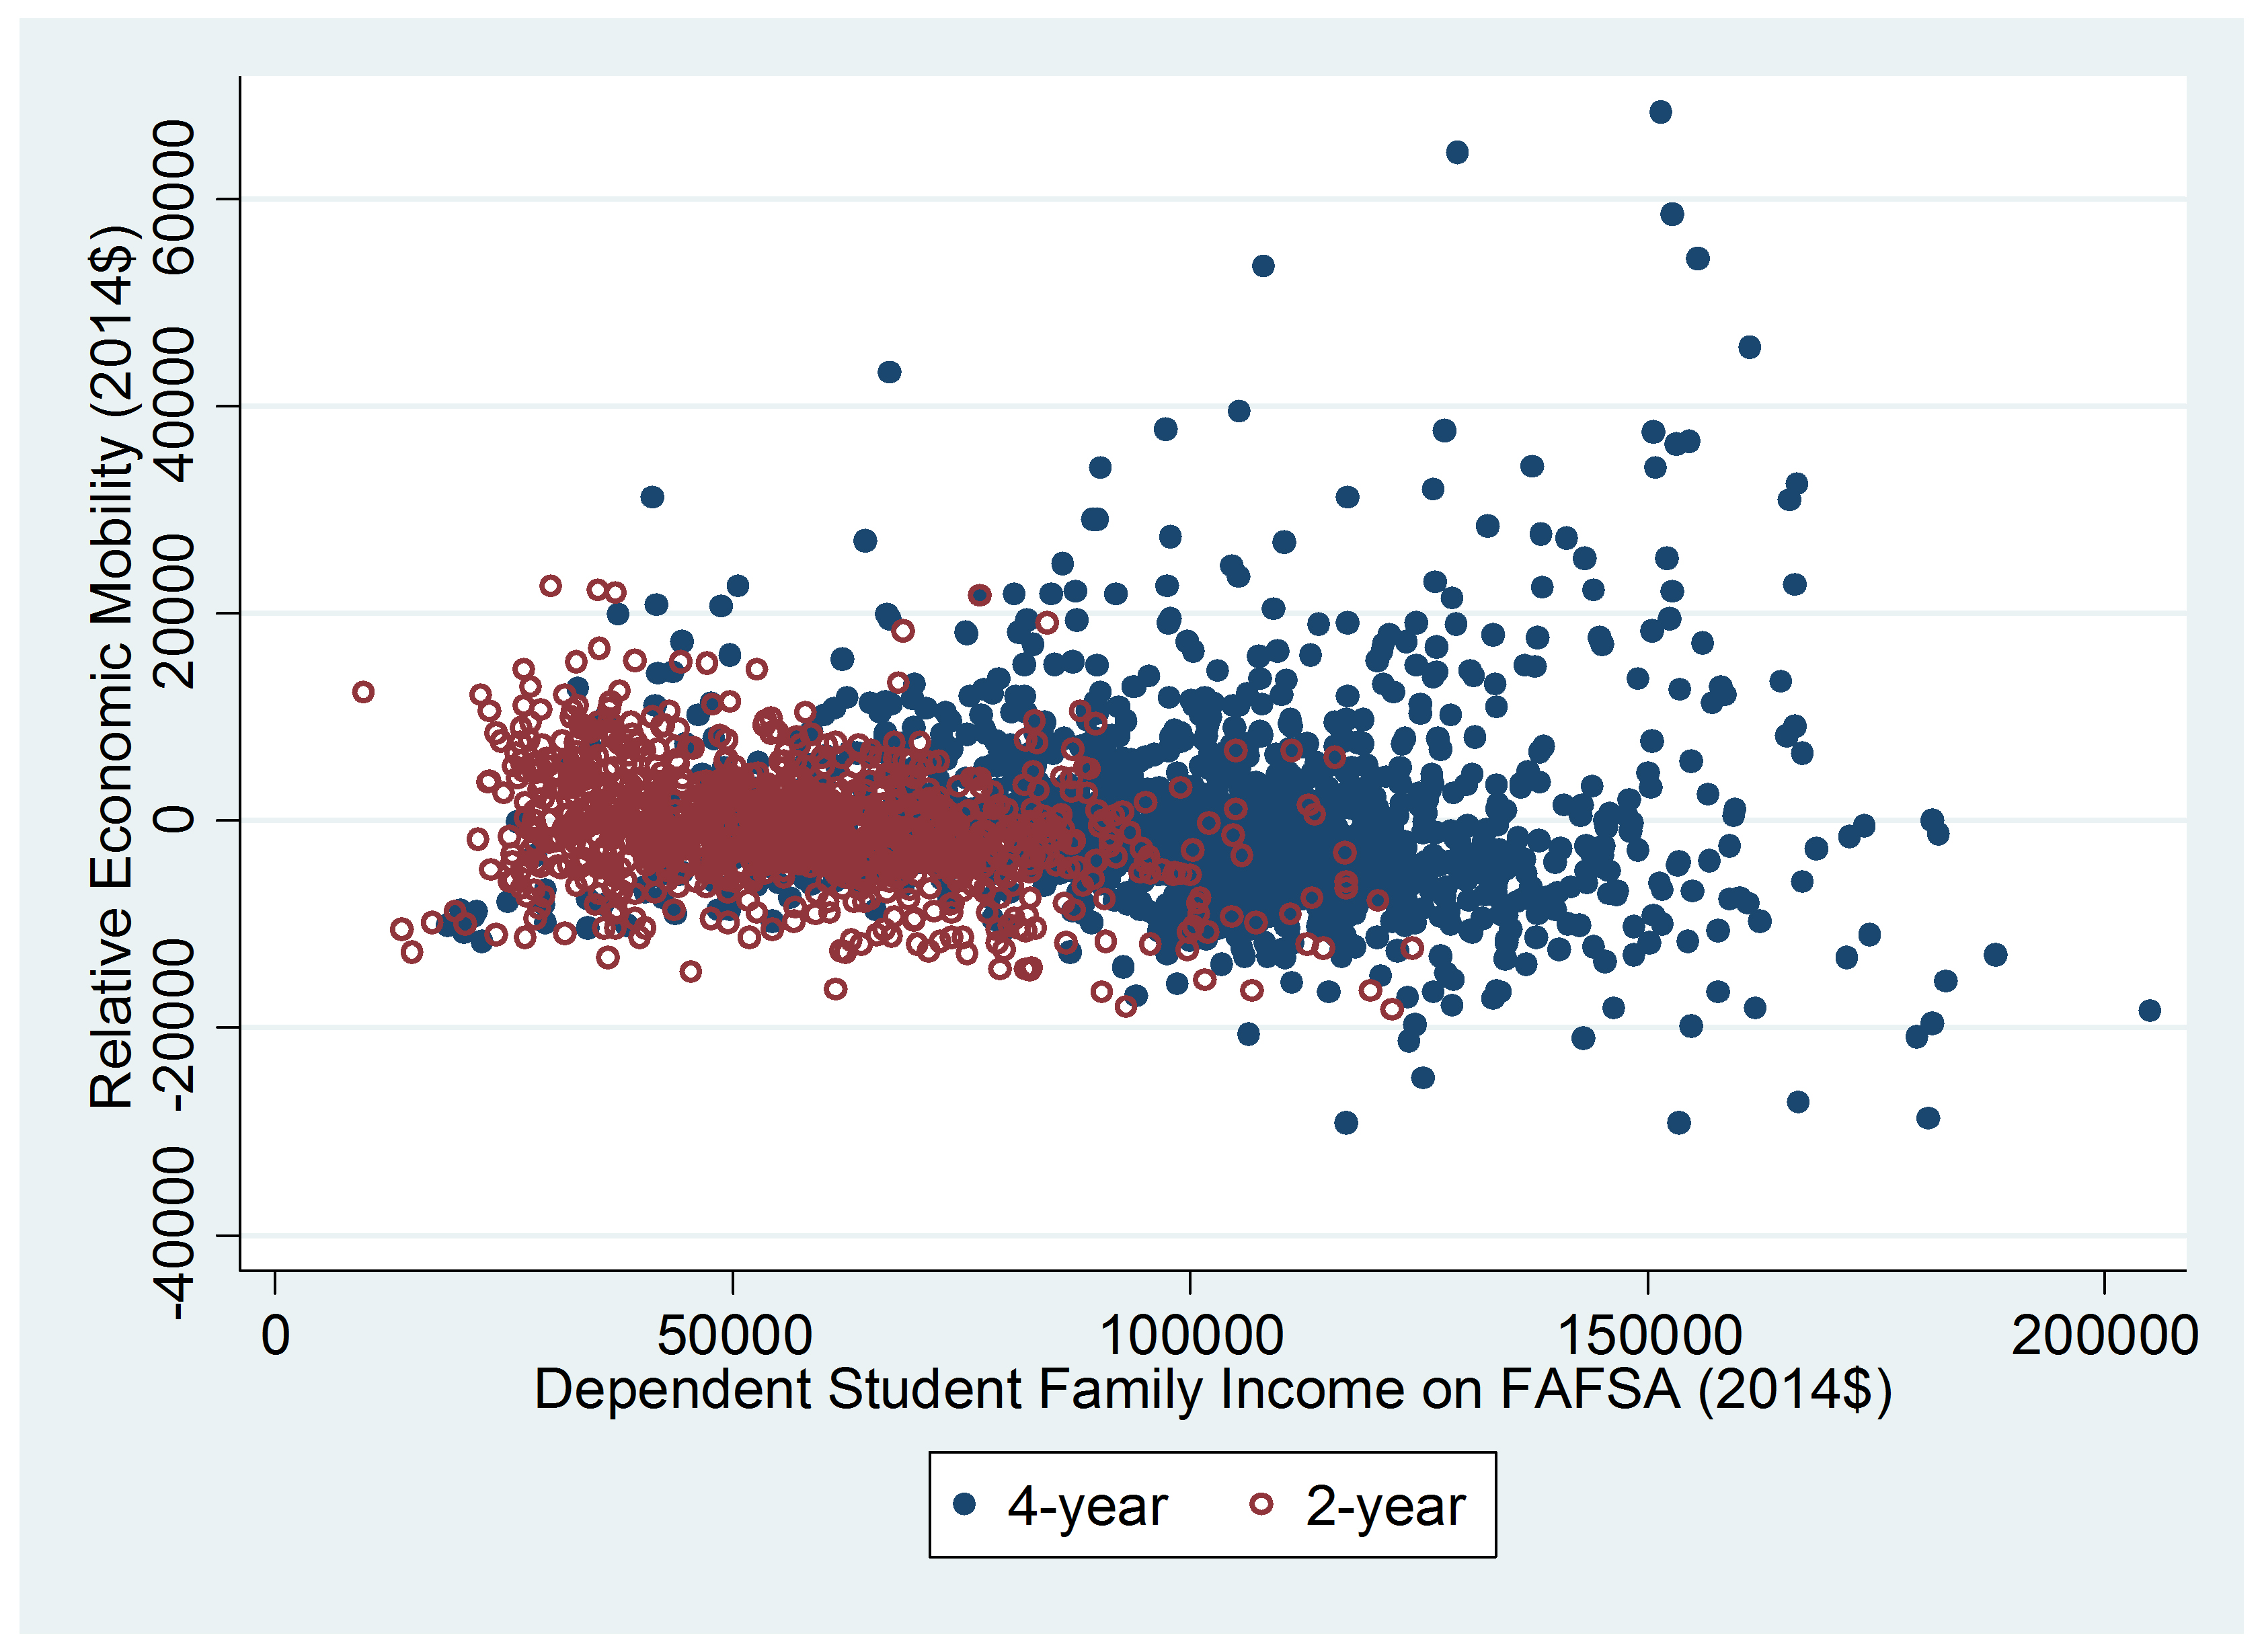
Figure 2 shows that there is substantial variation in the economic mobility measure across colleges that enroll dependent financial aid recipients with similar family incomes. For example, among colleges where dependent students have an average family income of about $100,000, the economic mobility measure varies by more than $20,000 around the average for most colleges, with a handful of outlier colleges well outside that range.
Figure 2. Relative Economic Mobility of Dependent Students vs. FAFSA Family Income
A value-added model for post-college earnings would ideally include one or more high-quality measures of academic preparation, to capture the fact that not all students arrive at college equally prepared to succeed. This is not currently possible for the majority of U.S. colleges, but it is worth noting that average family income (for dependent students) partly functions as a proxy for academic preparation given its substantial correlation with average SAT/ACT scores.[x] The new Scorecard data also include information on how many colleges students applied to, a factor that is predictive of both test scores and post-college earnings in the Brookings analysis.[xi]
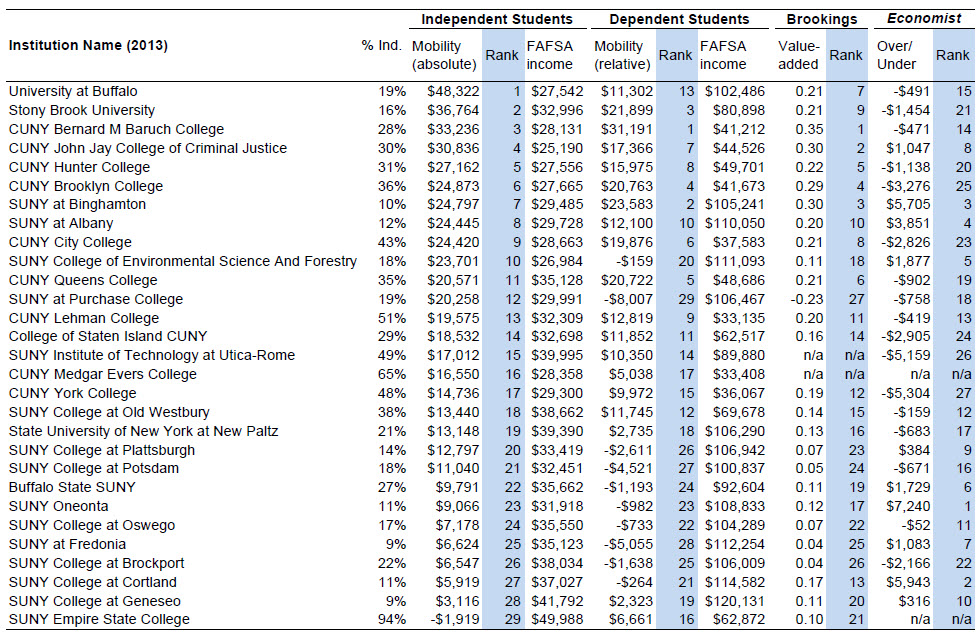
In light of the limitations of the Scorecard data, it is not possible to create a credible economic mobility ranking of colleges. But for illustrative purposes, Table 1 shows the economic mobility measures of 29 public, four-year colleges in New York State.[xii] These data show that the economic mobility measures based on independent and dependent students are correlated, but not perfectly so, a fact mirrored in the larger dataset.[xiii] Further, the interpretation of the measures depends on the independent/dependent split of students. For example, SUNY Geneseo ranks lower on the independent mobility measure than on the dependent measure, but only nine percent of federal aid recipients at Geneseo are independent.
Table 1 also compares the mobility measures to the Brookings and Economist rankings. These rankings attracted notice for producing divergent rankings for particular institutions. For example, Yale appeared near the bottom centile of the Economist list but was at the 88th percentile of the Brookings list.[xiv] For New York’s four-year public colleges, the Economist ranking diverges sharply and is weakly negatively correlated with both of the economic mobility measures.[xv] The Brookings ranking is positively correlated with both mobility measures and strongly correlated with the measure for dependent students.[xvi] The divergence between the Brookings and Economist rankings probably emerges in part from the large number of factors included in the Economist value-added model (leading to substantial noise in the rankings), including elements such as a dubious measure of marijuana use.[xvii]
Table 1. Economic Mobility and Other Rankings of New York State Public, Four-year Colleges and Universities
Click on the table below to see a full-sized version
Recommendations
The analysis above illustrates how to begin thinking about the creation of an economic mobility ranking of colleges. An actual ranking would need to account for factors that affect the economic outcomes of students at different colleges but are not captured by pre-college income measures, such as the demographic characteristics and academic preparation measures used in existing value-added rankings.
An economic mobility ranking of colleges is well within reach if the next iteration of the College Scorecard addresses the data limitations identified above, which have relatively straightforward solutions:
-
- Report consistent measures of pre- and post-college earnings, such as earnings of independent students that are based only on the student (i.e. excluding spouse’s earnings). This information should be available from the FAFSA or IRS tax records.
- Report pre- and post-college earnings for the same group of students, such as those who are employed and not enrolled in school a given number of years (in addition to continuing to report average pre-college earnings for all entering students who applied for aid).
- Supplement the mean and median values currently reported with a richer picture of the joint distribution of pre- and post-college earnings to allow non-governmental entities to produce information not just on average economic mobility of each college but also for subgroups of students (e.g., low-income students).[xviii]
The next version of the Scorecard should also address other limitations, especially the need for program-level data given the strong correlation between choice of major and post-college earnings.[xix] The success of each college at promoting economic mobility surely varies substantially within the gates of its own campus.
The Obama administration was right to abandon its ill-fated college ratings effort and instead focus on producing better data, just as the Securities and Exchange Commission regulates stocks and bonds but leaves it to private organizations to rate them.[xx] As the new Scorecard expands the cottage industry of rankings, the Scorecard’s creators should continue to improve this valuable public resource.
[i] https://www.brookings.edu/~/media/research/files/papers/2015/10/evidence-speaks/scorecard/deconstructing-and-reconstructing-the-college-scorecard.pdf
[ii] http://www.economist.com/blogs/graphicdetail/2015/10/value-university?fsrc=scn/tw/te/bl/dc/st/ourfirstevercollegerankings, https://www.brookings.edu/research/reports2/2015/10/29-earnings-data-college-scorecard-rothwell
[iii] https://economics.missouri.edu/working-papers/2015/wp1501_koedel.pdf
[iv] http://www.economist.com/blogs/graphicdetail/2015/10/value-university?fsrc=scn/tw/te/bl/dc/st/ourfirstevercollegerankings
[v] https://www.brookings.edu/research/reports2/2015/10/29-earnings-data-college-scorecard-rothwell
[vi] All statistics we report are based on a subsample of the Scorecard institutions that exclude institutions that meet any of the following criteria: no data for the 2001/2002 cohorts in the 2011/2012 file; no data in the 2001/2002 file; missing counts by independent/dependent status; a larger count of former students working and not enrolled in 2011/2012 than were reported as federal aid recipients in 2001/2002; graduate-only, primarily certificate granting, and missing primary degree; and special focus or missing Carnegie classification (using 2013 Carnegie classifications, since this information is not available for 2001).
[vii] The correlation between the average FAFSA family income of independent students and percent married (among all federal aid recipients) is 0.20.
[viii] The Scorecard does not report earnings by dependency status if the number of dependent or independent students is less than 50. We impute average earnings for independent (dependent) students as average earnings for all students at institutions where more than 80 percent of federal aid recipients were independent (dependent).
[ix] Specifically, we calculate the residuals from a regression of post-college income on FAFSA family income and its squared and cubed terms.
[x] The correlation between the average family income of dependent students and average SAT/ACT scores is 0.71 for the 1,064 institutions in the 2001/2002 Scorecard cohorts that were linked to SAT/ACT scores.
[xi] https://www.brookings.edu/~/media/research/files/reports/2015/10/29-college-scorecard/appendixranking-colleges-with-earnings.pdf
[xii] We exclude SUNY Maritime College and the U.S. Merchant Marine Academy, which are specialized and relatively small.
[xiii] The correlation between the independent and dependent mobility measures is 0.65 for the institutions in Table 1 and 0.59 for all institutions in the larger dataset (0.67 at two-year institutions and 0.58 at four-year institutions).
[xiv] http://www.vox.com/2015/10/30/9647130/economist-college-rankings
[xv] Correlation coefficients with the Economist over/under measure are -0.16 for independent students and -0.21 for dependent students.
[xvi] Correlation coefficients with the Brookings value-added measure are 0.51 for independent students and 0.85 for dependent students.
[xvii] http://www.economist.com/blogs/graphicdetail/2015/10/value-university. Another key methodological difference is that the Brookings ranking includes observed aspects of quality (e.g., the graduation rate, orientation towards high-paying majors, and faculty salaries) in the calculation of value-added, whereas the Economist ranking excludes them.
[xviii] We note that the Scorecard already reports post-college income by tercile of FAFSA income, although these data are subject to the same limitations as the overall earnings data.
[xix] https://www.brookings.edu/research/papers/2015/10/15-deconstructing-reconstructing-college-scorecard-whitehurst-chingos
[xx] https://www.brookings.edu/research/papers/2013/11/06-better-data-for-college-ratings-chingos
The Brookings Institution is committed to quality, independence, and impact.
We are supported by a diverse array of funders. In line with our values and policies, each Brookings publication represents the sole views of its author(s).