An enduring narrative about the U.S. economy, along with rugged individualism and the opportunity to rise from rags to riches, is that it is a dynamic market where new ideas can thrive and new businesses can reshape the economic landscape.
Competition is the basis of a market economy. It forces businesses to innovate to stay ahead of other firms, to keep prices as low as they can to attract customers, and to pay sufficient wages to avoid losing workers to other firms. When businesses vie for customers, prices fall and economic output increases. When businesses hire workers away from each other, wages rise and workers’ standard of living improves. And as unproductive firms are replaced by innovative firms, the economy becomes more efficient.
Thus, competition allows the market economy to allocate resources efficiently. Without it, there can be distortions that reduce overall welfare, as concentrated interests benefit at the expense of the broader public. Entrenched incumbent firms with market power hire fewer workers, produce less output, and earn higher profits than would otherwise be the case in a competitive market. In attempting to secure and maintain their market power, firms can spend substantial resources that produce no value for the overall economy but simply allow the firm to maintain high profits.1
Over the past few decades there have been troubling indications that dynamism and competition in the U.S. economy have declined. This paper describes the state of competition in the economy, related patterns in entrepreneurship, and policies that promote or inhibit competition. Business dynamism and competition are inherently intertwined, though the linkages are complex. Dominant firms can crowd out new entrants and reduce entrepreneurship; at the same time, a lack of start-ups can reduce the entrants necessary to generate competition. Thus, we examine both growing market concentration and the reduced rate of entry by firms.
Read the full introduction
An enduring narrative about the U.S. economy, along with rugged individualism and the opportunity to rise from rags to riches, is that it is a dynamic market where new ideas can thrive and new businesses can reshape the economic landscape.
Competition is the basis of a market economy. It forces businesses to innovate to stay ahead of other firms, to keep prices as low as they can to attract customers, and to pay sufficient wages to avoid losing workers to other firms. When businesses vie for customers, prices fall and economic output increases. When businesses hire workers away from each other, wages rise and workers’ standard of living improves. And as unproductive firms are replaced by innovative firms, the economy becomes more efficient.
Thus, competition allows the market economy to allocate resources efficiently. Without it, there can be distortions that reduce overall welfare, as concentrated interests benefit at the expense of the broader public. Entrenched incumbent firms with market power hire fewer workers, produce less output, and earn higher profits than would otherwise be the case in a competitive market. In attempting to secure and maintain their market power, firms can spend substantial resources that produce no value for the overall economy but simply allow the firm to maintain high profits.1
Over the past few decades there have been troubling indications that dynamism and competition in the U.S. economy have declined. This paper describes the state of competition in the economy, related patterns in entrepreneurship, and policies that promote or inhibit competition. Business dynamism and competition are inherently intertwined, though the linkages are complex. Dominant firms can crowd out new entrants and reduce entrepreneurship; at the same time, a lack of start-ups can reduce the entrants necessary to generate competition. Thus, we examine both growing market concentration and the reduced rate of entry by firms.
By a number of measures, markets are more concentrated and possibly less competitive now than they were a few decades ago. From 1997 to 2012 the average revenues of the top four firms in a given industry rose from 24 percent to 33 percent of total industry revenues. As shown in figure A, the increase was broad-based.2 Profits have also increased as a share of the economy and become more unequal. Figure B shows that investment returns for the 90th percentile of nonfinancial, publicly traded firms grew 160 percent from 1997 to 2014; the 25th percentile grew only 2 percent over that same period.
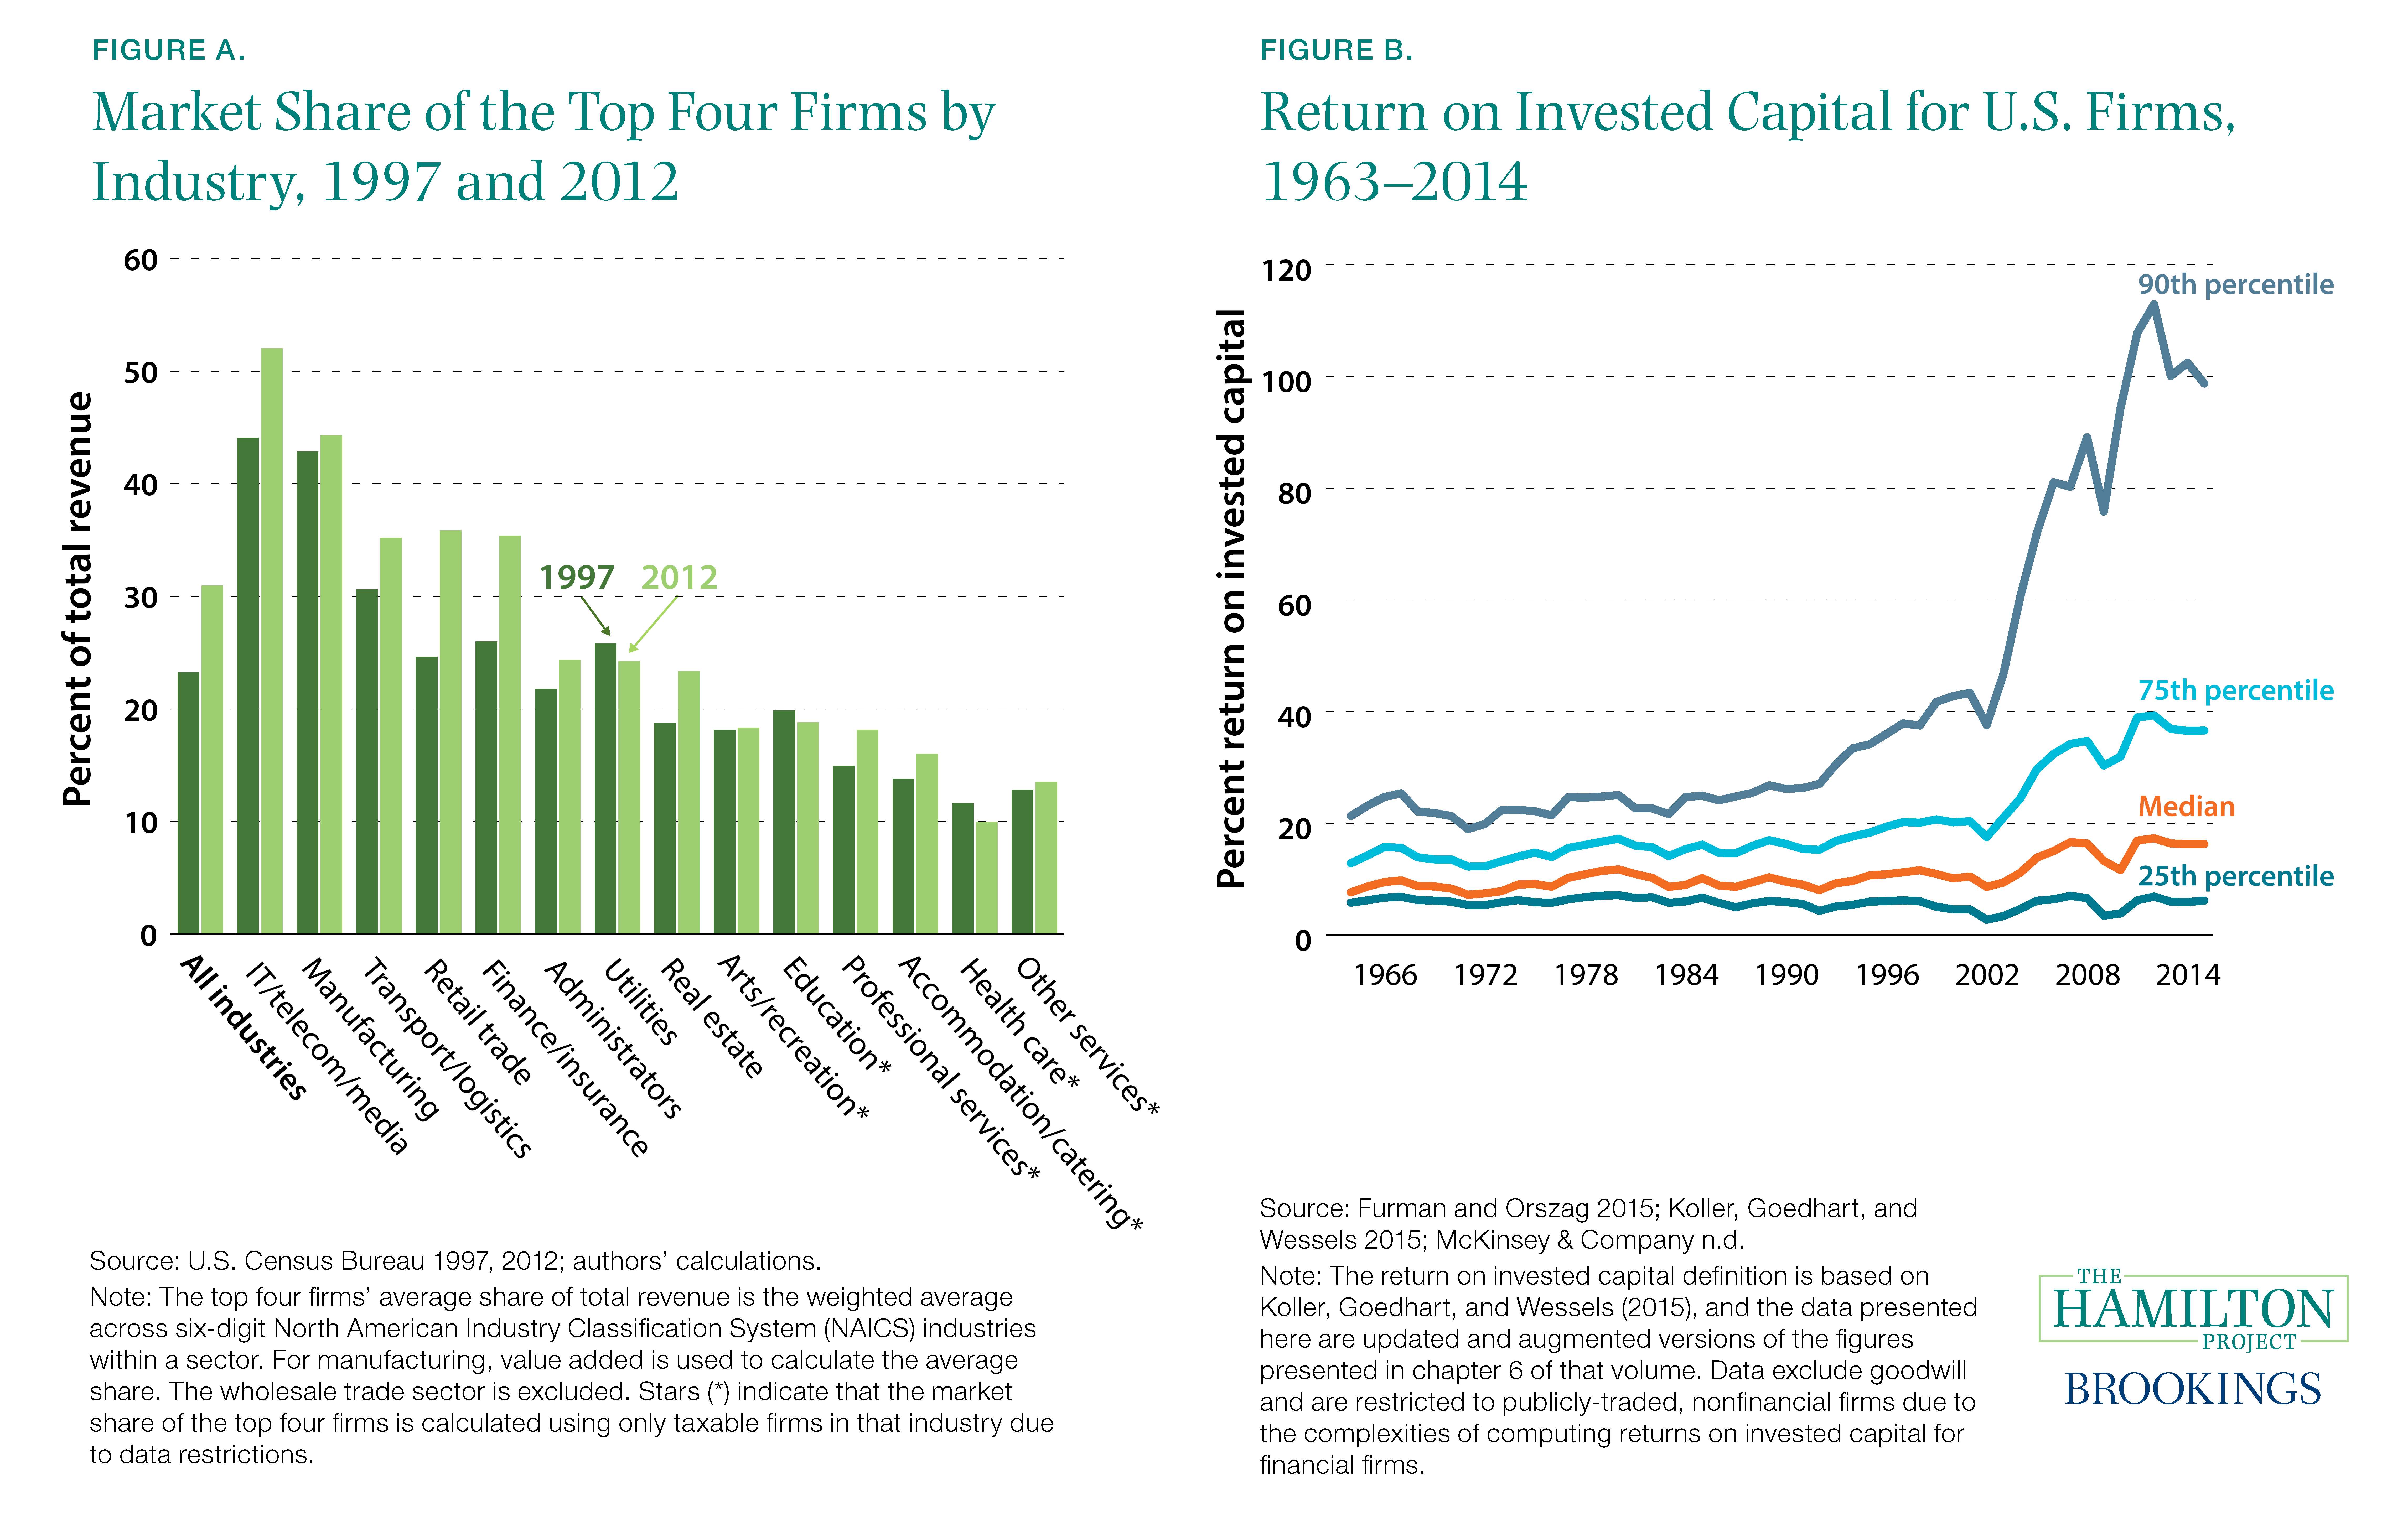
If innovations generate an increase in profits, one would expect competition to eventually bring down the profit margin. A set of firms that continuously earns very high profits year after year could imply that competition is not functioning as expected. Indeed, firms’ unequal investment returns have been persistent (Richardson et al. 2005; Waring 1996).3
Broadly speaking, declining market competition can be linked to public policy in two ways. The first is that policy—principally antitrust regulation—bears a responsibility for addressing economic trends that threaten competition, such as increasing concentration in product and labor markets.
The second linkage between competition and policy runs in the other direction: the actions of local, state, and federal governments can impede competition. Policies ranging from state subsidies to incumbent firms, to excessive licensure restrictions, to local land-use restrictions can all limit market entry of new firms, enabling incumbent firms to maintain their entrenched position.
Considered in this light, a number of U.S. economic trends are disconcerting. Measured productivity growth has slowed, investment by firms (relative to their profits) is lower than in the past, job mobility across firms has declined, and labor’s share of income has fallen.4 All of these trends have multiple causes, but all are consistent with reduced market entry by new firms—something that may be both a cause and a consequence of reduced competition.
Unless there has been a simultaneous upswing in the innovative capacity of large firms, this smaller role for new firms holds back productivity. Reduced entry means fewer innovations make their way into the marketplace from outside the incumbent firms. It means fewer workers are reallocated to firms that are more productive (Decker et al. 2014). It means workers receive fewer outside offers, likely reducing their bargaining position and suppressing wage growth, as described in a recent Hamilton Project framing paper (Shambaugh, Nunn, and Liu 2018).
Over the past thirty years new firms have played a decreasing role in the economy, and now account for a much smaller share of employment. This reduction is the product of both a reduced start-up rate and lower employment levels of the remaining start-ups. Figure C shows the employment share of firms in 1987 and in 2015 by the age of the firm. In total, firms under the age of 10 made up just 19 percent of employment in 2015, down from 33 percent of employment in 1987.

The economics and policy of dynamism are at the core of The Hamilton Project’s mission. Supporting economic growth and promoting the competition that helps drive it are two chief objectives of public policy. This document aims to ground discussions of policies affecting competition in a clear assessment of the current economic situation. Chapter 1 therefore documents changes in the nature of competition in the U.S. economy, chapter 2 examines antitrust enforcement, chapter 3 explores reduced start-up rates and their impacts, and chapter 4 reviews government policies that may inhibit dynamism.
Chapter 1: Rising Market Concentration
Introduction
Some of the most fundamental questions in economics concern the existence of firms (Coase 1937; Grossman and Hart 1986; Holmström and Roberts 1998). First, why is economic activity commonly organized within firms? And second, what determines the size of firms? The first question is answered in terms of transaction costs: it is often more efficient to conduct some economic activity within an organization, eliminating the need for market transactions at every step of the production process. The second question is discussed in terms of returns to scale: a firm realizes cost savings as it expands its operations, but only up to a point, after which average costs rise and it is prohibitively costly for the firm to expand further. In a competitive market, only the firms with the lowest average costs will survive.
What Is Market Power and How Do Firms Acquire It?
Firm dynamics have implications for the existence and extent of market competition. When very large businesses are less expensive to operate than small firms, the latter will be driven out, and the remaining firms will face diminished competitive pressures. In this way even natural economic and technological forces can grant firms market power and thereby undermine competition. Natural monopolies (where returns to scale lead to a market having only one dominant firm) like an electric utility or a railroad operator, are extreme examples.
In addition, firms can join to gain market power, either by formally merging or by coordinating their activities. In many of these cases buyers and workers are put at a disadvantage, forced to accept the terms offered by firms or else leave the market entirely. It is possible that monopolies can share their profits with workers or invest them in socially beneficial research and investment. But the concern from an economic policy perspective is that market forces are not pressuring firms to do this, and policymakers must hope that firms with monopoly profits will use them in beneficial ways.
Discussions of competition typically focus on the size and market share of firms. This is indeed a primary manifestation of market power: an incumbent firm whose sales constitute a large portion of a market is usually in a position of strength, and price-cost margins tend to be higher in more-concentrated industries (Bresnahan 1989). While it is certainly possible for even two dominant firms to compete vigorously, anticompetitive outcomes tend to become more common as concentration increases (Bain 1951; Levenstein and Suslow 2006).
However, the more fundamental economic variable of interest is contestability; that is, can other firms easily compete with the incumbent (Coursey et al. 1984)? This is a more difficult market characteristic to observe.
One challenge of measuring market power is defining the relevant market. Is a car manufacturer a monopolist if it is the only one that produces a convertible? What if it is the only one that produces a hybrid convertible? Defined narrowly enough, many markets could appear to be dominated by monopolies, but these firms likely compete for customers with firms in other similar product categories. To accommodate this situation, models of monopolistic competition assume that firms have some narrow power over a slice of the market, but other firms may encroach on their territory by making similar products. Warren Buffett famously said that he does not invest unless there is some capacity for a firm to defend its market power from competition, which provides greater prospects for high profitability.
To further complicate matters, even firms without a large share of any market can benefit from various types of frictions and barriers to entry that confer market power. Any factor that makes it difficult for consumers or business partners to switch firms, or for workers to switch to other employers, can impair competition. For consumers, one example is lack of interoperability: when a consumer is in the market for a new electronic device to add to their existing system, it can be difficult or impossible for them to usefully integrate a device from a competing manufacturer. For workers, an example is a non-compete contract, which explicitly prohibits job switching within a defined industry for a period of time (Marx 2018).
These departures from the ideal of market competition are economically important. The most recognizable social cost of market power comes in the form of higher prices paid by consumers and the attendant reduction in output, but we should also consider other social costs (Posner 1975). When workers have few options for alternative employment, their employers derive so-called monopsony power that allows them to pay workers less than those workers would receive in a competitive market (Manning 2003).
Furthermore, concentration and market power can have important effects on innovation. On the one hand, a market with large barriers to entry and little competition is not likely to be one in which start-ups introduce innovative ideas and business techniques; on the other hand, market power can increase the incentive to innovate, as with temporary patent grants. In either case, when innovation is fast-paced, current market shares might not be a good guide to future competitive conditions and consumer outcomes (Katz and Shelanski 2007).
How Strong Is the Evidence That Firms Have More Market Power and That This Is Having a Meaningful Impact?
The evidence demonstrating the rise of market power in the U.S. economy can be summarized as follows:
Market shares of top firms are growing across the economy. With the more comprehensive measure of concentration that is used by antitrust authorities, researchers find a similar pattern (see fact 1).
Market power can arise because firms create new products or because returns to scale or network effects tilt an industry toward having one dominant producer. New technologies and business innovations have helped create markets with a few dominant firms (see fact 2).
Market power can arise through the mergers and acquisitions of firms. By some measures, merger and acquisition activity is currently at a high level (see fact 3).
Recently, researchers have pointed out that firm market shares do not reflect an important additional consideration: the extent to which ownership of firms is overlapping (Azar, Schmalz, and Tecu forthcoming). After adjusting for common ownership, market concentration has increased even more rapidly in recent decades (see fact 4).
Firms’ revenue appears to be rising relative to their variable costs (De Loecker and Eeckhout 2017). This increase in markups—from 18 percent in 1980 to 67 percent in 2014—is consistent with an increase in firms’ market power.
This level of market power, whatever its origin, can have important implications for the economy today:
The decline in investment since 2000 is a major macroeconomic puzzle. Much of the decline is associated with increasing concentration and declining market competition (see fact 5). At the same time, in industries with the largest increases in concentration, profits and stock market returns have been especially high (Grullon, Larkin, and Michaely 2018).
In labor markets, concentration appears to decrease wages (see fact 7). More generally, employers derive market power from a range of labor market frictions—from job switching costs to imperfect information—that allow them to pay lower wages (see fact 6).
However, it is not universally accepted that market power is increasing or that it constitutes a serious problem. Critics of the market-share approach argue that estimating market concentration is actually difficult or impossible with most current data, either because market shares are unhelpful for thinking about the underlying market power of particular firms (Kaplow 2010) or because the relevant markets are usually much smaller than can be examined with the aggregated data available to researchers (Shapiro 2017; Werden and Froeb forthcoming). In the latter case, concentration in the relevant markets may be constant or declining even while concentration increases at a more aggregated level. Indeed, researchers and antitrust regulators have deemphasized simple concentration calculations (Crane 2011; Shelanski 2013), though direct measures of concentration remain important for antitrust policymaking. We walk through the details of market power and possible impacts in facts 1 through 7.
Fact 1: Firm concentration is rising, particularly in retail and finance.
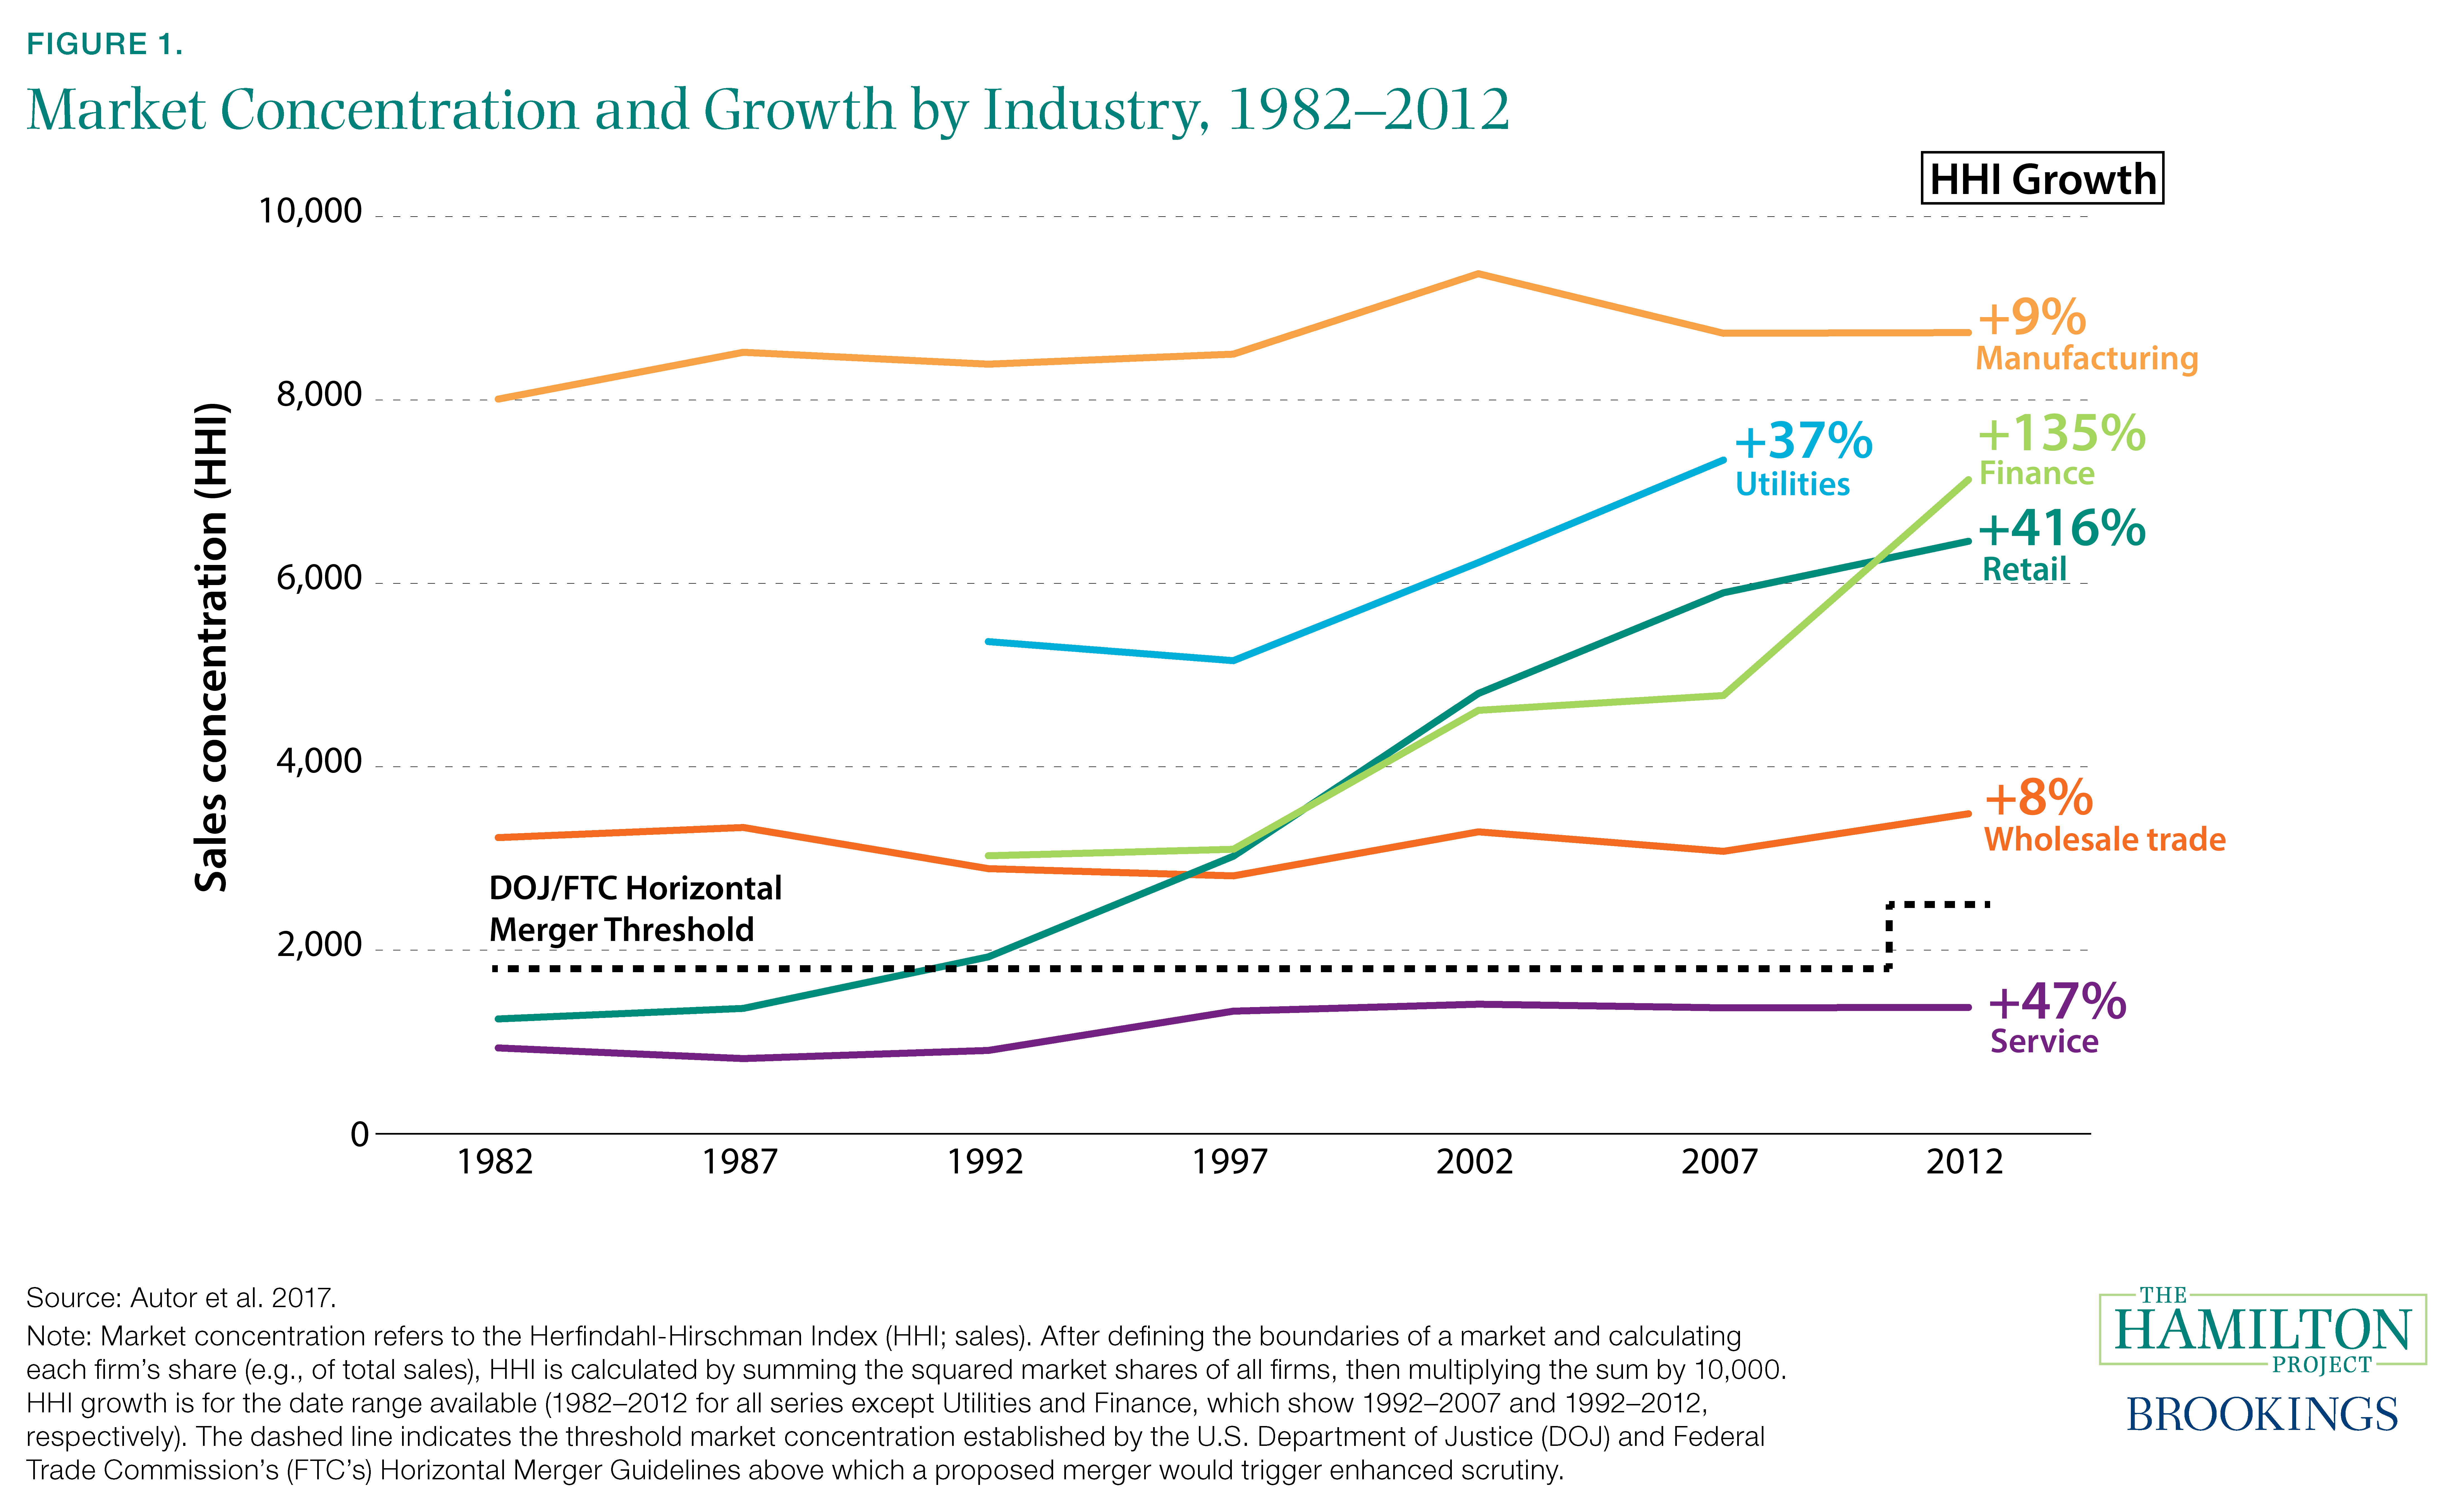
Economists and antitrust policymakers have long used a simple formula to assess the concentration in a market: the Herfindahl-Hirschman Index (HHI). After defining the boundaries of a market and calculating each firm’s share (e.g., of total sales), the HHI is calculated by summing the squared market shares of all firms, then multiplying the sum by 10,000.
In figure 1 we show the calculations of economists David Autor, David Dorn, Lawrence Katz, Christina Patterson, and John Van Reenen, who measure HHI for each narrowly defined industry, then take averages for much larger sectors like manufacturing and services (Autor et al. 2017). A number of sectors—most notably retail, finance, and utilities—show considerable increases in concentration. Manufacturing shows less growth, but industries within manufacturing tend to be highly concentrated. Even the service sector, which has a low average level of concentration, has seen considerable growth over the past three decades (47 percent). Other research tells a similar story, finding that over 75 percent of U.S. industries have registered an increase in concentration levels over the past two decades (Grullon, Larkin, and Michaely 2018).
However, it is possible that nationwide measures do not draw the most relevant boundaries for competition analysis; existing data allow for only imperfect estimates of concentration. Some researchers and policymakers contend that even the narrowest available industry data are too aggregated to be useful for examining concentration (Werden and Froeb forthcoming). If the relevant market is in fact much smaller or more regionally limited than the observed industry, concentration could be higher or lower than the data suggest. Nevertheless, industry-level HHI, like the measures of revenue concentration of the top 4 or top 50 firms in an industry, show a national economic landscape increasingly dominated by a set of larger firms. Other data—for example, rising profit shares or detailed market HHI—for assessing whether this concentration implies problematic market power can provide complementary evidence.
A few factors can drive increasing concentration: scale and network effects may tilt industries toward larger firms, mergers may generate fewer larger firms, or a declining start-up rate may leave fewer challengers to the incumbents. The next three facts describe why concentration might be rising.
Fact 2: Concentration is high in markets with large returns to scale and network effects.
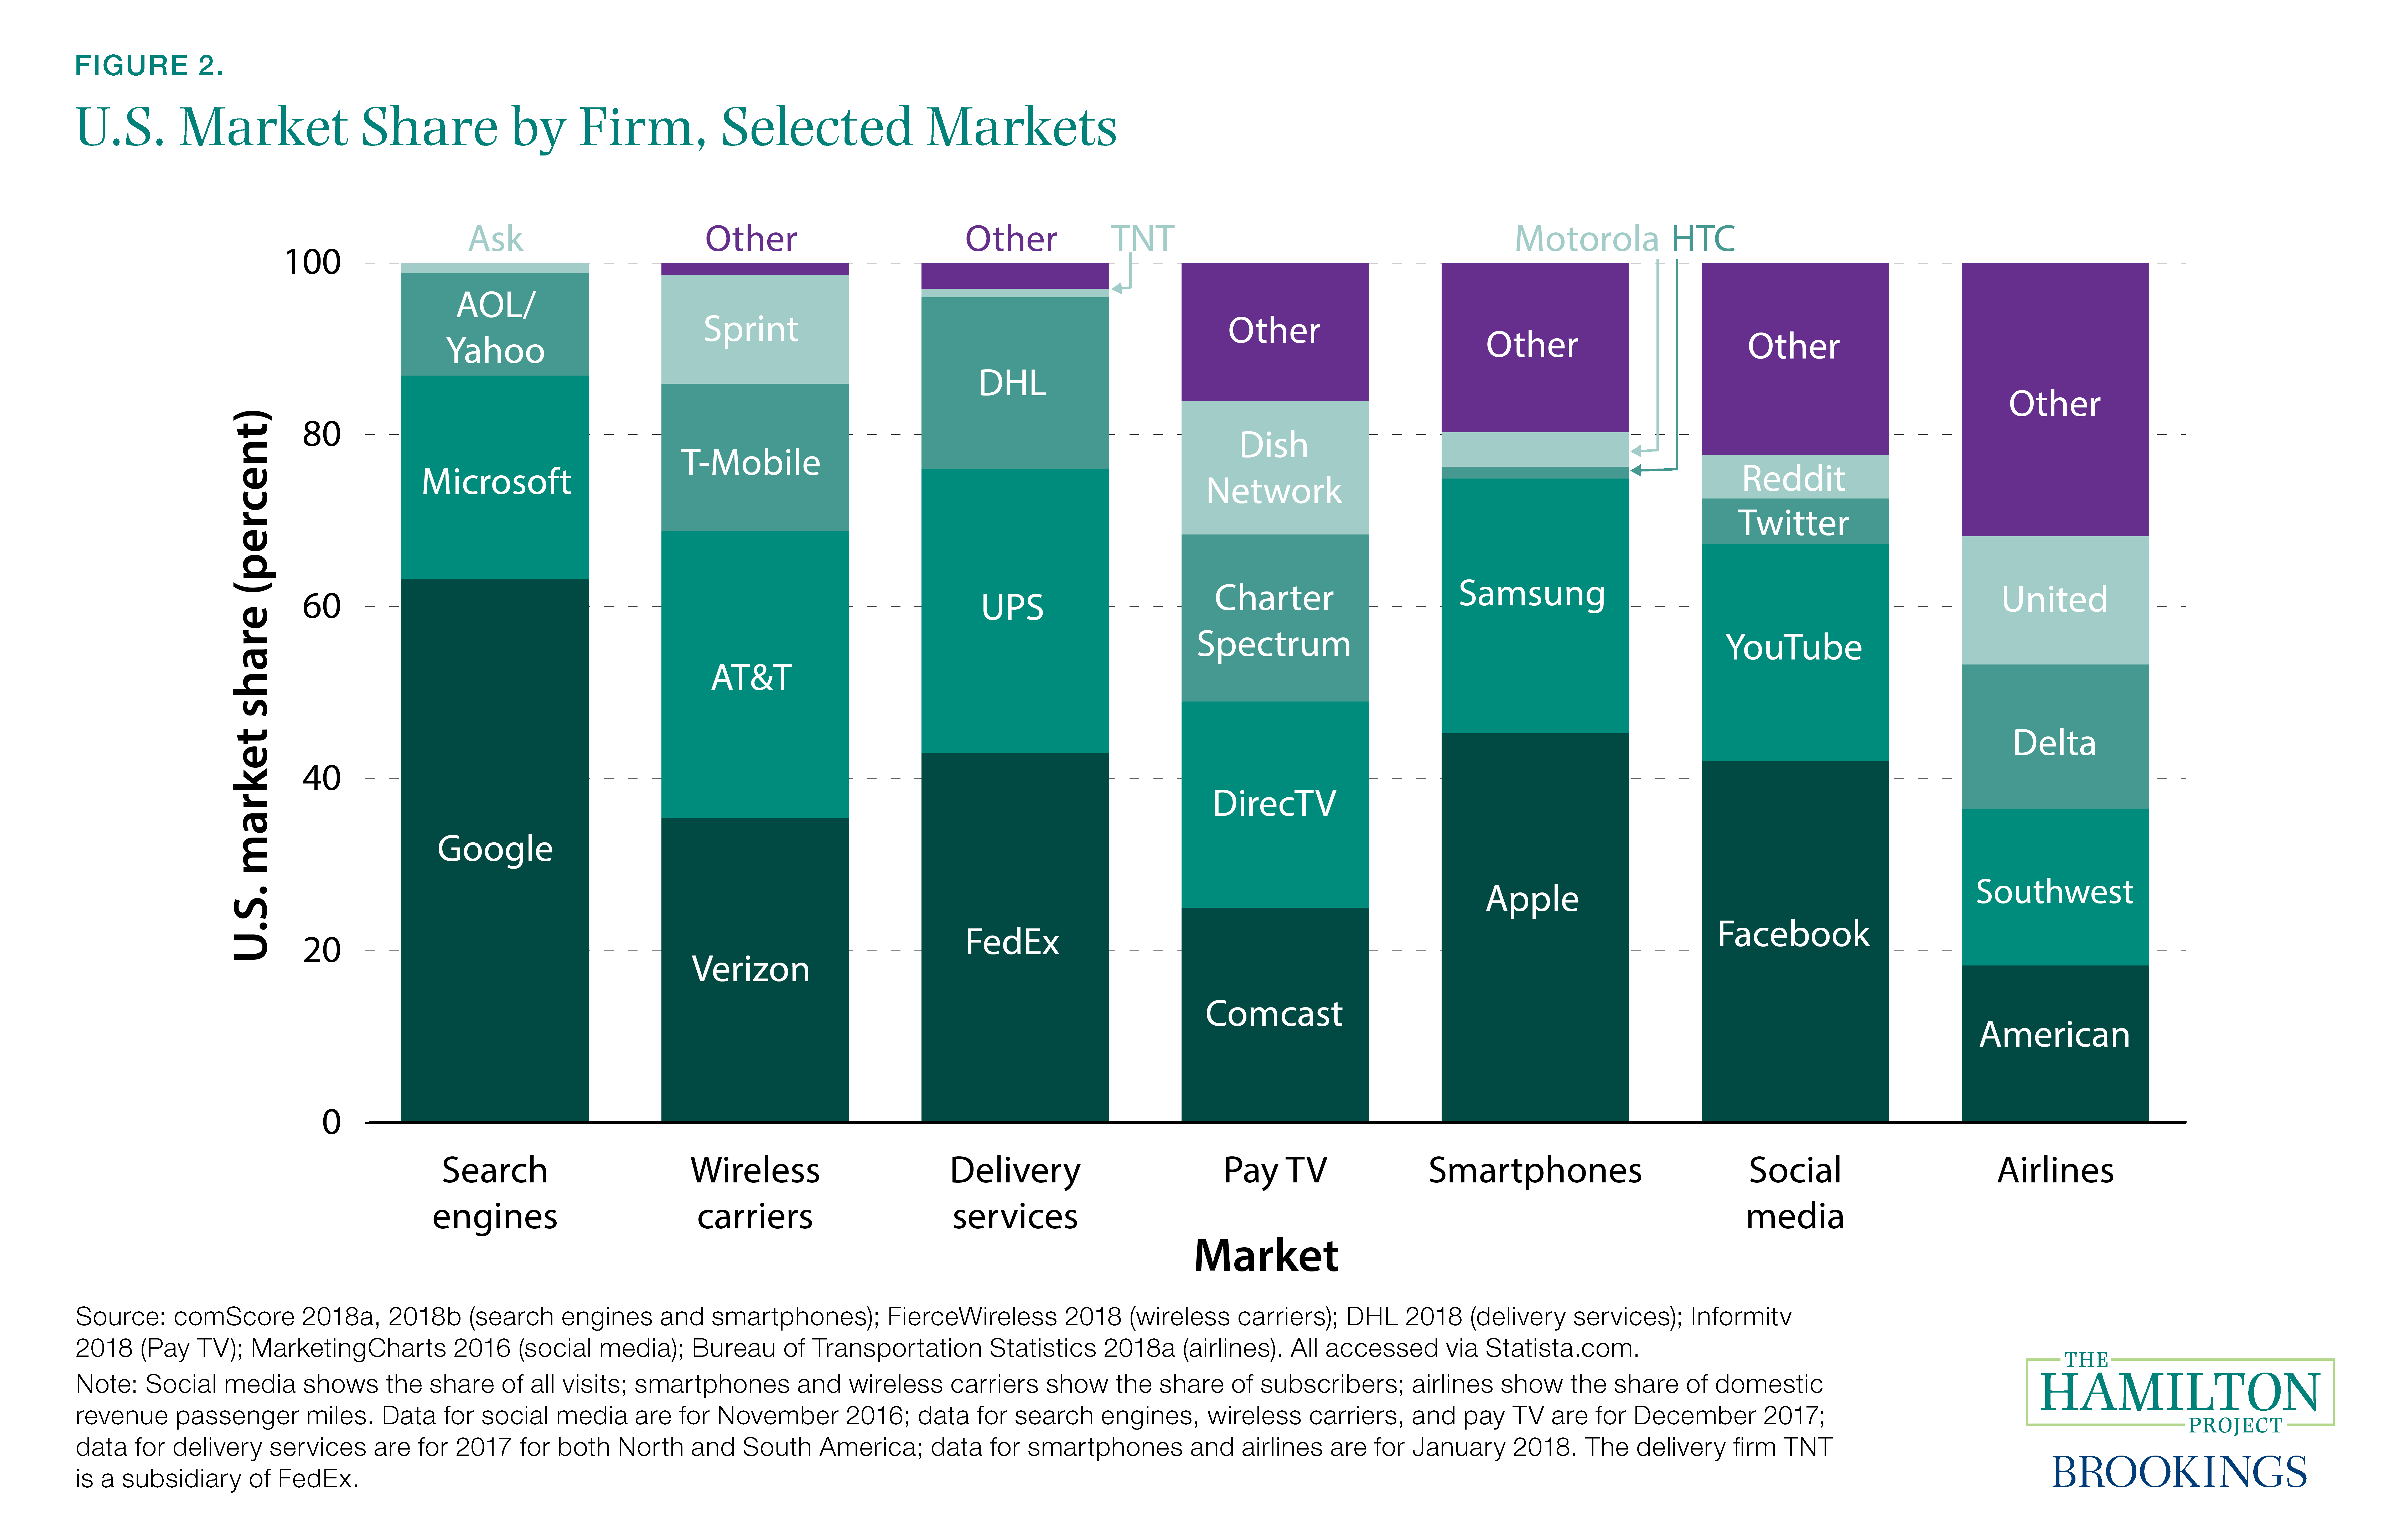
Market concentration has increased broadly throughout the economy. It is difficult to trace the underlying economic and policy factors that produced this increase, but it is instructive to examine selected markets where a few firms are dominant.
In several of the markets shown in figure 2 concentration appears to be related to returns to scale and network effects. For example, in “search engines,” “wireless carriers,” and “delivery services,” there are clear cost savings from large scale. High fixed costs—the infrastructure and technological expertise necessary to maintain a quality service—can be spread across many customers. Consequently, the respective top two firms of each market command 87 percent of the search engine market, 69 percent of the wireless carriers market, and 76 percent of the delivery services market.
In other markets customers derive direct benefits from the participation of other customers: a social media platform is effective only if it connects users. This connection generates powerful network effects, and the top two firms in this market account for two-thirds of total user visits.
However, the link between network effects and market concentration is not unchangeable: it depends on choices made by businesses and policymakers. For example, the 1996 Telecommunications Act required incumbent carriers to interconnect their services with competitors on nondiscriminatory terms, thereby muting network effects that might otherwise have prevented competition (Noam 2002).
Importantly, estimates of concentration can be sensitive to how markets are defined. In some cases, defining a narrower local market (e.g., subscriber TV in southwest Ohio) will lead to a different assessment of which firms are dominant, and by how much.
Fact 3: Mergers and acquisitions have become more common.
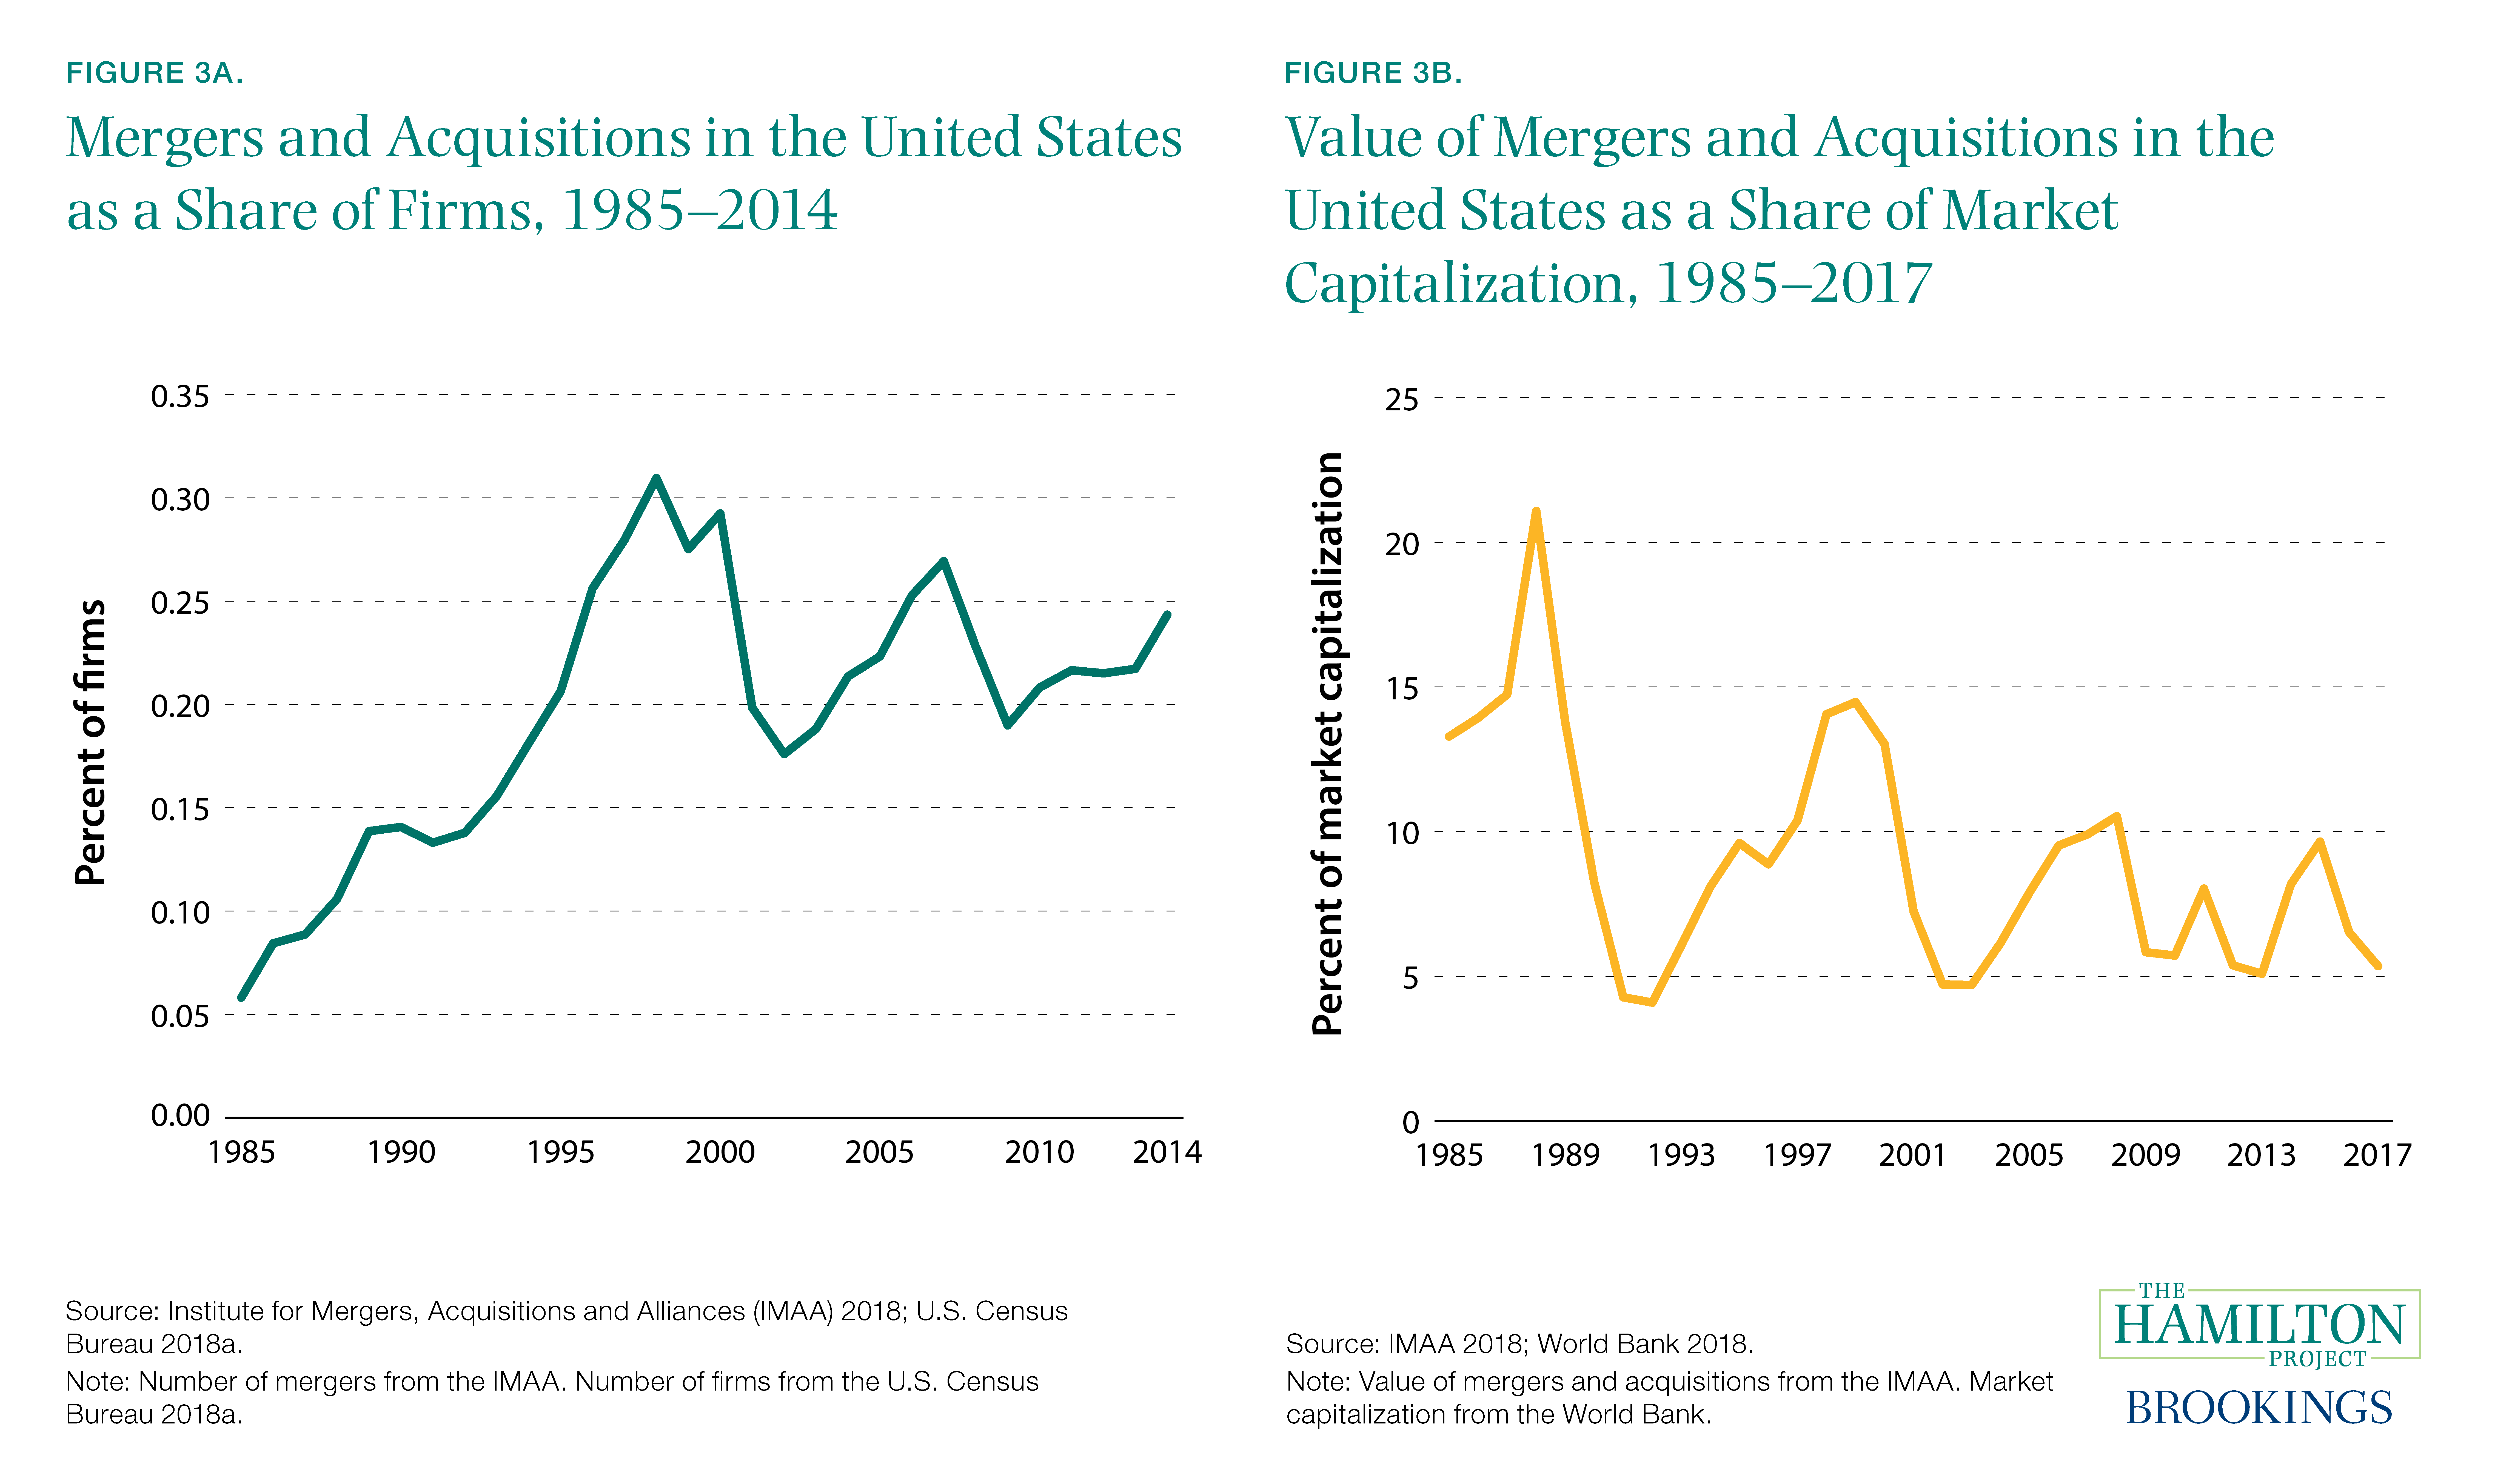
Not all market concentration is due to the normal expansion of businesses as they benefit from returns to scale. Firms frequently merge and acquire each other, combining their activities and pooling their market shares. The airline sector is a case in point: the top four firms served 43 percent of the market in 1985, but in 2017 that share had risen to 72 percent after decades of industry consolidation (Bureau of Transportation Statistics 2018b; authors’ calculations).5
Figure 3a shows the number of mergers and acquisitions (M&A) in the United States as a share of publicly listed companies. From 1985 to 2014 this share has increased from just 0.06 percent to 0.24 percent annually: relatively few firms merge in any given year, but the share has increased considerably. However, this increase was not matched by a similar rise in the value of M&As as a share of market capitalization, shown in figure 3b. One possibility is that M&A activity in earlier years may have removed some of the scope for high-value mergers in subsequent years.
Firms merge for a variety of reasons: to improve business efficiency, to enter new markets and access new technologies, and to acquire or maintain a monopolistic position in an industry, among others. Examining manufacturing M&A activity, one study finds that mergers raised markups (i.e., price relative to marginal cost of production), but did not enhance the productive efficiency of manufacturing plants (Blonigen and Pierce 2016).
Many mergers and acquisitions stem from the importance of technology in production processes. A 2018 survey of about 1,000 corporate executives reported that technology acquisition is a key driver of M&A deals, with 20 percent of respondents saying it is the most important. Executives also placed a high priority on “expanding customer base in existing markets” (19 percent) and “expand/diversify products or services” (16 percent; Deloitte 2018).
Fact 4: Common ownership may increase effective market concentration.
The baseline measurement of market concentration—the standard HHI—depends only on market definition and the market shares of all competitors. However, recent research has explored another variable that may be important for characterizing concentration: the extent to which ownership of competitors overlaps (Schmalz forthcoming). If two firms in a market are owned by the same people, those firms likely have less motivation to compete vigorously than would two firms owned by different people.
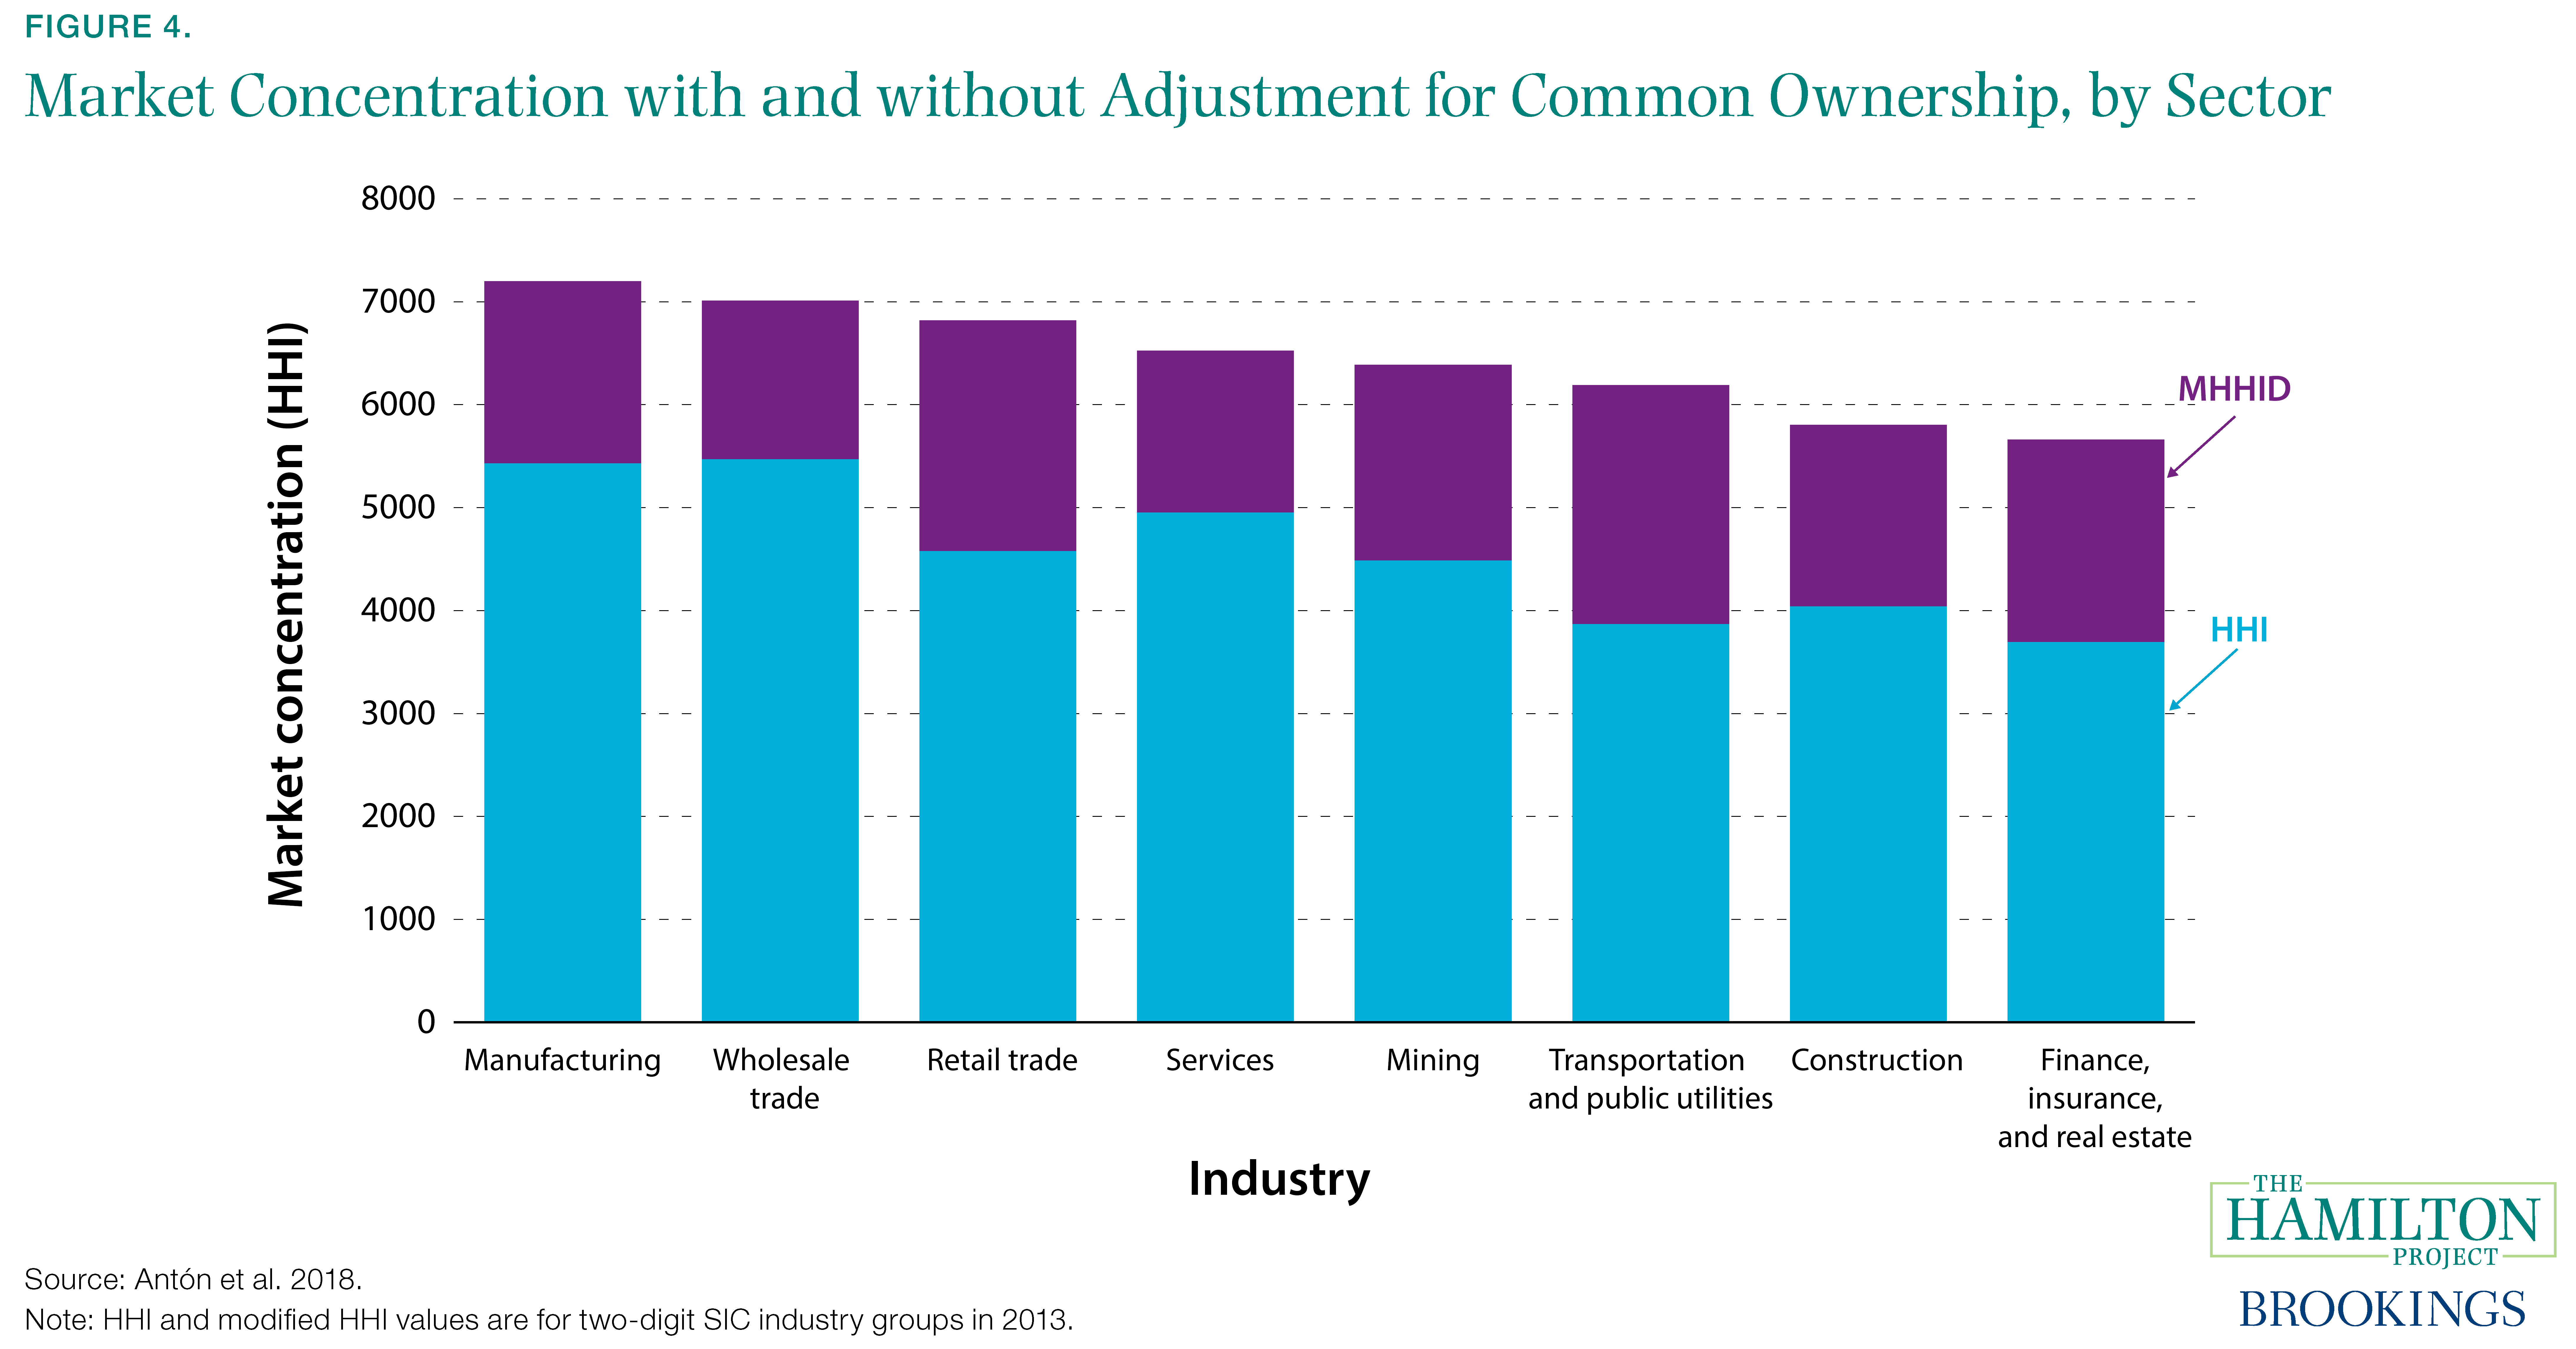
Figure 4 presents estimates from economists Miguel Antón, Florian Ederer, Mireia Giné, and Martin Schmalz of both the baseline HHI (blue bars) and the increment to HHI that is associated with the authors’ measurement of common ownership in that sector (purple bars) (Antón et al. 2018). The additional concentration that they calculate to be associated with common ownership added about 1,000 to HHI in 1994 and nearly 1,700 to HHI in 2013. In other words, common ownership boosted effective concentration to an increasing degree over time.
Much of this common ownership can be ascribed to two related forces: the rise of passive investing and the general investor desire to diversify equity holdings and thereby minimize risk (Posner, Morton, and Weyl forthcoming). Indeed, BlackRock and Vanguard were among the top 10 shareholders of more than two-thirds of public firms (Antón et al. 2018), and institutional investors have increased their share of U.S. equities from 7 percent in 1950 to 70–80 percent in 2010 (McCahery, Sautner, and Starks 2016). In the banking and airline sectors, large active investment firms such as Berkshire Hathaway sometimes own a large (top five) stake in many firms within the same industry (Azar, Raina, and Schmalz 2016; Azar, Schmalz, and Tecu forthcoming).
Some analysts contest whether index funds or other passive funds should be considered owners, given that the investors they represent are the ultimate holders of the asset. It is also controversial whether institutions’ ownership positions are large enough to provide them with influence over business decisions (Kennedy et al. 2017). More research is needed to understand how to measure common ownership and the impacts of ownership on competition. However, antitrust policymakers are beginning to address at least some forms of common ownership. For example, in response to a proposed merger between Red Ventures Holdco and Bankrate, the Federal Trade Commission (FTC) filed a complaint alleging that two of Red Ventures’ largest shareholders jointly owned a service that directly competed with a subsidiary of Bankrate. The parties were ordered to divest from the subsidiary (FTC 2018).
Fact 5: The investment rate has fallen by more than one-third since the early 1960s.
Market concentration has been linked to adverse consumer outcomes in many specific instances; firms with monopoly power can and do exploit their position through higher prices (DOJ 2008; Kwoka, Greenfield, and Gu 2015). Indeed, firms’ markups—one indicator of firms’ pricing power—have likely been rising (De Loecker and Eeckhout 2017). The broad-based increase in concentration, described in fact 1, has therefore prompted questions about broader economic impacts that increasing monopoly power might be causing.
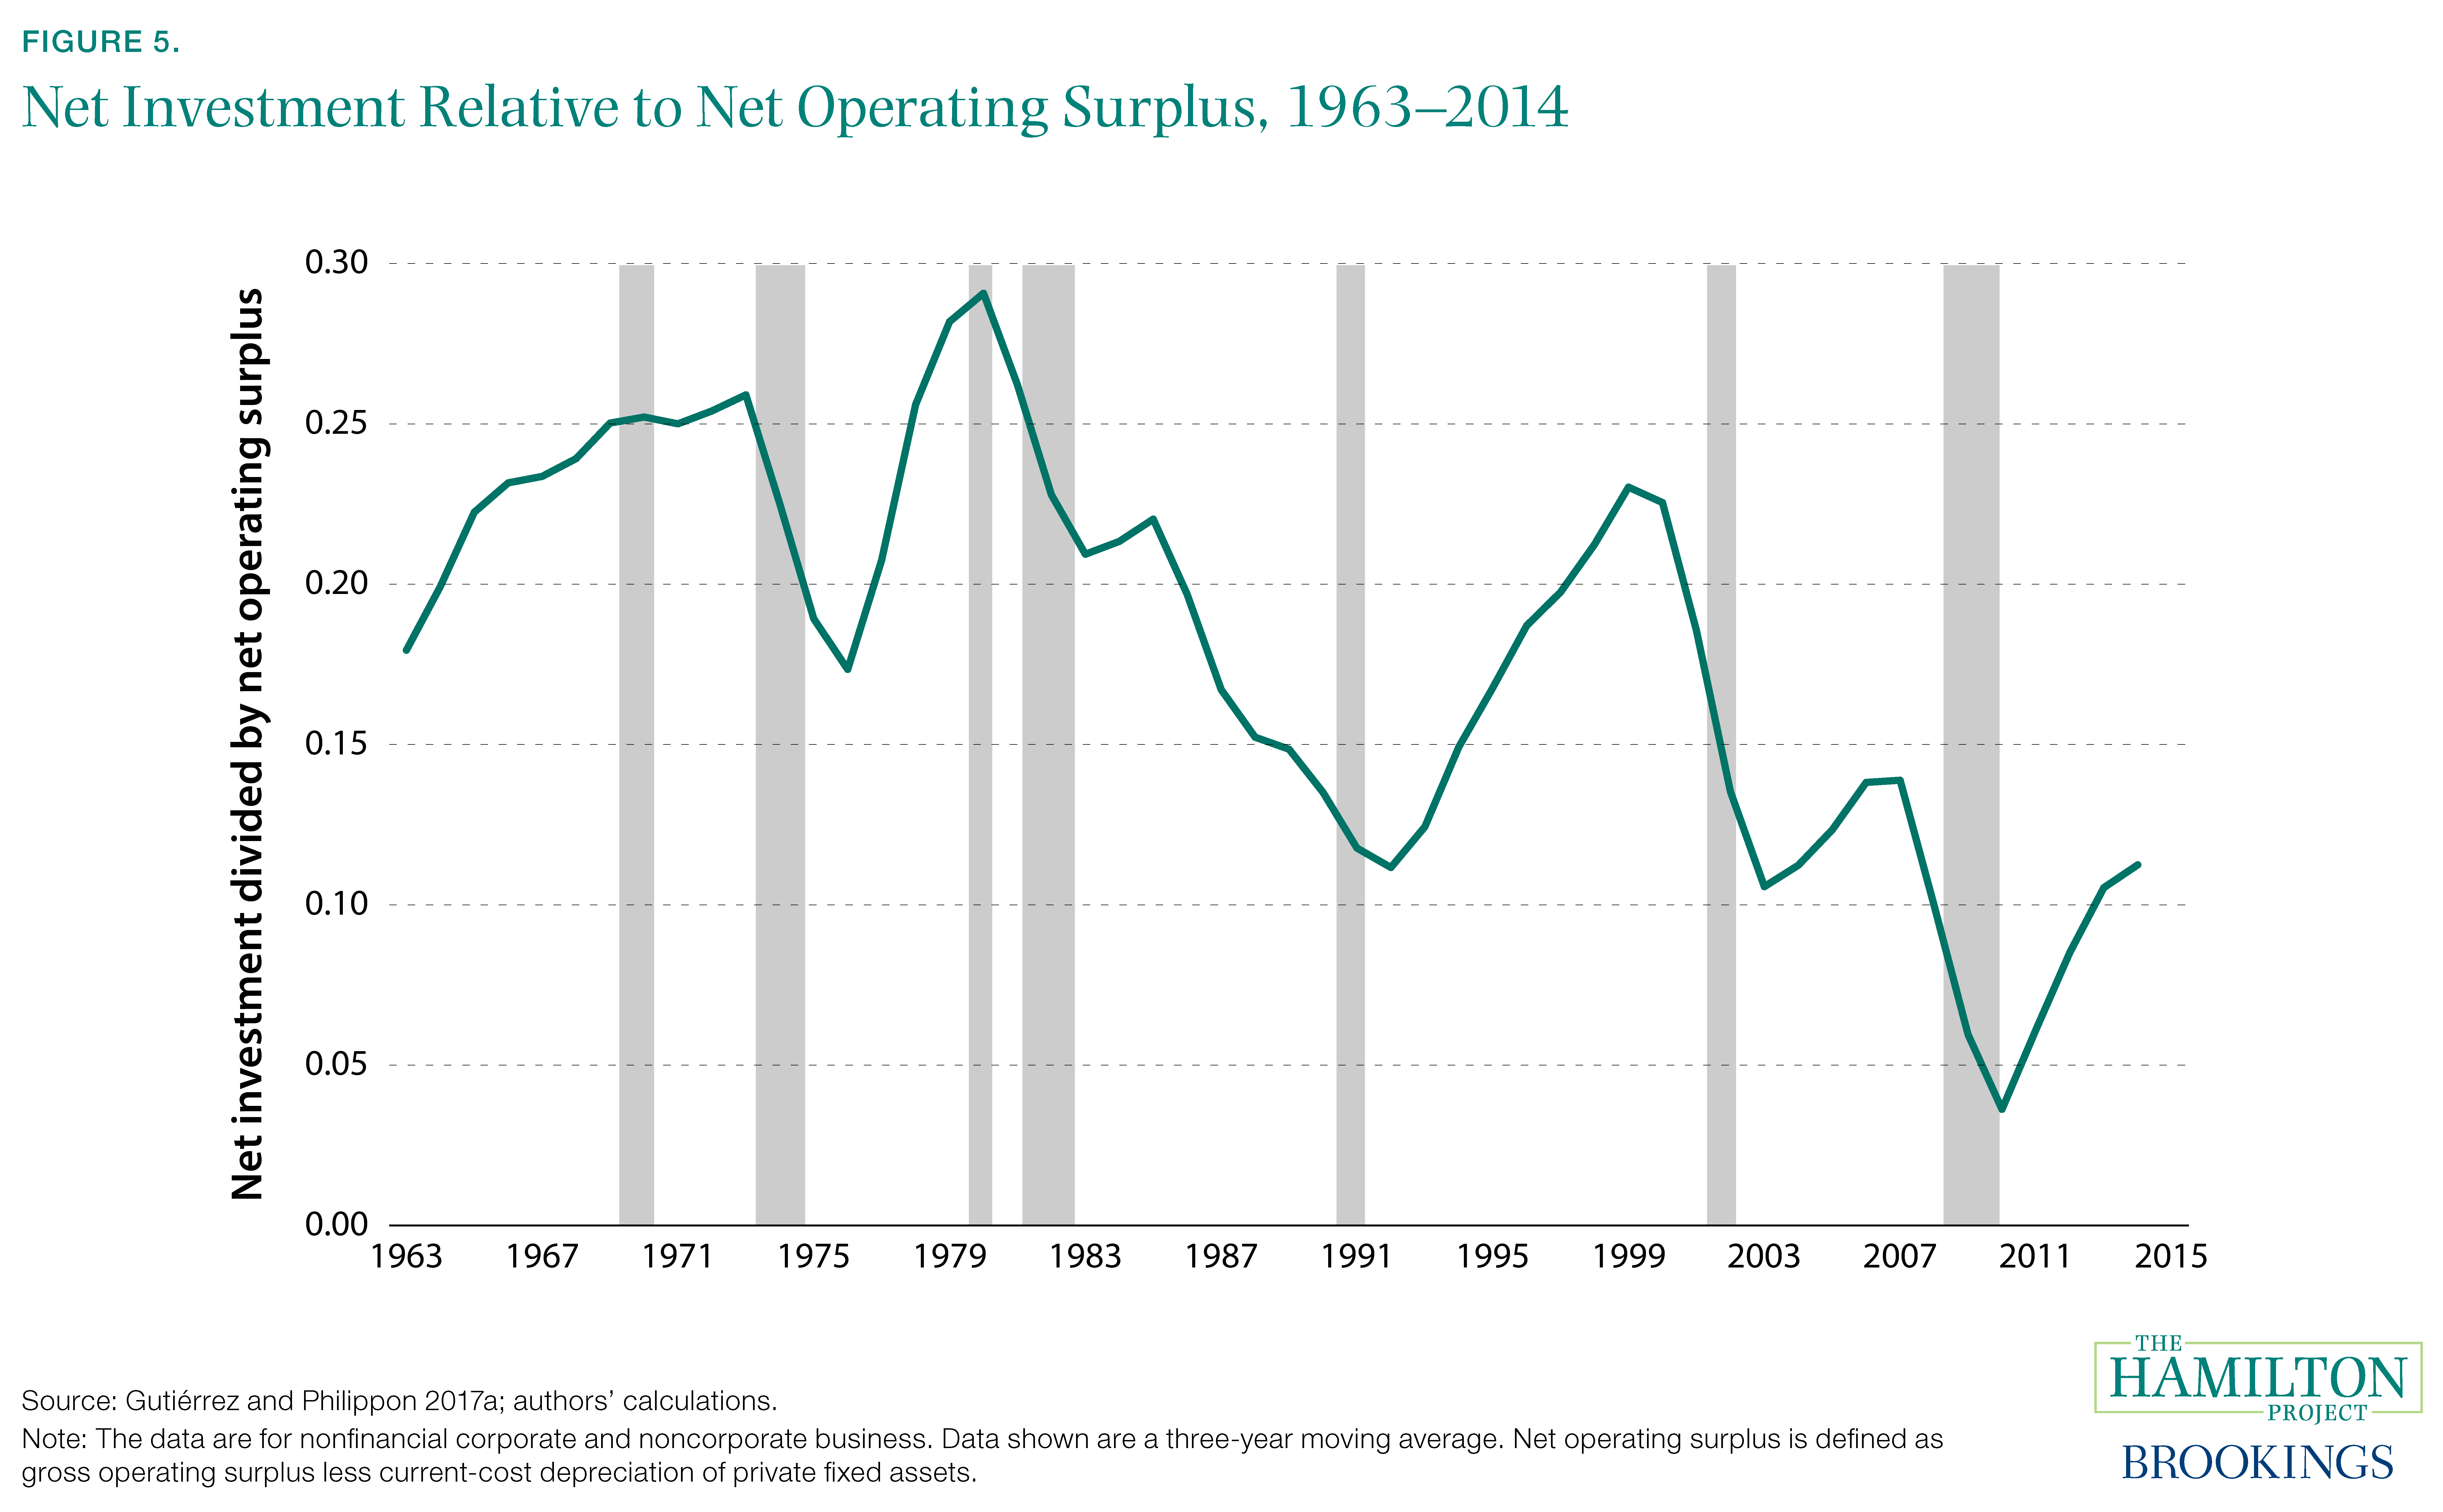
One focus of these questions is the long-run deterioration in U.S. business investment. Figure 5 shows a three-year moving average of net investment divided by net operating surplus from 1963 to 2014. After a strong surge in the 1990s, net investment has fallen to less than half of its 1970s level.
Work by Gutiérrez and Philippon (2017a) suggests that rising concentration is indeed related to the deterioration in investment: after adjusting for firms’ expected profitability and considering a number of alternative explanations, increased concentration emerges as a key driver of falling investment after 2000. Consistent with the research described in fact 4, Gutiérrez and Philippon also find that industries with a larger proportion of passive investment are characterized by diminished investment (though this could be for a variety of reasons).
An alternative explanation for the decline in measured investment—poorly measured intangible investment—also plays a role (Alexander and Eberly 2016). As the name suggests, intangible capital consists of valuable business assets like brand equity, business methods, and technical discoveries, rather than better-measured assets like plants, equipment, and land. Measured investment declines were larger in industries for which intangible capital is more important; Gutiérrez and Philippon (2017a) find that increasing intangible investment can explain as much as a third of the shortfall in measured investment.
Fact 6: Many firms have substantial power in labor markets.
Concentration in product markets can be mirrored by its labor market equivalent—monopsony—that exists when employers face limited competition for workers. In its extreme case, a monopsony is a firm that employs all the workers in a market: an example is a mining company in a remote town that has no other businesses. But many firms have at least some wage-setting power that derives from the willingness of their employees to accept lower wages than they could earn elsewhere.
Economists attempt to quantify this employee willingness to accept lower wages in terms of the so-called labor supply elasticity. That is, what percent lower employment would a firm expect if it offered 1 percent lower wages? In a perfectly competitive labor market, this elasticity would be infinite: any reduction in wages below the competitive rate would result in the departure of all employees for other firms. In practice, this is unlikely to be the case even when there are many employers in a market, primarily because of the time and expense required for workers to find suitable new matches with other employers. This difficulty can be due both to the nature of job search as well as policy-related costs of hiring and employment separation (Diamond 1982; Mortensen and Pissarides 1994; Pissarides 2000).
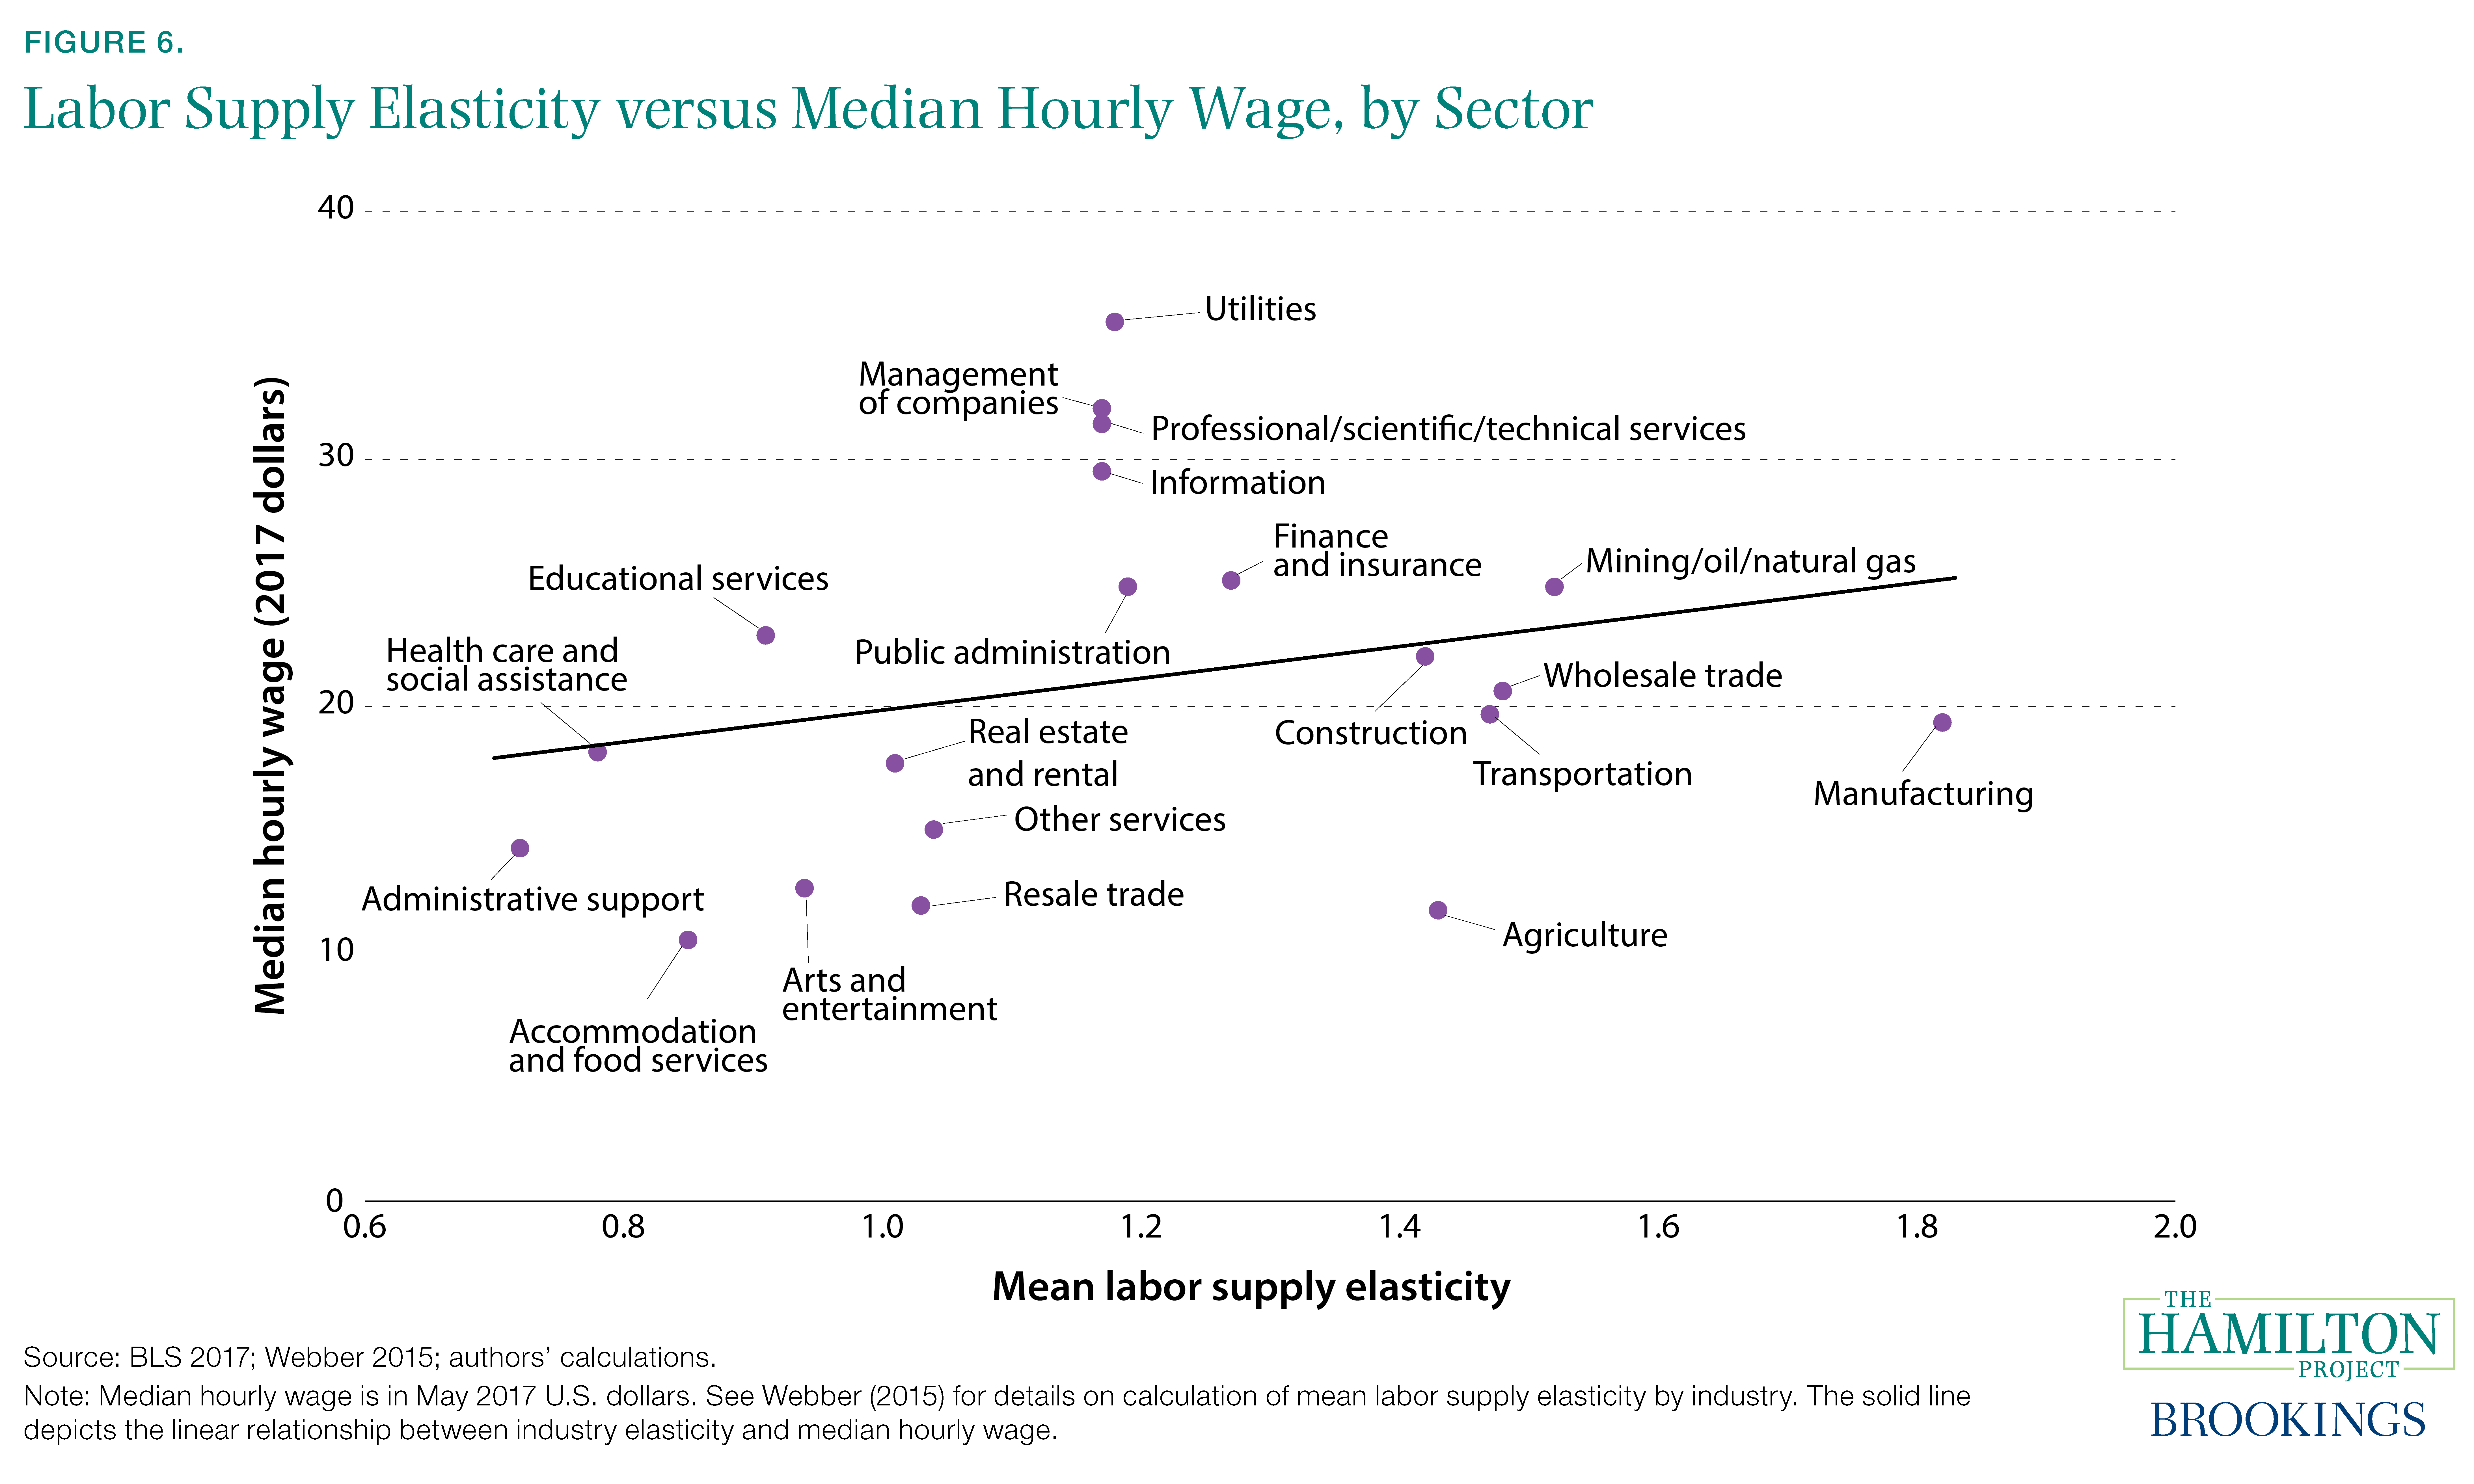
Figure 6 depicts estimates of firm-level labor supply elasticities from Webber (2015), averaged across firms within industries. Firms generally face relatively inelastic labor supply (see also Staiger, Spetz, and Phibbs 2010). In other words, employers can reduce wages without losing all (or even a large fraction) of their workforces. Moreover, typical wages are higher for firms in industries with higher labor supply elasticities—and less monopsony power—both before and after adjusting for worker and firm characteristics (Webber 2015).
However, it is likely that labor supply elasticities are higher over longer periods, which allows workers to eventually find preferred employment. Moreover, Webber (2015) finds evidence that employers do not fully exploit their monopsony power. In addition, better work environments or schedules sometimes offset lower wages, which explains why workers are less apt to leave due to low wages.
Fact 7: Employer concentration appears to be high in many local labor markets.
Rather than estimating monopsony power by looking at the elasticity of labor supply, other researchers have examined the degree of concentration in labor markets.
Figure 7 shows estimates of employer concentration from Azar et al. (2018). The authors examined online job posting data compiled by Burning Glass Technologies and defined hiring markets at the local level for specific occupations. They found striking variation in employer concentration across the country: for example, parts of the Northeast and Southern California have HHI—a measure of business concentration—below 1,500, while numerous rural areas in the Great Plains have HHI above 5,000, indicating extreme concentration. This concentration may matter for the wages that employers advertise: Azar, Marinescu, and Steinbaum (2017) find that an increase from the 25th to the 75th percentile in HHI is associated with a 17 percent decline in posted wages.
Rather than focus on vacancies, Benmelech, Bergman, and Kim (2018) study employment shares within industries and across counties, and find that concentration has been growing over time. Benmelech, Bergman, and Kim also find a substantial impact of concentration on manufacturing wages even when controlling for local economic conditions and when studying wages at different plants within the same firm. They find this effect has been getting stronger more recently and that less concentration is associated with a more direct transmission of productivity growth to wages. Interestingly, unionization appears to mitigate the negative impact of concentration on wages.
The potential link between employer concentration and wages is still the subject of an active research discussion. As with diagnosing monopoly power, understanding the boundaries of the market is both crucial and difficult. Posted vacancies might not accurately capture the true range of job options for workers; in addition, many workers can move across industries. Still, the observed associations between local concentration and wages—combined with the fact that concentration appears to be growing—suggest that the relationship between concentration and wages deserves more research and policy attention.

Chapter 2: Policy Responses to Firm Market Power
Introduction
Market concentration has long concerned policymakers, and the leading tool to address it has been antitrust regulation. Antitrust policy has its origins in the Sherman Antitrust Act of 1890 and the Clayton Act of 1914, but the details of regulatory policy have evolved over time. In the modern era, the Merger Guidelines of 1982 (DOJ 1982)—and subsequent revisions—have directed enforcement of antitrust law (Kwoka and White 1999).
The Standard Approach to Antitrust Enforcement
From its early stages, antitrust policy has focused on the potential for market power to harm consumers or other purchasers by raising prices. The law considers three primary ways in which this can occur. First, individuals might attempt to fix prices in a market. Second, a firm might exploit its dominant position to obtain a new monopoly, or to maintain its monopoly through “unreasonable” methods, as was alleged in United States v. Microsoft Corp. (2001). Third, firms might attempt to merge, thereby increasing their combined market power (Baker 2003).
The antitrust consumer welfare orientation directly informs how regulators assess proposed mergers. Regulators first attempt to define the relevant market by determining the set of products and places that are within its scope. This is crucial to any review of a proposed merger: the more expansively lines are drawn, the less likely a merger will appear to impair competition (Katz and Shelanski 2007).
Next, regulators calculate the increase in market concentration, as captured by the HHI, that would result from the merger, as well as the post-merger HHI level.6 If the post-merger HHI falls below a given threshold (1,500 in the Merger Guidelines), regulators consider the market unconcentrated and are unlikely to mount a challenge. Indeed, the FTC notes that about 95 percent of merger proposals raise no competition issues (FTC n.d.). By contrast, a proposal that would cause market HHI both to rise by 200 points and then exceed 2,500 is presumptively anticompetitive and will often be challenged (DOJ and FTC 2010). These thresholds are not part of an inflexible, uniformly applied formula, but they give a rough sense of how the DOJ and FTC are likely to begin their evaluation of merger proposals.
Regulators will then attempt to analyze the proposed merger’s effects on competition; these effects may depend on idiosyncratic features of the particular market, including any offsetting efficiencies that the merger would generate and the potential for new market entry. If regulators judge action to be needed, they will consider a few options. They might approve the merger with conditions (e.g., sale of a subsidiary business), apply postmerger limitations (e.g., a firewall preventing certain kinds of information sharing within the merged firm, or a limitation on the merged firm’s ability to charge its customers different prices), or simply block the merger outright (DOJ 2011; Katz and Shelanski 2007).
Changing Thinking about Antitrust and Recent Regulatory Actions
Antitrust enforcement continues to evolve, and recent research implies four key lessons for antitrust policy that are not fully incorporated into existing practice:
It is increasingly apparent that the market power of employers is an important policy concern, and policymakers might need to extend antitrust enforcement to encompass it (Marinescu and Hovenkamp 2018; Naidu, Posner, and Weyl forthcoming; Krueger and Posner 2018).
It is now necessary to refine the traditional antitrust framework when prices charged to consumers are zero, as is the case with many online businesses (Newman 2015). The traditional antitrust emphasis on consumer prices might be insufficient when addressing online platforms that are characterized by strong returns to scale (Khan 2017).
Antitrust regulators increasingly must grapple with dynamic questions of competition and innovation (Katz and Shelanski 2007; Shelanski 2013). The FTC and DOJ’s approach to innovation has evolved over time to place more emphasis on innovation (DOJ and FTC 2010). For example, the FTC blocked a merger of heart device manufacturers in 2009 based on the argument that it would reduce innovative pressure (Farrell, Pappalardo, and Shelanski 2010). Other nonmerger related policy shifts may be needed as well to bolster innovation in the face of rising concentration.
Common ownership of firms may diminish incentives for competition (Azar, Schmalz, and Tecu forthcoming). In the extreme case, two firms with identical ownership would have no incentive to compete with each other; partially common ownership would diminish this incentive. Regulators may need to consider or constrain either common ownership or the voting behavior of large families of funds.
In addition to restricting mergers, antitrust authorities also monitor firms’ behavior to ensure they are not abusing whatever market power they have. Both the DOJ and the FTC have the authority to police anticompetitive practices, responding to violations that might either abuse or enhance a firm’s market power. The DOJ also polices collusion, price-fixing, and other such anticompetitive behavior, typically in markets with a limited number of competitors where collusion is more feasible. Total fines for criminal antitrust violations hit a new high in 2014 (CEA 2016), though whether that represents increased enforcement or increased anticompetitive behavior by firms cannot be established.
Beyond merger control and criminal prosecutions, governments can take several sector-specific steps to enhance competition using other regulatory policies. For example, the U.S. Department of Transportation has authority over the allocation of airport capacity and can help ensure robust competition in certain capacity-constrained airports. The Federal Communications Commission (FCC) ruled in favor of net neutrality, aiming to prevent broadband providers from using their market power to privilege certain content (although these regulations were subsequently reversed; FCC 2018). Since 2003, FCC rules have given consumers the rights to their cellphone numbers, facilitating portability across carriers and enhancing competition in wireless communications (Kessing 2004). More recently, in 2016 the Obama administration issued an executive order instructing agencies to use their authorities to promote competition (White House 2016).
Broadly, merger enforcement and criminal antitrust sanctions will remain the core bulwark against declining competition. But the FTC and DOJ will likely need continued help from a variety of regulatory authorities. For example, where market power exists, mandating greater interoperability across devices or platforms and limiting the ability of firms to force vertical integration can be important for competition.7 In a Hamilton Project policy proposal, Joshua Gans (2018) discusses how giving users a right to identity portability on online platforms would weaken network effects and enhance competition.
Fact 8: Fewer mergers are being blocked when at least five competitors would remain.
Antitrust regulators must take account of the many specific, idiosyncratic features of a merger proposal and the market it would impact. However, there are regularities in antitrust enforcement. Mergers tend to be approved when a sizable number of significant competitors remain in a market, or, alternatively, when HHI is low and a merger would not increase it by much (DOJ and FTC 2010).
The stringency of antitrust enforcement can also change over time. But it is difficult to infer changes in stringency from changes in regulatory outcomes. Outcomes are the product of multiple factors including DOJ and FTC actions, firms’ behavior (i.e., their level of aggressiveness in pursuing mergers), and changes in market structure that occur for reasons unrelated to merger activity; for example, rising returns to scale will tend to raise HHI even absent any mergers. Ultimately, what matters for markets is how many and what kinds of mergers regulators allow to occur.
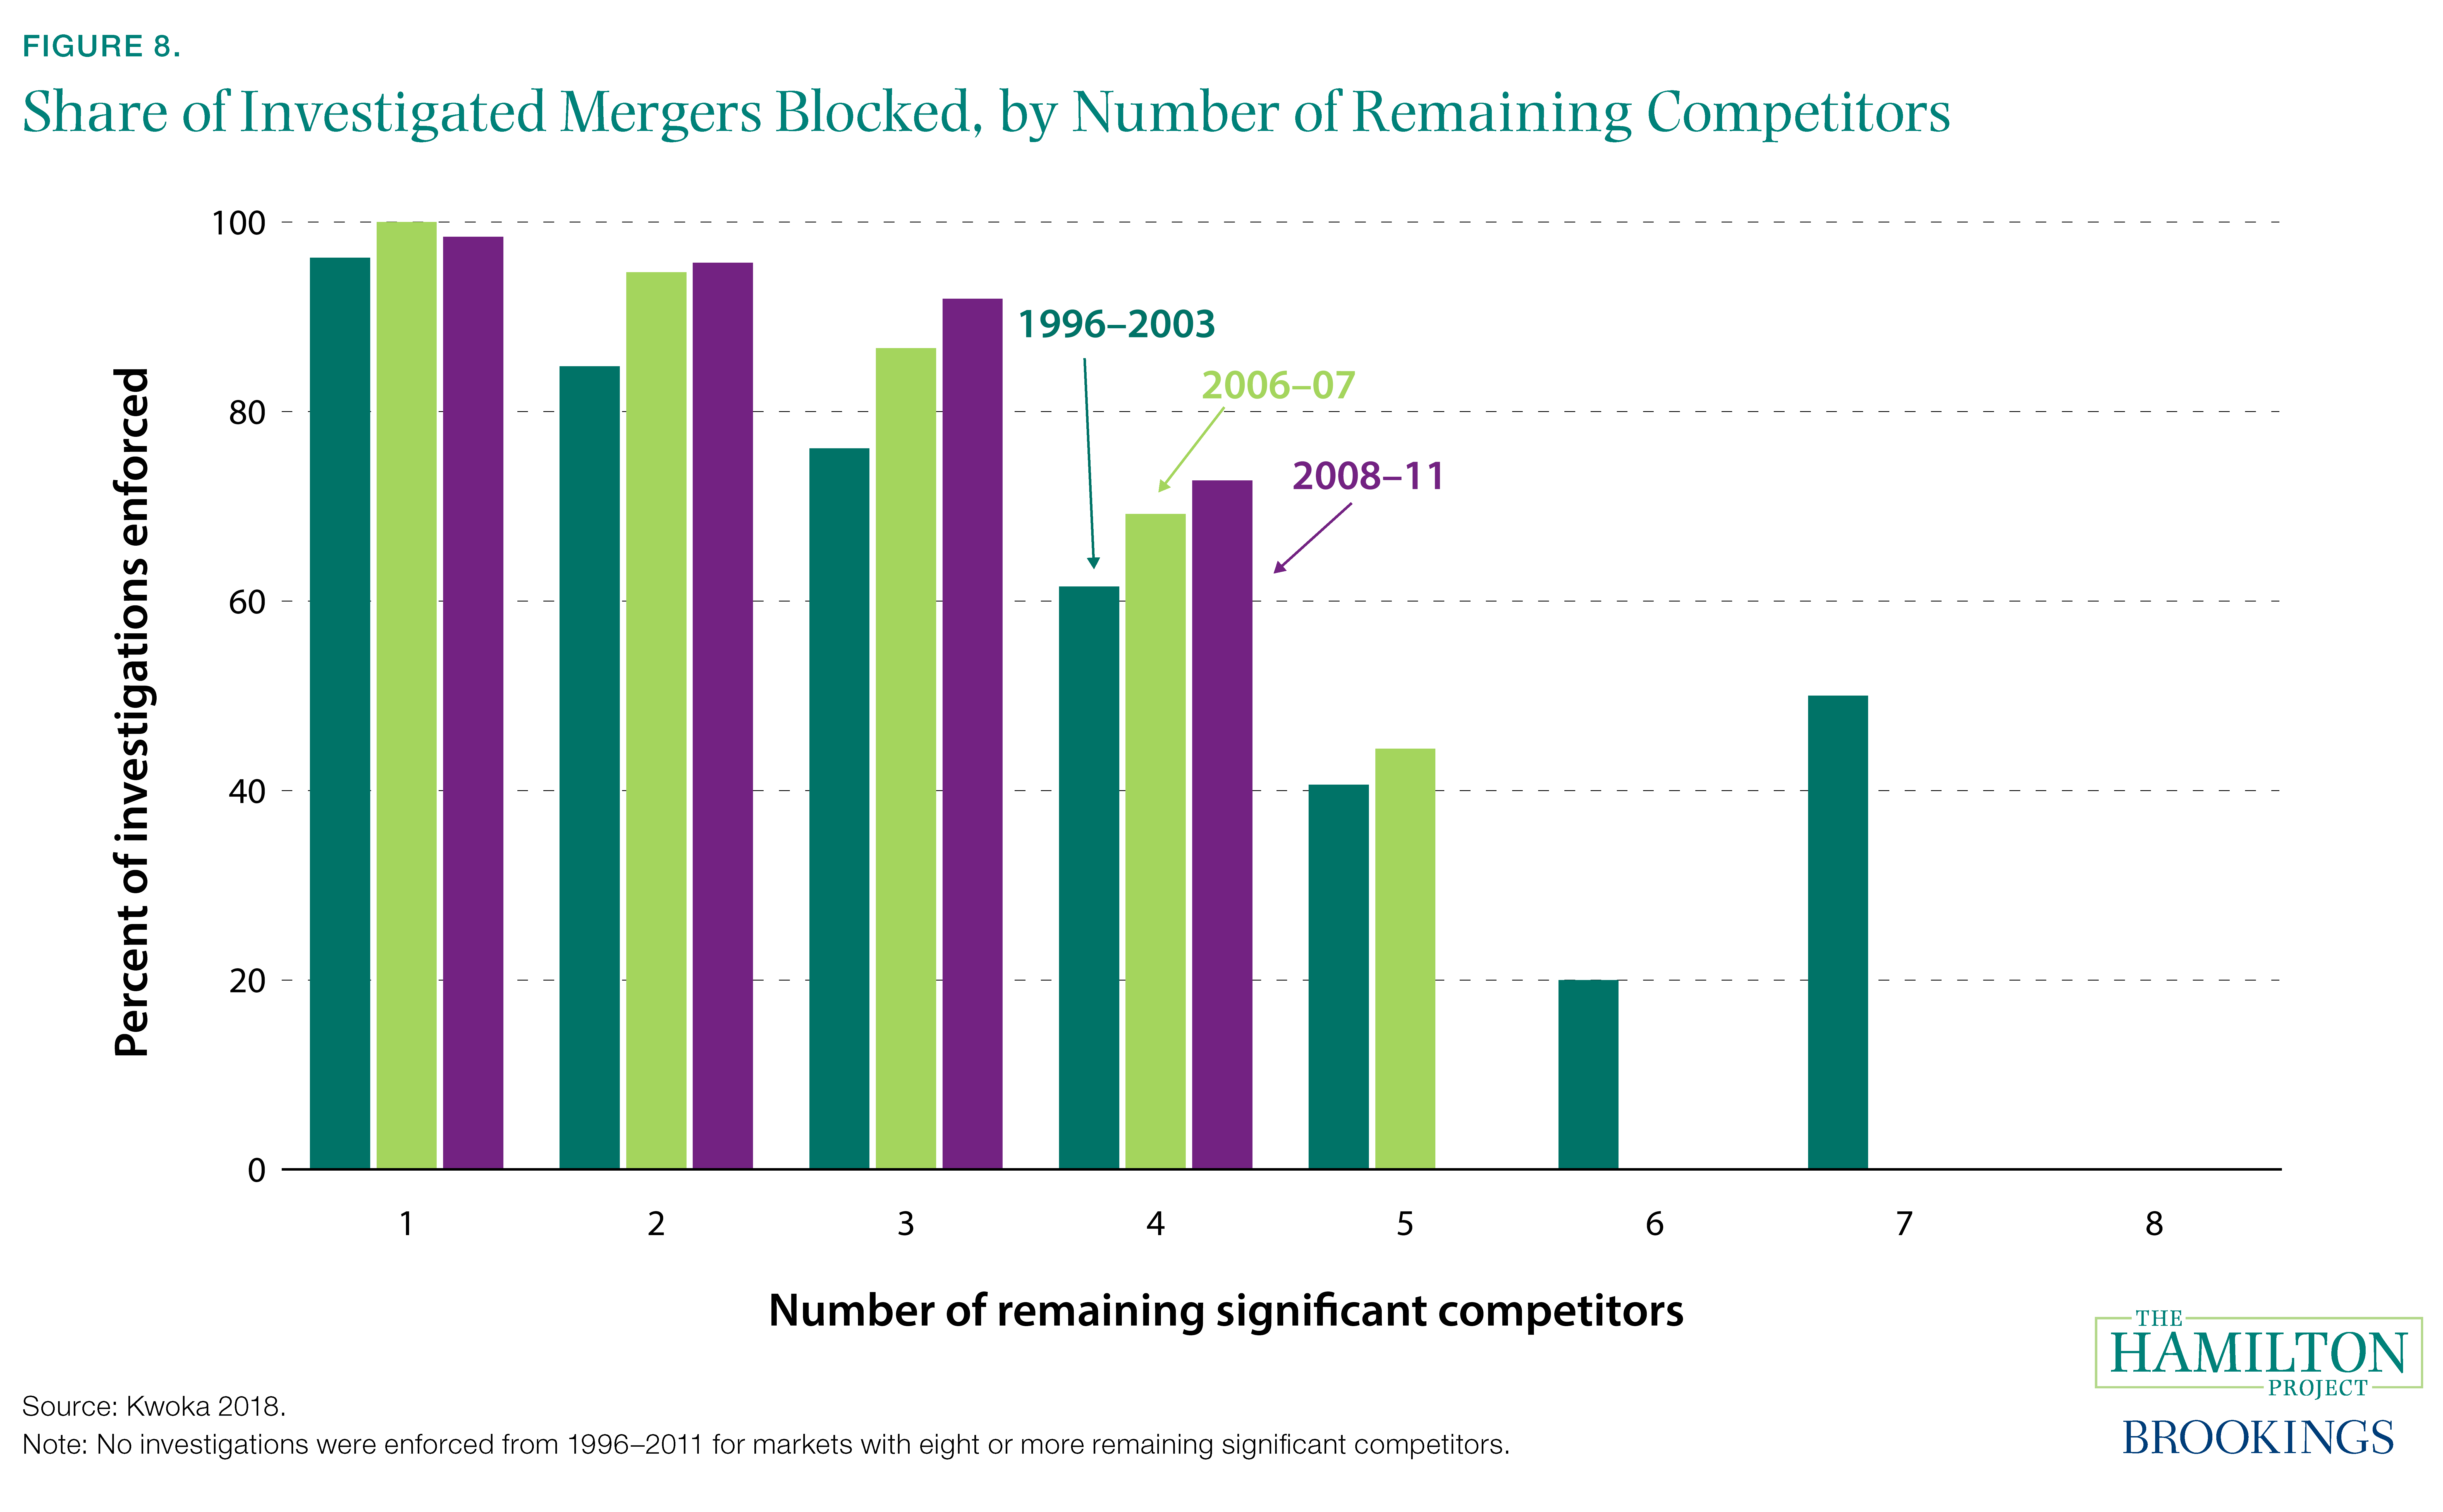
Figure 8 shows FTC statistics on merger enforcement provided by John Kwoka (2018). Mergers that would leave only one or two remaining competitors are nearly always blocked, while mergers leaving three or four competitors are only sometimes challenged. In recent years antitrust regulators have not brought enforcement actions against proposed mergers that would leave five or more significant competitors. Interestingly, this has not always been the case. Antitrust regulators have become much less likely to act against mergers that would leave five, six, or seven competitors, while becoming slightly more likely to block mergers that would leave only one to four competitors. A similar pattern is observed by post-merger HHI.
Merger policy extends beyond merely blocking or permitting mergers. Of investigated mergers for which agency decisions and actions were disclosed, half were subject to divestiture or conduct requirements (Kwoka, Greenfield, and Gu 2015). In other words, firms were permitted to merge on condition of abiding by restrictions that regulators deemed necessary to ensure robust competition.
Chapter 3: Declining Business Dynamism
Introduction
At the same time that markets are becoming more concentrated, they are also becoming less dynamic: the number of business start-ups is falling, recently created firms generate fewer jobs than their predecessors, and a smaller fraction of individuals are becoming entrepreneurs. To understand how market competition is changing, it is necessary to examine the life cycle of businesses and how changes in it have affected wages and productivity.
The Importance of Young Firms
In recent years it has become clear that young firms—and not necessarily small firms, as is commonly supposed—are the engine of employment and productivity growth in the United States (Haltiwanger et al. 2017; Horrell and Litan 2010; Pugsley and Şahin 2015). As they introduce new technologies and business methods, new firms contribute substantially to productivity growth (Acemoglu et al. 2017; Alon et al. 2018; Decker et al. 2014). More broadly, the reallocation of workers from low- to high-productivity firms generates substantial improvement in productivity (Decker et al. 2017; Foster, Grim, and Haltiwanger 2016).
It is therefore discouraging to observe that young firms (i.e., market entrants) account for a declining share of employment (see fact 10). In addition, the percent of start-ups has declined in all major sectors (see fact 9). These developments might be of less concern if innovation and productivity growth were increasingly located in large, incumbent firms. While some large firms may be engaged in research and make greater strides in innovation, there has not been a noticeable recent increase in measured productivity growth on average at older firms (Alon et al. 2018).
These trends are both a symptom and a cause of declining market competition. To the extent that rising market concentration is associated with increasing barriers to entry, concentration will both reduce the incentive to start new businesses and limit the potential of start-ups to expand into new markets (Hathaway and Litan 2014). But fewer (and smaller) start-ups also mean less competition for incumbent firms.
In either case, diminished business dynamism imposes economic costs. This can have important effects on wage growth through a decline in job offers and job switching, as discussed in a Hamilton Project framing paper by Shambaugh, Nunn, and Liu (2018). With fewer firms bidding less aggressively for workers, the so-called job ladder functions less effectively (Haltiwanger et al. 2018; Moscarini and Postel-Vinay 2016). Both wages and productivity suffer when workers move more slowly from low- to high-productivity firms. This phenomenon is especially pronounced during recessions and their aftermath, when diminished labor demand leads to slower operation of the job ladder (Barlevy 2002; Haltiwanger et al. 2018).
Start-up Quality and Potential Growth
Declining business dynamism makes it especially urgent to understand the role of start-ups in generating employment and economic activity. What do we know about the characteristics of successful start-ups and the conditions that allow them to prosper?
Any analysis of start-ups should start with an acknowledgment of their extreme variability. Entrepreneurs do not all aim at the same target: some start-ups are created by subsistence entrepreneurs who aim strictly to support themselves and their families, while others are created by transformational entrepreneurs who seek to build a large business. Moreover, there appear to be few transitions over time from the former to the latter categories (Gompers, Lerner, and Scharfstein 2005; Schoar 2010). Though educational attainment is not a perfect proxy for entrepreneurs’ aims, it is worth noting that people with at least a four-year degree have become much less likely to operate their own businesses over the past 25 years, while those with a high school diploma or less continue to do so at a roughly constant rate (see fact 12).
Start-ups vary tremendously in the outcomes they achieve. A few start-ups—often referred to as gazelles—will experience high employment growth rates. Some firms will persist at a small size, while others will come in and out of existence over short periods (Pugsley, Sedlacek, and Sterk 2018). Unsurprisingly, it is principally the gazelles that are the focus of economists interested in the labor market and economic growth.
At different times and in different regions of the country, start-ups have had varying chances of successful growth; areas with high measured quality of entrepreneurship have tended to experience higher rates of economic growth (Guzman and Stern 2016). While the Boston and Silicon Valley regions are host to particularly high-quality start-up activity, cities like Miami host start-ups that are less likely to grow quickly.
But the success of start-ups is not entirely a function of their own characteristics; market conditions affect their chances of success. One frequently cited variable is the availability of financing: small firms might have a harder time finding financing today than they did in the past.8 Surveys of loan officers indicate that lending standards were dramatically tightened during the Great Recession but were loosened after the first few years of the recession. Interestingly, these surveys suggest that small and large firms were affected in roughly equal measure (Board of Governors of the Federal Reserve System 2017). Still, to the extent that consumer credit or home equity lines of credit are often financing sources for very early-stage start-ups, a reduction in the amount of home equity due to the crash in housing prices or a general tightening of consumer credit standards could have had a disproportionate impact on small firms. Policy conditions also play an important role in start-up performance and chapter 4 will highlight some important considerations.
Fact 9: Start-up rates are declining across all sectors.
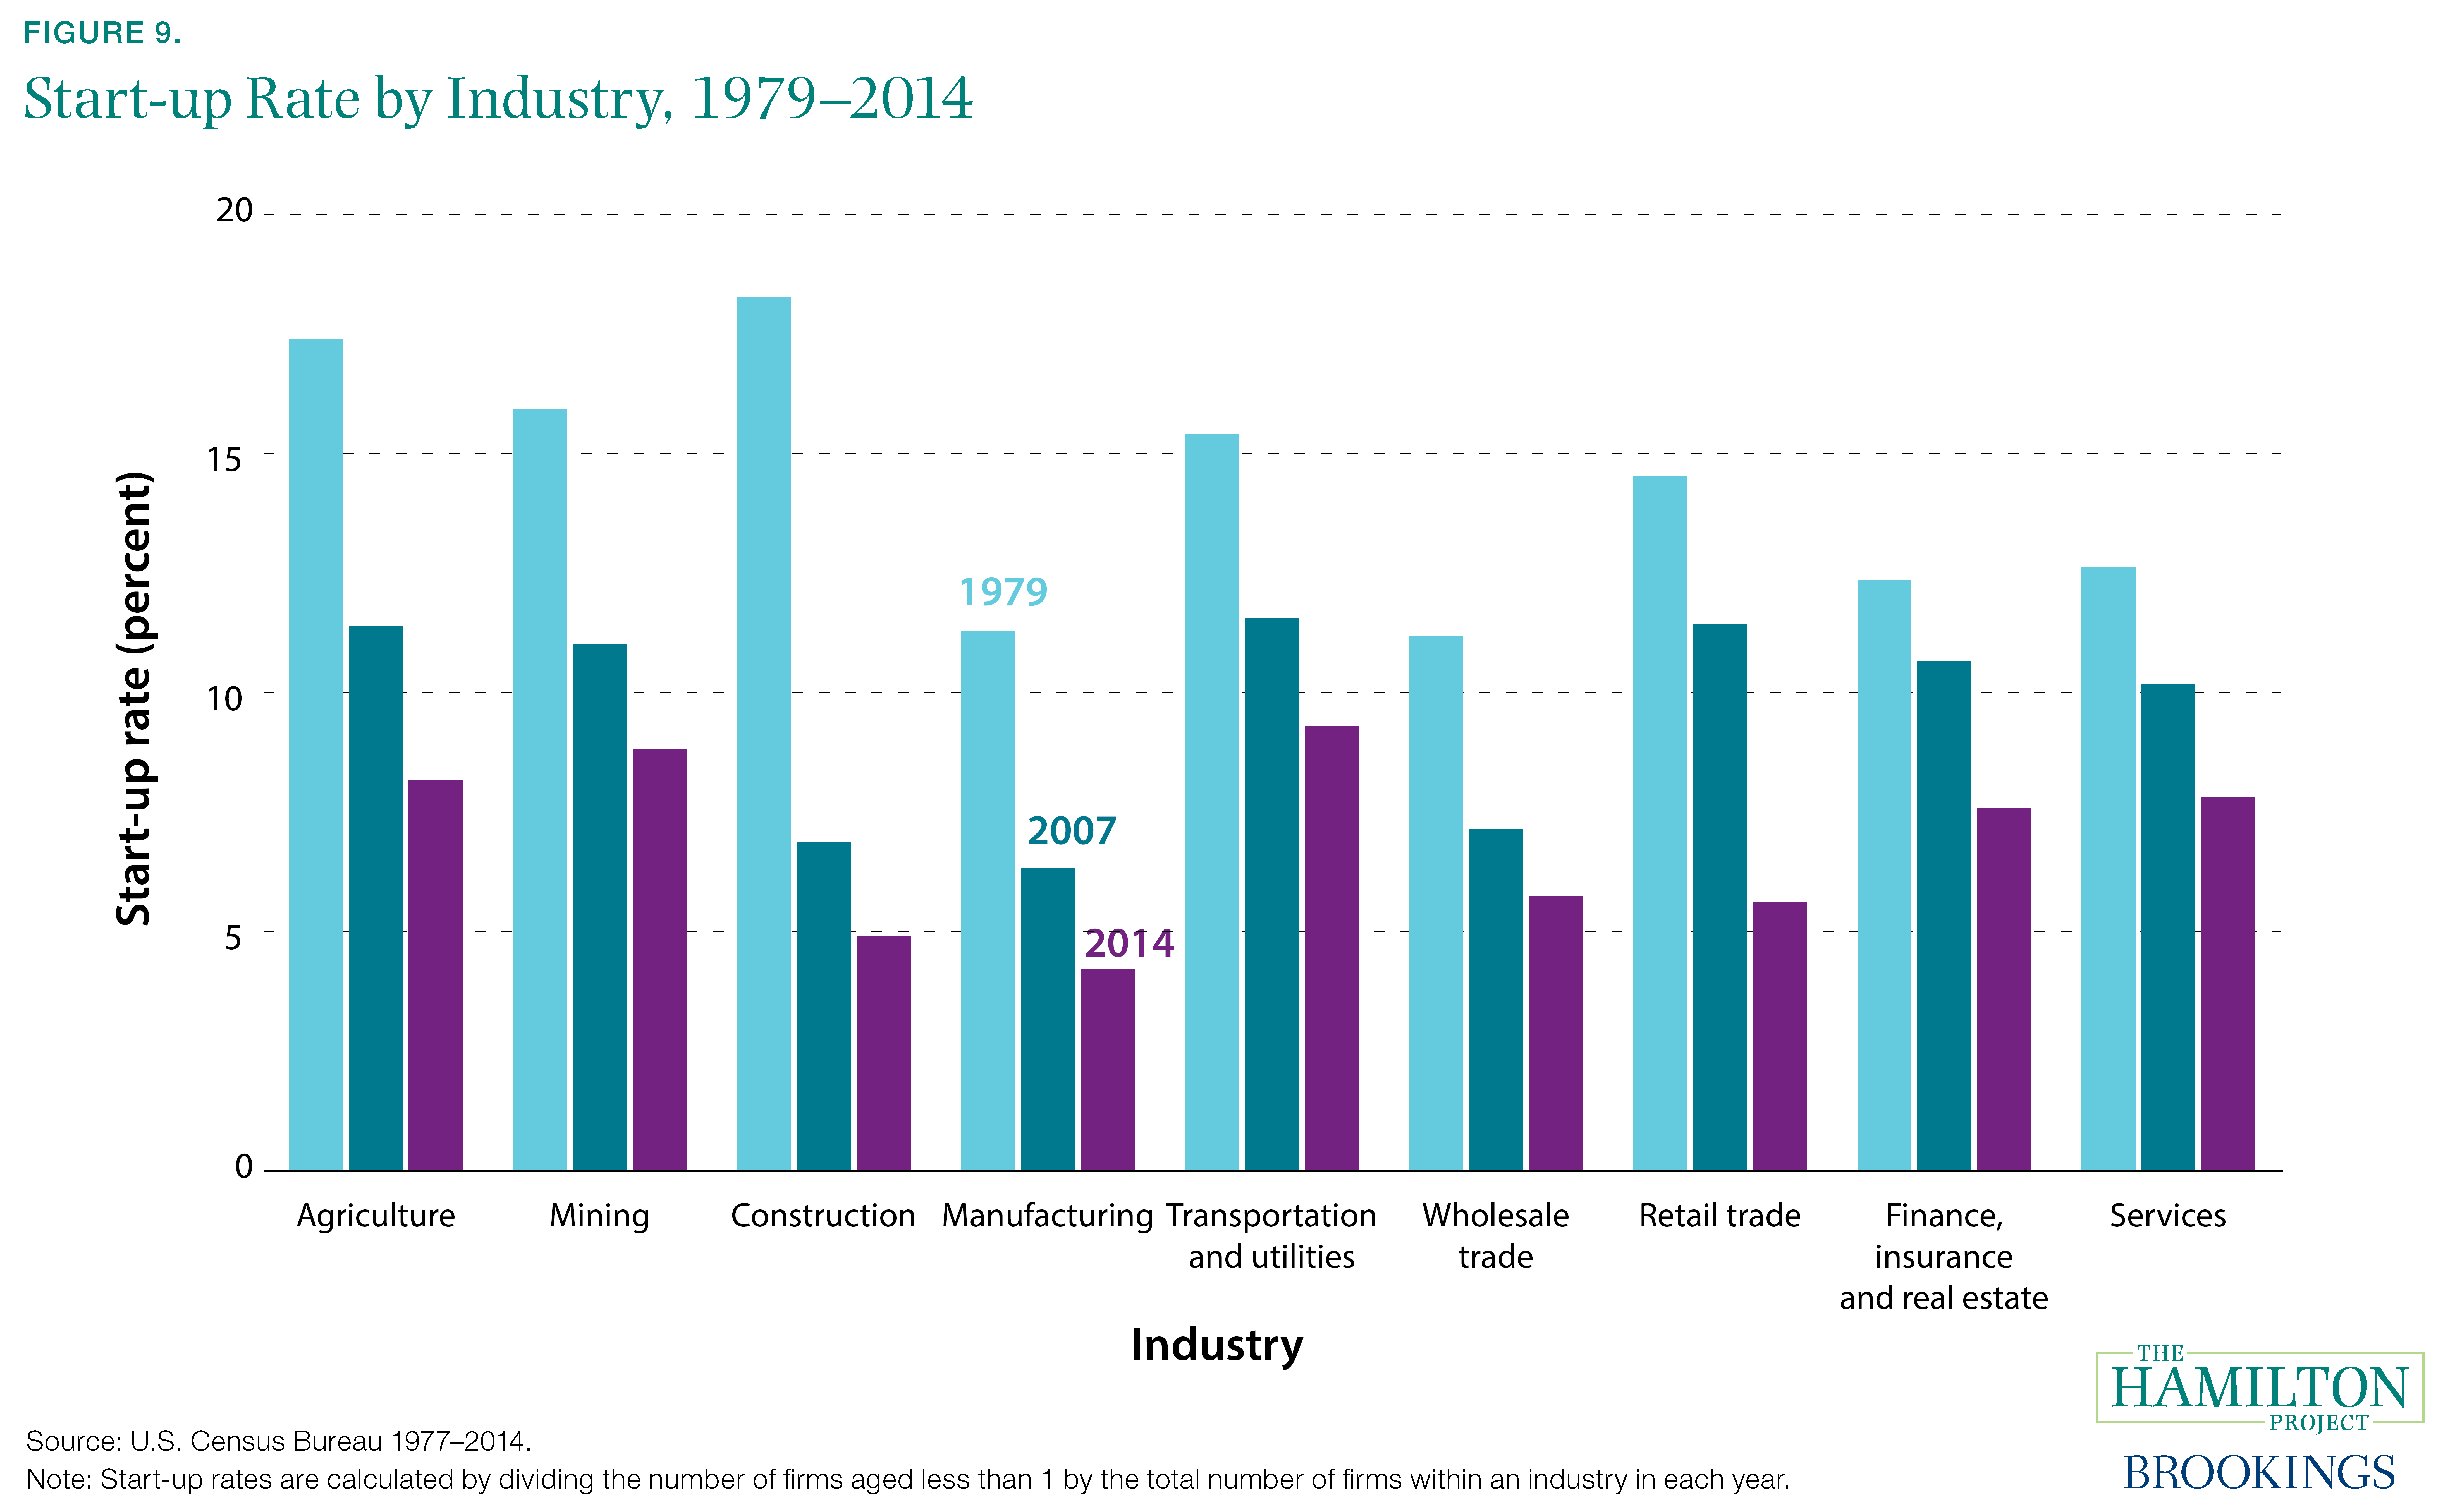
Across sectors of the economy, business start-ups are less common than they were decades ago. Figure 9 shows start-up rates in 1979, 2007, and 2014; the continuous decline across those three years demonstrates that the disappearance of start-ups is an ongoing trend and not primarily a cyclical phenomenon. Additionally, the consistent fall in start-up rates across industries is suggestive of a broad-based rather than sector-specific trend.
The fall in start-up rates has had negative effects on productivity growth. Replacement of low-productivity firms with high-productivity young firms, and reallocation of workers to the highest-productivity firms, are both crucial mechanisms for raising economic output and living standards (Alon et al. 2018; Haltiwanger et al. 2017). The fall in start-ups after 2000 was particularly pronounced for high-tech firms within the industries shown in figure 9; the high-tech sector has historically been a strong source of job creation and productivity growth (Decker et al. 2016).
Though declining business dynamism is not entirely understood, several factors have been identified as likely contributors. One important possibility is that increased market concentration is making the environment for start-ups inhospitable. Controlling for region-specific factors, Hathaway and Litan (2014) find that changes in the business consolidation rate (the ratio of mean firm size to mean establishment size) are negatively associated with changes in start-up rates at the metropolitan area level from 1978–80 to 2004–06.
Another possibility is that the declining start-up rate is partially a result of declining population growth, which reduces the supply of labor and consequently the capacity for new businesses to start and scale up (Karahan, Pugsley, and Şahin 2018). In addition to demographic trends, public policies ranging from non-compete contracts to land-use policies could have important roles (Shambaugh, Nunn, and Liu 2018). As discussed in chapter 4 of this document, there are also concerns that increasing regulations may make it more difficult for new firms to start.
Fact 10: The employment share of young firms has decreased by more than one-third since 1987.
While the fall in the start-up rate is striking, it does not address some important questions about business dynamism. Is the decline part of a more general disappearance of small businesses? How is the decline in start-ups affecting the labor market? And what is happening to firms after they age out of the start-up category?
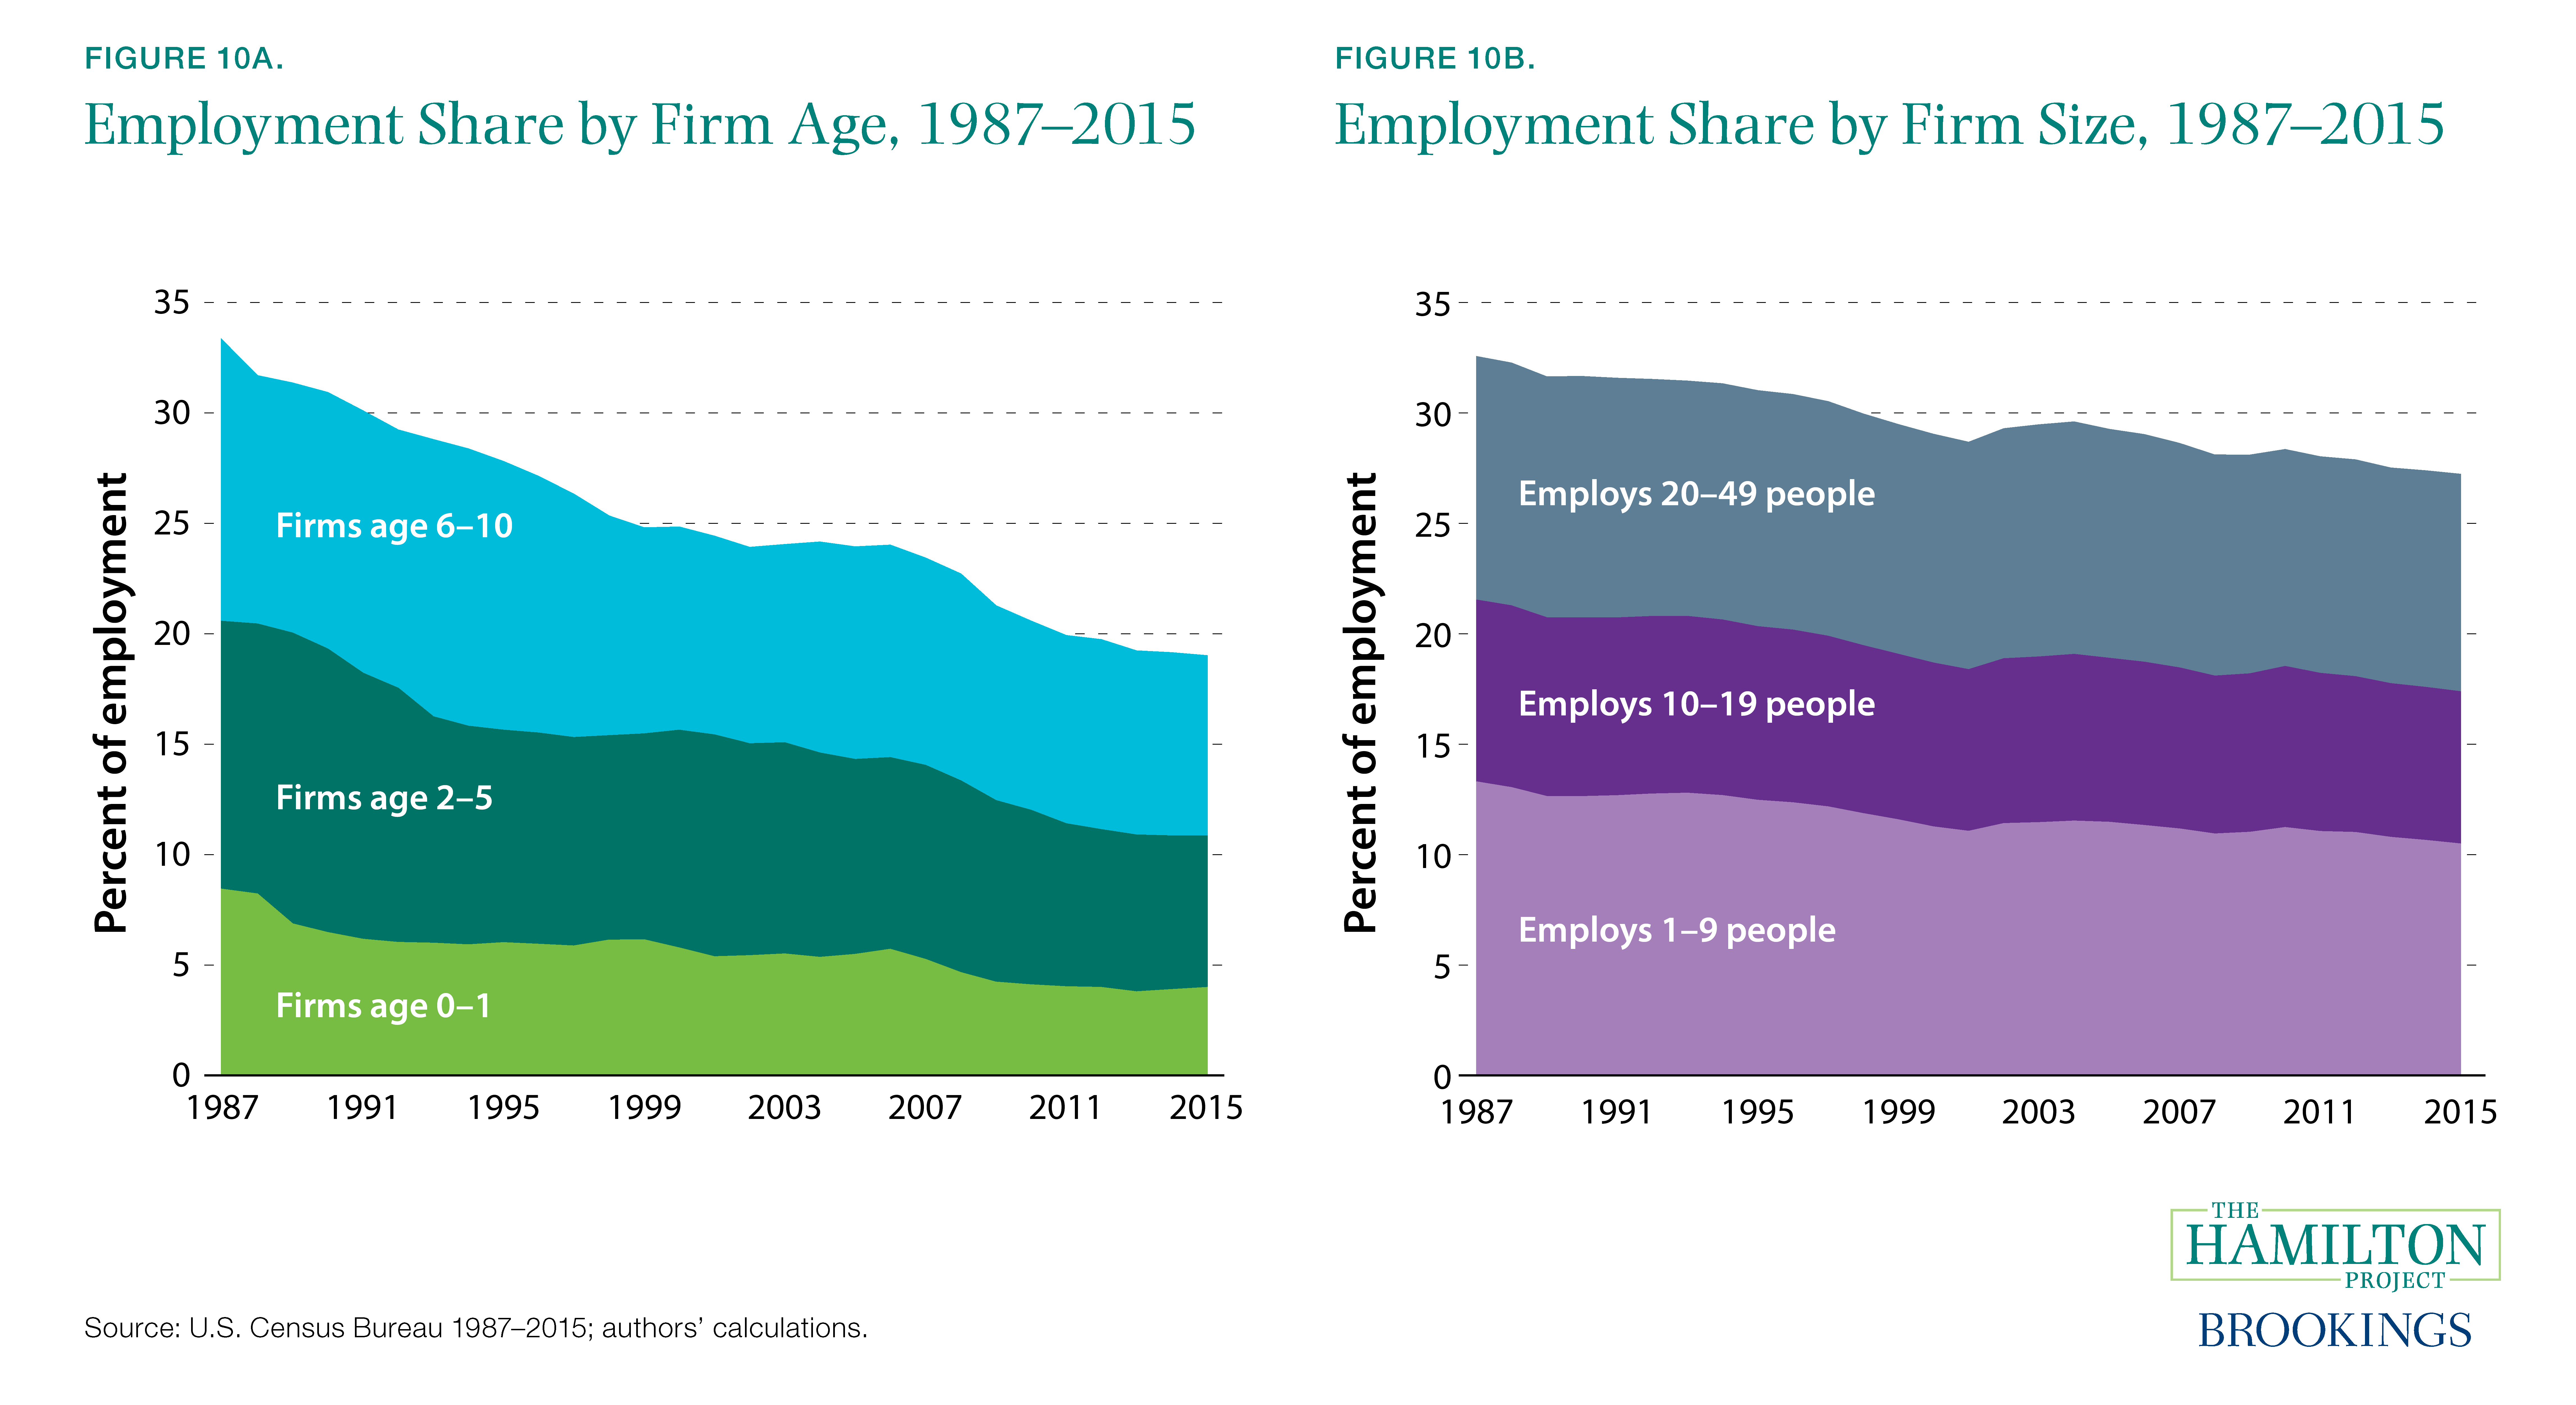
Figures 10a and 10b use Census Bureau Business Dynamics Statistics (1987–2015) to show how the employment shares of firms have changed over time, dividing firms by age and by size. In 1987 both relatively young firms (age 0 to 10) and small firms (with 49 or fewer employees) accounted for roughly a third of total employment, but by 2014 this share had dropped to 19.0 percent for relatively young firms and 27.2 percent for small firms. While young and small firms have both dwindled in labor market importance, the position of young firms has deteriorated more rapidly.
Given their significance for productivity and wage growth, it is particularly important to examine the changing employment shares of young firms. Within firms age 0 to 10, the decline was evenly distributed across all three age groups shown in figure 10a. Young firms employ a smaller share of the population both because there are fewer of them and because each employs fewer people on average than in the past. Decomposing the reduction in the employment share of firms age 0 to 5, we find that falling number of workers per firm accounted for about 40 percent of the decline, while the decreasing number of firms accounted for 60 percent. For firms age 6 to 10, 75 percent of the declining employment share was due to falling firm size over time (authors’ calculations).
Recent start-ups are producing strikingly fewer jobs than their predecessors, and this is particularly the case during their earliest years. Net job creation as a fraction of employment for one-year-old firms (not shown) hovered in the 1 to 2 percent range from the late 1980s through 2000—as the surviving start-ups added more employment than failing start-ups subtracted—but the rate fell gradually to less than –10 percent in 2009, has not fully recovered since then, and still remains negative. At the same time, the net job creation rate for two- to five-year-old firms was more consistently negative.9
Fact 11: Businesses are taking longer to form, while business applications have declined.
Understanding business formation and the policy factors that support or undermine it is crucial to maintaining a dynamic, competitive economy. Drawing links between the two is usually not straightforward, but data are increasingly becoming available that support this research.
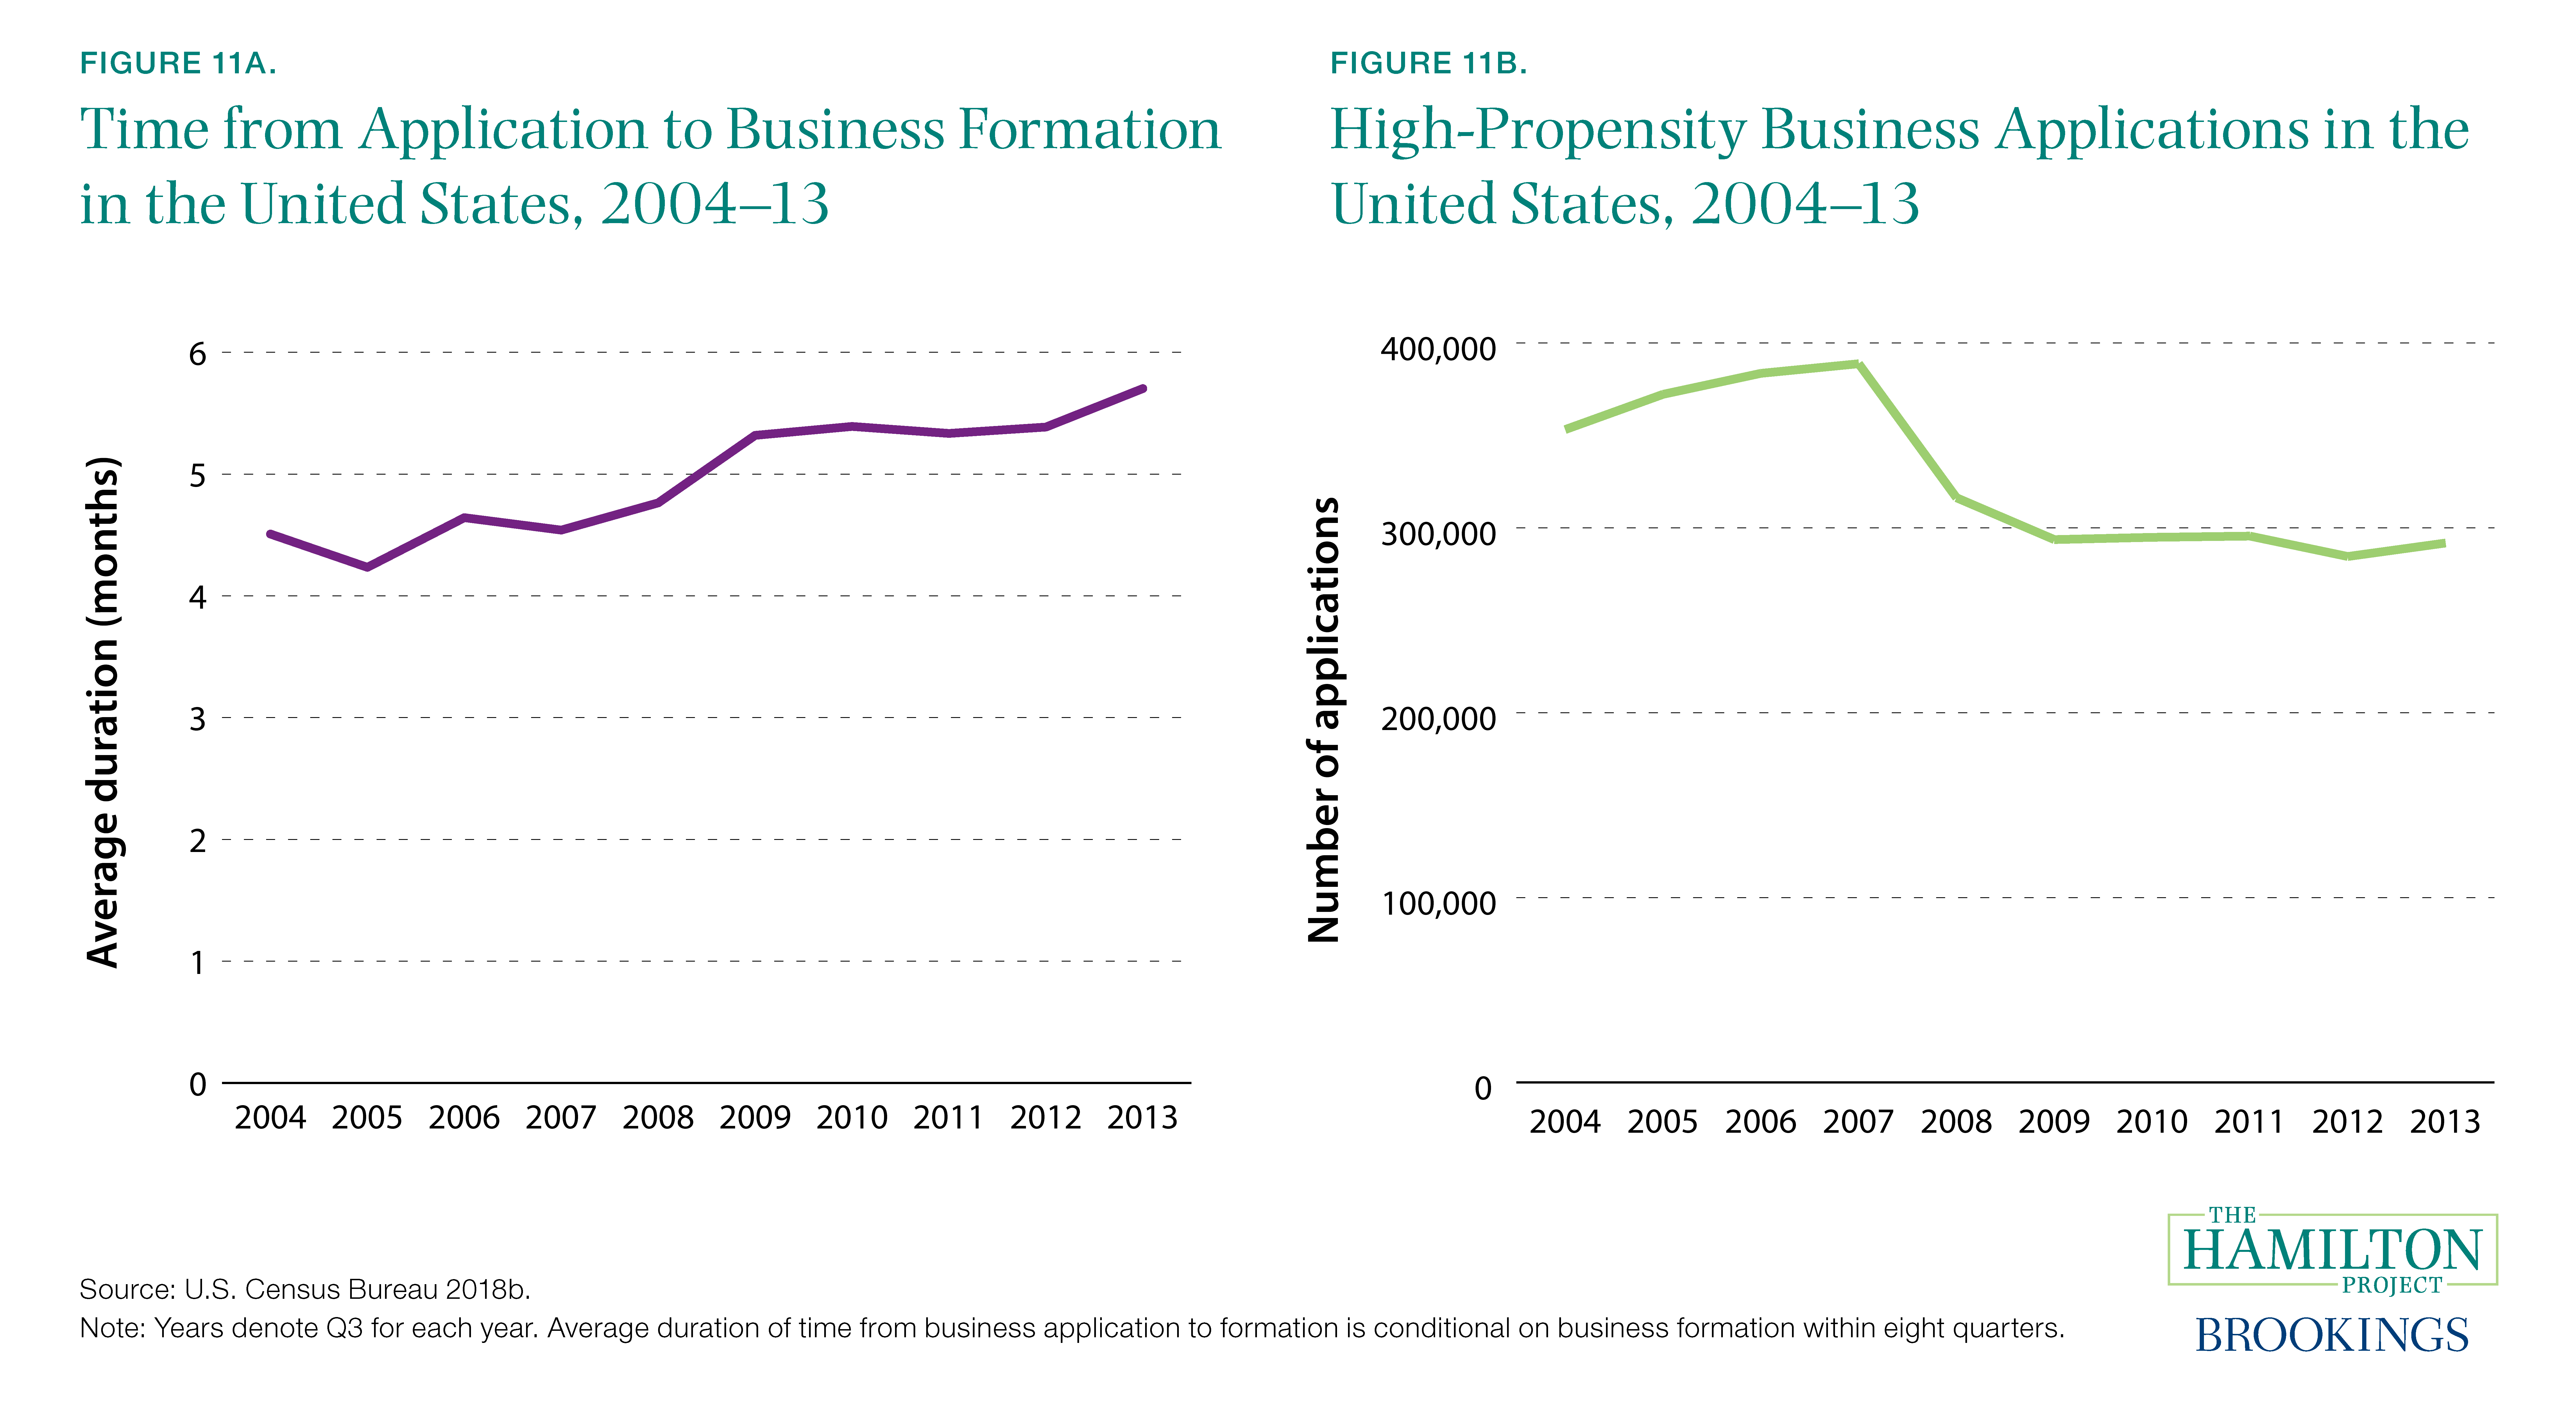
A new dataset from the Census Bureau—the Business Formation Statistics—reveals that the typical time between application and business formation has steadily increased in recent years. Figure 11a shows that the average number of months increased from 4.5 to 5.7 between 2004 and 2013.
This increasing duration could reflect increasing entry costs, including regulations related to business formation, as well as changing mix of business types or other changes in entrepreneurs’ behavior. Interestingly, federal regulation does not appear to be limiting business dynamism (Goldschlag and Tabarrok 2018), although available data with which to explore this question are very limited.
Figure 11b shows a related trend: the number of high-propensity business applications, defined as those applications that have characteristics associated with becoming an employing business, has declined from about 350,000 in 2004 to 290,000 in 2013. Though most of the decline occurred during the Great Recession, applications have not rebounded in subsequent years. Reflecting a different focus on start-ups likely to have superior growth outcomes, Guzman and Stern find that the rate of high-impact start-ups was very high in the late 1990s, followed by a lower but stable period in the 2000s (Guzman and Stern 2016).
One relevant type of entry cost is financing, the availability of which varies in response to both economic and policy developments. Interestingly, places with larger collapses in housing prices experienced larger reductions in high-propensity business applications, suggesting that home equity is an important source of capital that varies with the business cycle (Bayard et al. 2018). These regions also typically had worse outcomes during the Great Recession, which likely depressed entrepreneurship directly, and not only indirectly through the balance sheets of potential entrepreneurs.
Fact 12: The entrepreneurship rate has fallen by almost half for workers with a bachelor’s degree.
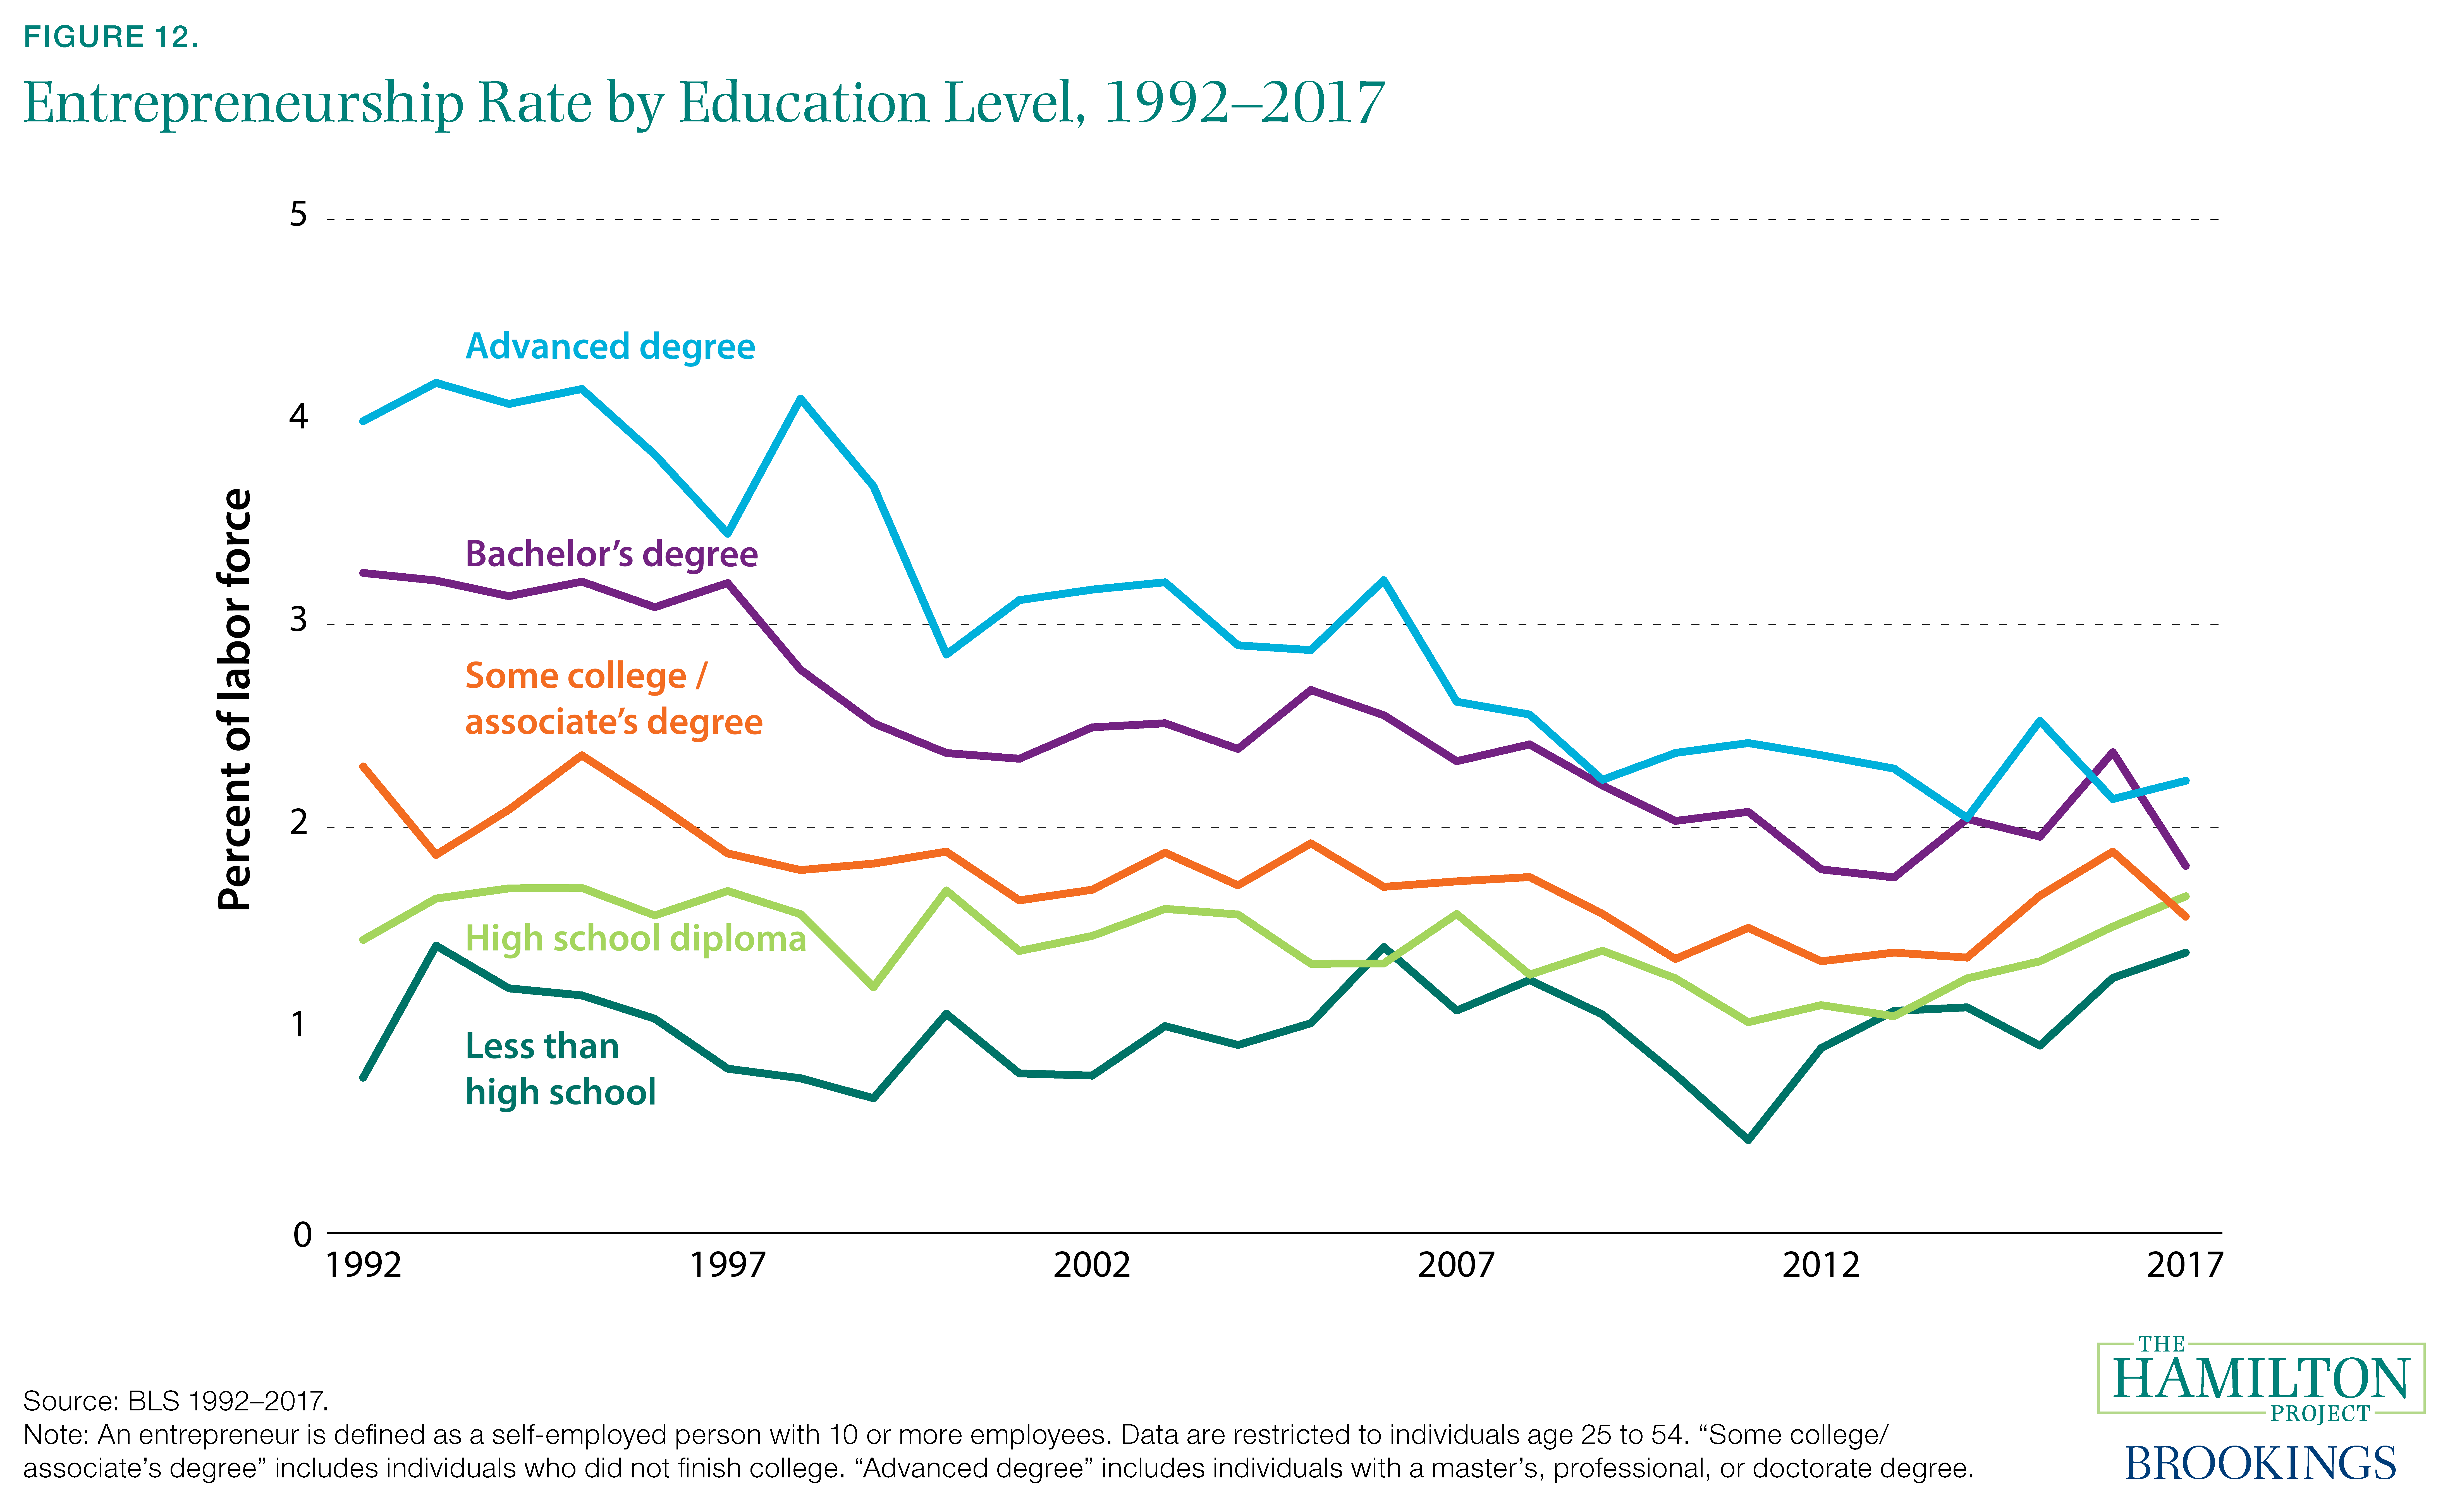
The factors that impede or promote business dynamism do not affect all businesses or entrepreneurs equally, and an exclusive focus on business-level data can obscure some of the ways that individual entrepreneurs are changing. Accordingly, figure 12 examines trends in entrepreneurship—defined here as self-employment with at least 10 employees—by the educational attainment of entrepreneurs.
For people with more than a high school diploma, entrepreneurship is a less common vocation than it was 25 years ago. The decline is especially pronounced among those with advanced degrees: in 1992 4.0 percent of 25- to 54-year-olds with an advanced degree (beyond a bachelor’s) were entrepreneurs. By 2017 this rate had fallen to 2.2 percent.
This falling rate of entrepreneurship is likely related to rising wages for highly educated workers, which make entrepreneurship a less attractive option than formal employment (Lucas 1978). Kozeniauskas (2018) argues that rising fixed costs for setting up a business (perhaps due to regulation, the presence of large competitors, or other factors) explain a large part of the decline in overall entrepreneurship, and that skill-biased technological change helps explain the steeper decline in entrepreneurship for those with college degrees. Wages for those with college degrees have risen relative to wages earned by less-educated workers, which might contribute to highly educated workers staying in the paid labor force rather than starting their own firms (Salgado 2018).
The decline in entrepreneurship of highly educated individuals may be of concern given that these individuals are far more likely to engage in patenting, and having some form of intellectual property makes it more likely that a firm will become a high-growth start-up (Guzman and Stern 2016).
Chapter 4: Policy Impediments to Competition
Introduction
Natural economic forces, as well as firms’ attempts to coordinate and acquire market power, often impede market competition. But government policy can act as an obstacle to competition as well. Too often, government actions benefit incumbents at the expense of market entrants, thereby weakening market competition.
Local, state, and federal policymakers intervene in markets for a variety of reasons related to public protection and the correction of market failures, the purchase of public goods, redistribution across individuals, and a desire to implement other policy objectives. In the course of such an intervention, it is common for consumers, workers, and businesses to incur costs. In some instances, these costs are intentional. For example, a factory that generates excessive pollution would face higher costs after a federal environmental regulation is put in place to account for negative externalities, which should help discourage pollution. In many other instances, costs incurred by private parties are an unanticipated or undesirable consequence: for example, compliance with the same pollution measure could make it harder for smaller businesses to compete due to the increase in fixed costs, and might make it harder for a new firm to enter the industry if it is unfamiliar with the pollution rules.
Moreover, governments sometimes take actions that benefit concentrated interests at the expense of the broader public, and regulatory policy is one instrument for doing so (Olson 1965). When local residents and businesses lobby for land-use restrictions that prevent new development, or when a hospital uses certificate-of-need regulation to prohibit a competitor from entering their market, market competition is weakened.
Finally, changing economic and technological conditions can gradually cause a body of regulation to become more burdensome and competition-limiting. For example, regulatory limits on housing density in a particular area might not represent an important burden until housing demand increases; similarly, licensing rules that specify how health-care practitioners interact with patients can become more costly once new technologies render telemedicine feasible.
It is challenging to determine whether and to what extent regulations impair market competition. Regulations at each level of government are typically implemented by many different agencies; it is difficult to assess the scope of regulatory activity, let alone its economic effects. In recent years, one notable effort to provide such an assessment has been the RegData Project (McLaughlin and Sherouse 2018). It collects industry-level information about the stringency of regulation, counting the uses of words in the Code of Federal Regulations such as “prohibited,” “may not,” and “required.”
Gutiérrez and Philippon find that federal regulations (as measured by RegData) are associated with increasing market concentration and, through this channel, declining business investment (2017a, 2017b). However, using the same measure of federal regulatory stringency and again examining within-industry changes over time, other research finds no impact on start-ups, job creation, or job destruction (Goldschlag and Tabarrok 2018). In all research of this type, it is difficult to establish causality: for example, increasing concentration in an industry could lead policymakers to increase rather than decrease regulatory stringency.
Looking beyond federal regulations, state and local policy may present important obstacles for market competition and dynamism. Some of these regulations may inhibit firm entry across state lines, simply because a firm might not want to face a different regulatory structure in a different state. In other cases, restrictions are more direct. For example, restrictive land-use rules at the municipal level limit inflows of new workers and entry of new firms, thereby reducing economic growth (Ganong and Shoag 2017; Herkenhoff, Ohanian, and Prescott 2018). Occupational licensing is defined at the state level, and tends to reduce interstate mobility of licensed workers, particularly when requirements vary across states (Johnson and Kleiner 2017).
Of particular economic interest is the structure of licensure in the health-care sector, given the size—17.9 percent of U.S. GDP in 2016—and importance of that sector to the overall economy (Office of the Actuary 2016). Restrictions on the tasks non-physician health-care providers can perform—scope of practice rules—have important implications for medical costs and patient access to care (Kleiner et al. 2016). By unnecessarily limiting the work that can be done by nurse practitioners, certified nurse midwives, physician assistants, and others, these restrictions inhibit competition in health-care markets.
What can be done to remove policy impediments to competition? The first step toward optimizing regulatory policy is to ensure that a comprehensive and accurate cost-benefit analysis is available to policymakers. Cost-benefit analysis should be a routine part of the regulatory approval and review processes at the state and local levels, just as it typically is at the federal level. This would help avoid unnecessary regulatory costs, particularly when they are unintended by-products of regulation made in the public interest, but perhaps also when concentrated interests have lobbied for special protections in a way that is not transparent to legislators and the public. Often, modified policies can achieve public objectives at a lower economic cost, as with fully authorized scope of practice for non-physician health-care providers. In a policy proposal written for The Hamilton Project, E. Kathleen Adams and Sara Markowitz (2018) discuss the economic research that has investigated health-care scope of practice and outline a path forward for policy. Another example of counterproductive policy is the wide range of business incentives that states provide to large, incumbent firms. Reducing these subsidies and replacing them with support for entrepreneurship would help increase economic dynamism, as is explained in a Hamilton Project proposal by Aaron Chatterji (2018).
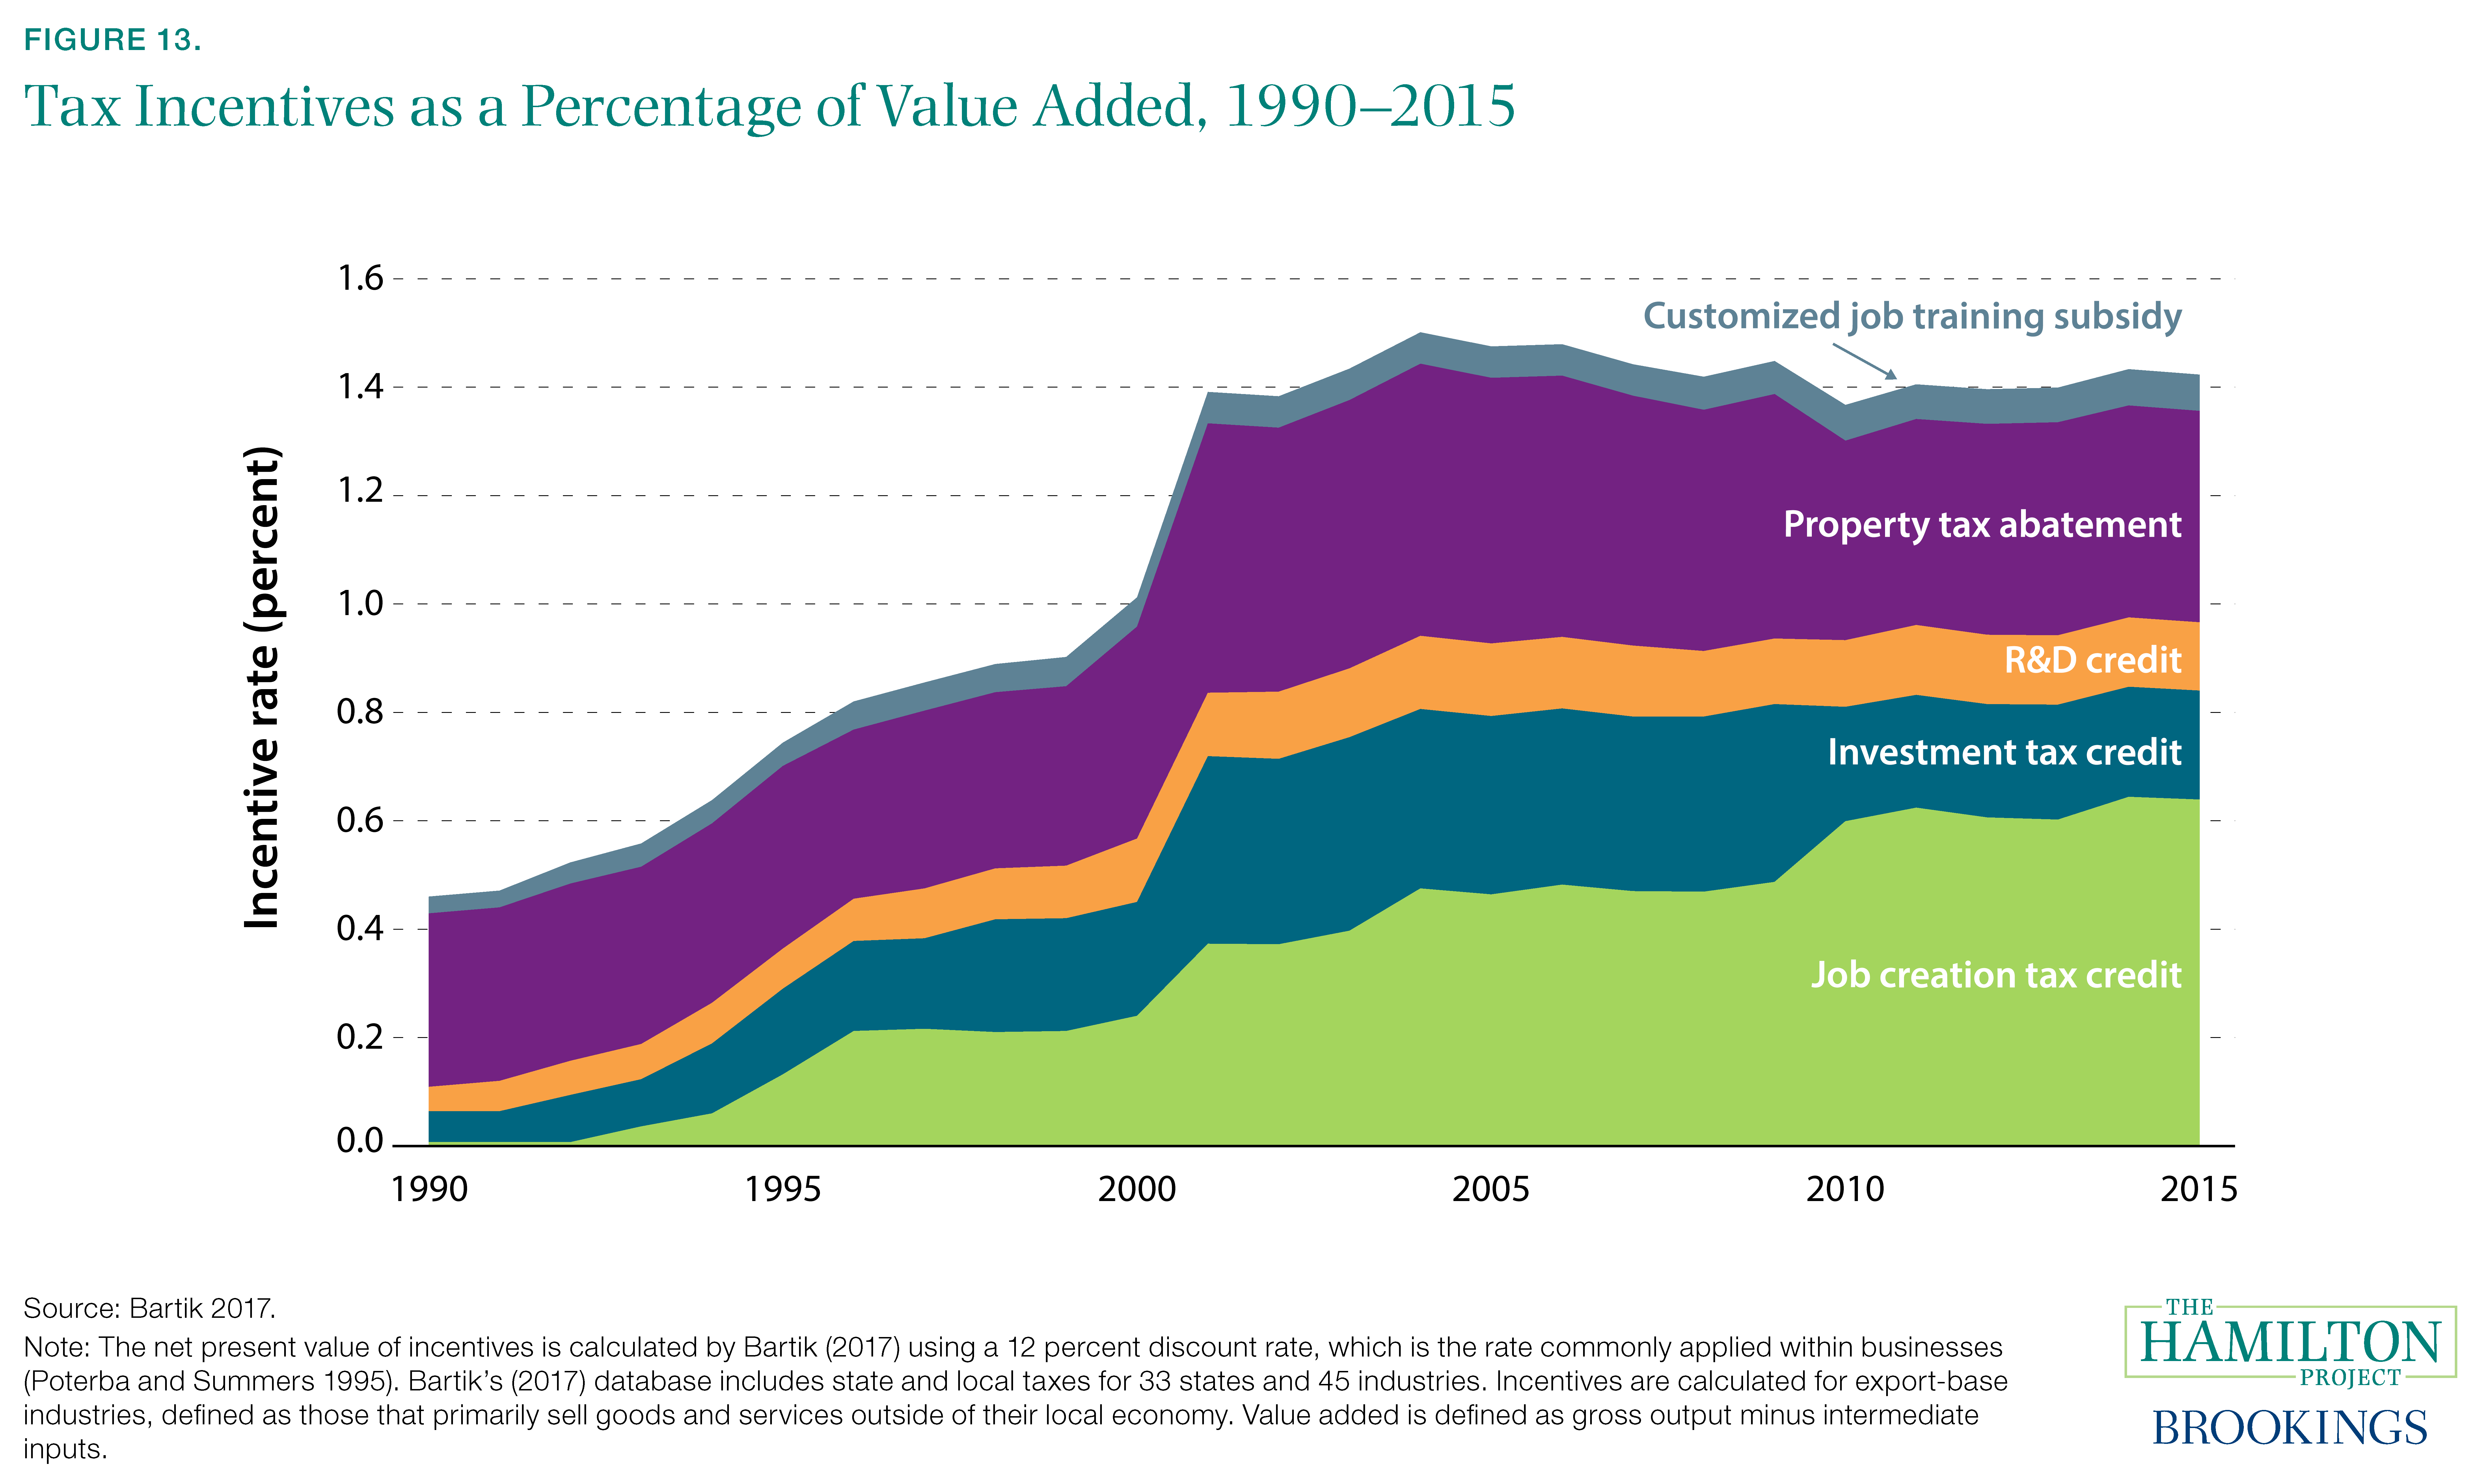
Fact 13: State subsidies to businesses have tripled since 1990.
When a major firm enters a new state or community it can have a substantial impact on the local economy (Greenstone, Hornbeck, and Moretti 2010). As large firms select new communities for additional or relocated facilities, state and local subsidies can be powerful inducements to select one location over another. State and local policymakers have a clear incentive to attract such businesses, and in fact try to do so using a variety of policy instruments, including various tax credits and other subsidies.
Unfortunately, such tailored subsidies place young and small firms at a disadvantage. Typically too small to merit the special attention of state policymakers, these businesses must face relatively high effective tax rates when they compete with larger, more-established businesses who have received incentives.
Figure 13 presents data from Bartik (2017) that document the sharp rise in state and local use of targeted business incentives for export-base industries (businesses that sell outside the local area or compete with goods and services from outside the local area). These incentives—job creation, investment, and R&D tax credits, as well as property tax abatements and job training subsidies—collectively rose from 0.5 percent of business value added in 1990 to 1.4 percent in 2015. Increased use of job creation tax credits alone accounted for 66 percent of the increase. At the same time, the gross tax rate facing businesses declined from 4.7 percent of value added to 3.3 percent, further reducing firms’ effective tax burden (Bartik 2017). Importantly, the data shown in figure 13 understate the extent of business incentives because they do not include the largest subsidies that are provided to firms making investments larger than $100 million.
State and local business incentives are generally considered to be part of a zero-sum contest between jurisdictions, most or all of which would be better off if the use of incentives were categorically eliminated (Chirinko and Wilson 2008). But it is not clear that all incentives even confer a sizable benefit on jurisdictions that use them; carefully evaluated incentives have generally not appeared to be cost-effective (Bartik and Erickcek 2014).
Fact 14: Occupational licensing is common and associated with diminished worker mobility.
State policies, from land-use rules to business permitting to licensing restrictions, are economically consequential. However, such regulations are often subjected to less scrutiny and less-rigorous cost-benefit analysis than are federal regulations (Glaeser and Sunstein 2014). Because they are defined at the state level, inconsistencies across states can also have economic impacts, including diminished geographic mobility.
Occupational licensing is a prominent example of such policies. Intended to protect public health and safety, licensing nonetheless imposes substantial costs on some consumers and workers. By definition, licensing is a restriction on entry into certain occupations, which reduces competition in those occupations. In addition, licensing often constrains the ways in which work is structured, limiting innovation and economic growth (White House 2015).
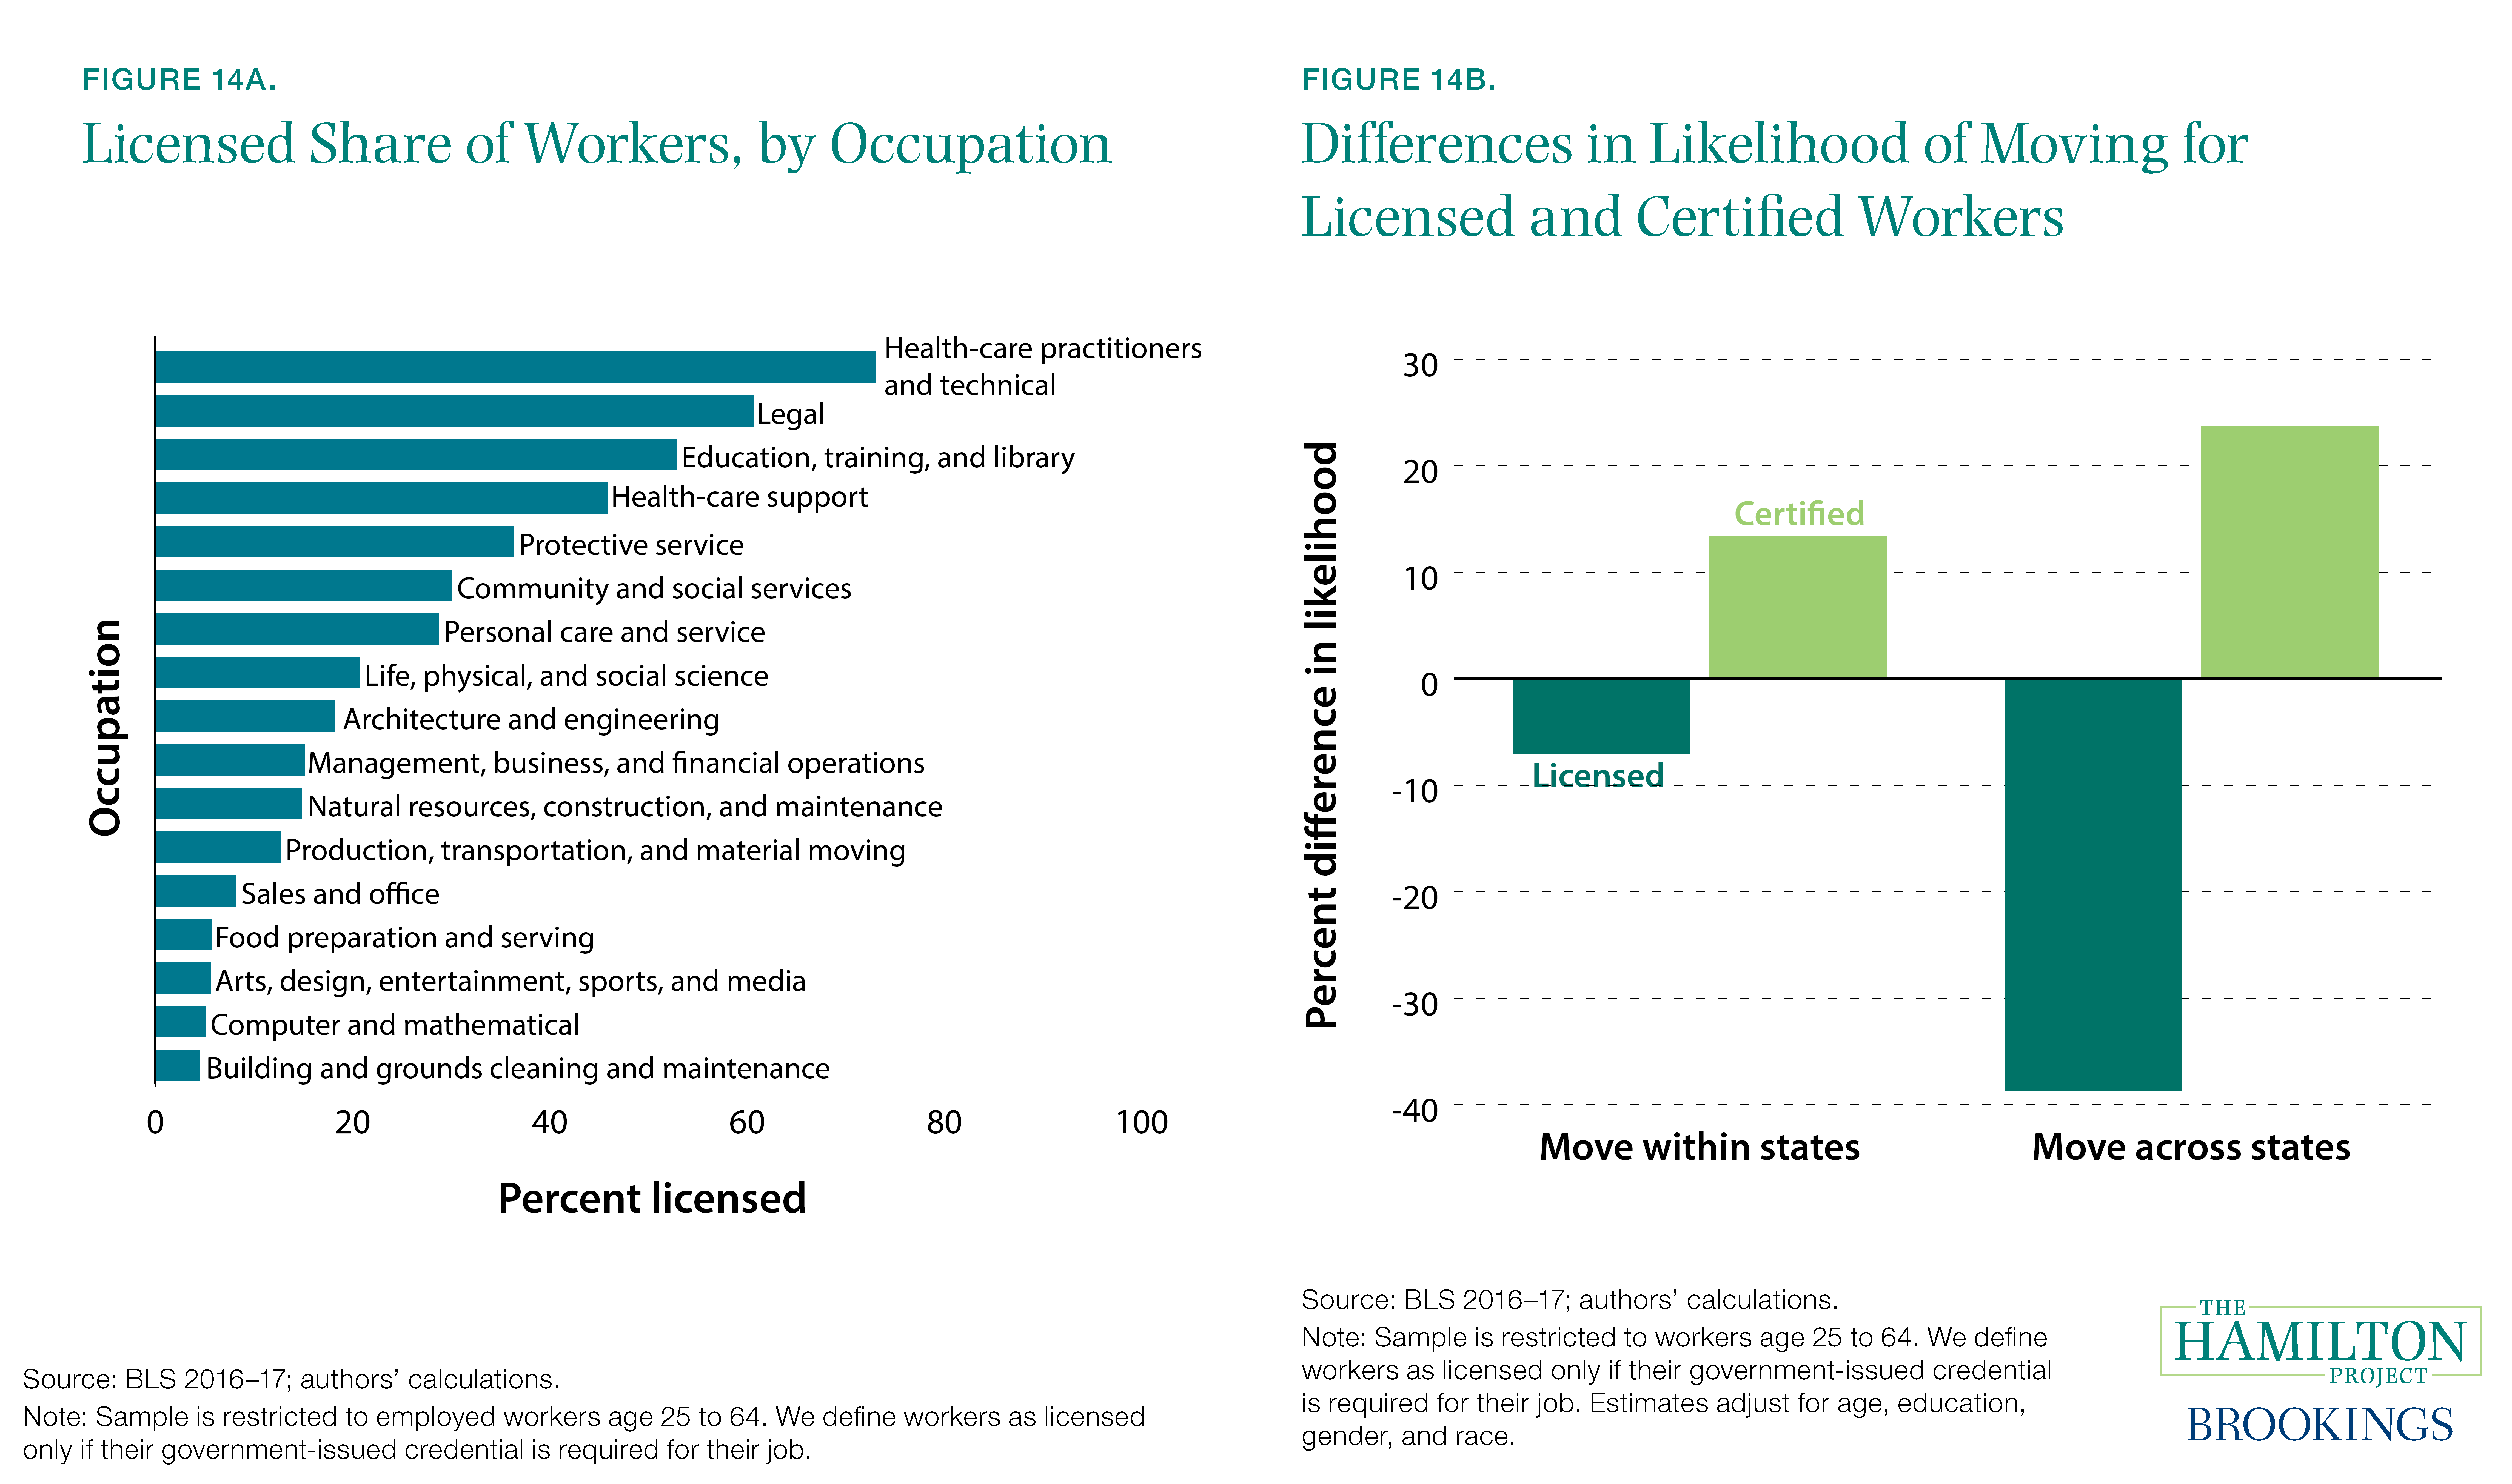
Figure 14a gives a sense of how widespread licensure is, displaying the fraction of working-age employees who are licensed in various large occupational groups. More than a fifth of all employees hold licenses, but the fraction varies considerably across professions. Health-care practitioners and legal workers are the most likely to be licensed, with 73 and 61 percent of workers licensed, respectively, while only about 5 percent of workers in computer and mathematical occupations are licensed.
Figure 14b focuses on just one economic impact of state licensure: lower geographic mobility. Licensed workers—who generally must pay to be relicensed after an interstate move—are much less likely to move across state lines than are comparable workers without licenses, but only slightly less likely to move within their state. The discrepancy in interstate mobility rates is particularly pronounced when relicensure is more onerous for workers (Johnson and Kleiner 2017). Voluntary certification, which is often suggested as an alternative to mandatory licensure, is associated with somewhat higher interstate mobility (see figure 14b).
Fact 15: Health-care licensure rules vary in ways that matter for competition and mobility.
The American economy rests crucially on the ideas and new businesses that form across the country, adding new products and innovations as well as competing with existing firms. A range of data show both increases in concentration in various industries and a decline in the number and activity of start-ups. These facts coincide with declining productivity, investment, and labor market dynamism.
The relationship among competition, dynamism, and broader economic outcomes is complicated. In some cases, growing concentration may be a natural consequence of the changing landscape of industries; moreover, it can be harmless if the threat of market entry causes incumbent businesses to act as if they face rigorous competition at all times. In other cases, though, it seems that growing concentration has come with declining investment, fewer new firms, and more market power for firms in labor markets.
Many of these new developments warrant policy action to ensure robust competition and economic prosperity. Other developments merit further study to better understand how the changing economic context affects living standards over time. Public policy can help, especially by ensuring robust competition, by avoiding regulations that either deliberately or accidentally stifle competition, and by supporting new firm growth rather than subsidizing incumbents.

Authors


-
Footnotes
- For example, see Gilbert and Newbery (1982) for a discussion of this dynamic as it pertains to patent activity.


