


The internet is now a fundamental component of the American economy, creating new ways to educate, employ, bring services to, and entertain every person.
Broadband, especially wireline broadband in American homes, is the essential infrastructure for unlocking the internet’s economic benefits. However, broadband infrastructure is far from ubiquitous, both in terms of where it operates and who subscribes to it, and those deficits are not shared evenly across the country. As such, policymakers must understand how the national digital divide varies depending on the place.
What we mean when we talk about Broadband
Broadband is an inherently flexible term. Intrinsically, it refers to a high-speed connection to the internet that is always available. Yet as digital telecommunications continue to evolve, so too do definitions of what qualifies as broadband-level speeds. The term also is not limited to just one transmission technology. Any of the multiple technologies that deliver digital telecommunications to end users—including digital subscriber lines (DSL), cable, fiber, or satellite—can qualify as broadband.
This analysis specifically focuses on wireline broadband.1 While wireless data plans have exploded in popularity since 2011, wireline broadband continues to offer multiple benefits to household users.2 Specifically, it delivers higher connection speeds, permits greater cross-platform security, typically includes unlimited data, and maximizes a mobile device’s utility via high-speed WiFi.3 As such, wireline broadband is a critical, in-home gateway to the content, applications, and services that enable households to participate in a digital economy.4 Additionally, there is a concern that individuals who rely exclusively on wireless plans—and who tend to be lower income, younger, and more racially diverse—are limited in their capacities to tap the internet’s potential.5
Even with the immense benefits in-home broadband brings to people and their neighborhoods, broadband access and adoption are not ubiquitous. Since at least the late 1990s, researchers have used the digital divide framework to study the dual challenges of availability and subscription.6
The following research assesses both components of the digital divide, and for the first time studies them in every American metropolitan area and neighborhood. Identifying local gaps—and not just in where telecommunications infrastructure goes, but also who subscribes to it—more comprehensively portrays the extent of digital disconnect.
Neighborhoods are a critical lens
While most broadband studies report numbers at the national level, studying broadband at a neighborhood level is vital for both policy design and advancing economic opportunity.
As federal, state, and local policymakers pursue universal access to in-home broadband, neighborhood-level indicators confer multiple advantages. First, broadband infrastructure is not deployed equally within regions, municipalities, and rural counties. Identifying these gaps can help target policies to boost availability. Second, understanding how neighborhood-level subscription varies will enable policymakers and practitioners to more effectively target their limited resources to boost adoption among populations and neighborhoods most in need. (In this analysis, neighborhoods are approximated by census tracts. For more information on this and other methodological details, please download the full report.)
Neighborhood-level broadband conditions can indicate which neighborhoods are most likely to be left behind in a digital era. Chicago’s multiyear Smart Communities program—which offered digital literacy and other training in targeted, low-income neighborhoods—proved that more residents will access job and health care services when they receive a neighborhood-wide intervention to promote broadband use.7 These promising results suggest that getting entire neighborhoods online can lead to greater economic outcomes, but they also confirm that neighborhoods struggling with broadband subscription are important focus areas for inclusive economic development planning.
Just as importantly, this research confirms the need to further study “neighborhood effects” related to broadband deployment and subscription. Much like groundbreaking work under concentrated poverty and general access to economic opportunity based on where people live, neighborhood broadband conditions may have significant spillovers that impact the entire population in those neighborhoods and even the broader region.
One side of the digital divide: Broadband availability
Market dynamics impact private-sector deployments.8 Since telecommunications firms need revenues to justify infrastructure construction and operation, population density and average income affect availability in critical ways.9 In particular, far-flung and sparsely populated rural areas are often underserved relative to their metropolitan peers.10 Even up against these equity hurdles, broadband deployment has seen a significant uptick, and the quality of service continually improves.11
We consider a census tract “covered” by broadband if at least half of its census block residents have the option to purchase fixed, wireline broadband-speed internet service from at least one provider. (The Federal Communications Commission provides this data biannually. For more details, please see the Methodology within the full report.)
We focus in particular on the 25 Mbps download speed threshold, as it is the current standard in the United States for determining what constitutes broadband.12 This is the advanced speed to consistently originate and receive high-quality voice, data, graphics, and video telecommunications, and in particular to host multiple streams within one household. However, because the definition of broadband has evolved and continues to do so, we also consider patterns of availability according to alternative speed thresholds (e.g., 10 Mbps download speed, which is one prevailing international standard).
Most Americans can access broadband within their home at 3 or 10 Mbps. Areas without availability start to show at 25 Mbps, with 22 million Americans (7 percent) lacking access to a broadband connection at this speed tier.
By far, the largest broadband deployment gap exists in rural communities, where more than one in four residents (12.7 million people) lacked 25 Mbps broadband service in 2015. While rural communities are home to just 15 percent of the nation’s total population, they accounted for 57 percent of the nation’s residents in neighborhoods where broadband has yet to be deployed—a ratio that remains roughly the same at lower speed thresholds.
Mapping metro area availability
Most major metro areas offer near complete broadband coverage to their residents, but lower-density, more agriculturally focused regions in the South and West lag behind. Among the 100 largest metro areas, five in Florida and five others—ranging from Akron, Ohio to Salt Lake City—have achieved 100 percent broadband coverage for their residents. Yet even among metro areas with near universal broadband availability, deployment gaps can leave tens of thousands of residents without the option of broadband.
The flipside of the digital divide: Broadband subscription
National statistics on the extent to which households are subscribing to broadband reveal a country undergoing an uneven transition to the digitally connected economy, and they illuminate a digital divide that splits along both geographic and economic lines. Due to the structure of FCC subscription data, broadband speeds within this section are defined as 10 Mbps download and 1 Mbps upload.
In 2015, almost one in four people (a total of 73.5 million) in the United States lived in low subscription neighborhoods, where fewer than 40 percent of households subscribed to broadband. Such neighborhoods concentrate the digitally disconnected portions of the American population, leaving their residents at risk of missing the economic benefits of a high-speed internet connection. Especially concerning are the 17.7 million children under the age of 18 dwelling in these neighborhoods. Living without an in-home broadband connection is a challenge for children, as they may not be able to benefit from digital curricula or develop digital skills for the future workplace. Similar challenges extend to schools and school districts that serve clusters of non-subscribing households.
Most Americans—185.7 million people or 59 percent of the nation—experienced somewhat better connectivity in moderate subscription neighborhoods, i.e., census tracts with subscription rates between 40 and 80 percent. However, these neighborhoods still fall short of a national goal of nearing 100 percent subscription. In practice, only a modest share of the population lives in neighborhoods that either come close to or have already achieved that goal. High subscription neighborhoods, where at least 80 percent of households subscribe to high-speed broadband, were home to just 18 percent of the nation—or 57.1 million people—in 2015.
Mapping metro area subscription rates
What affects broadband subscription rates?
Price is a major factor. The Pew Research Center’s long-running survey series regularly finds price is a major adoption barrier.13 Confirming this work, other research found that a 10 percent increase in subscribership could require a price reduction of as much as 15 percent.14 These findings are especially concerning for those living in poverty, who may need targeted subsidies to connect to the digital economy within their homes.15 One important consideration is the clear price gap between comparable broadband service in the United States and its developed peers.16 Though the figure presented here doesn’t take into account the fact that some domestic ISPs offer cheaper pricing plans at lower speeds, the general finding holds that U.S. broadband is relatively expensive. And while broadband pricing involves multiple, complex factors—including how firms must balance revenues and investment needs, and how countries approach regulation differently—boosting adoption will require balancing variable willingness and ability to pay among different populations.17
Digital readiness and access to equipment are other consistent adoption barriers. In this instance, digital readiness includes both digital skills—such as the ability to use digital hardware and software to manage information, communicate, navigate the internet, solve problems, and create content—and trust in digital platforms.18 A lack of digital readiness is especially prevalent among older, non-Asian minority, less-educated, and lower-income individuals.19 A lack of in-home computing equipment also functions as a major barrier, although community centers like libraries can function as substitutes.20 Indeed, 97 percent of public libraries now offer free Wi-Fi access.21 However, community internet access points may not lead to greater in-home adoption.22 More troubling, a lack of in-home equipment can have a negative impact on school enrollment for youth.23
Modeling neighborhood-level indicators serves as a powerful signal for policymakers aiming to understand local subscription gaps. Our analysis reveals income and education to be the factors most highly correlated with broadband subscription. In other words, high subscription neighborhoods also tended to be high income neighborhoods and have smaller shares of people with less than a high school diploma. Other factors like retiree-aged population, foreign-born, and population density are all significant factor, albeit less impactful. Continuing to study neighborhood demographic factors is critical to understand local digital divides. (For more details on this analysis, please read Appendix B within the full report.)
The federal role: Balancing availability and adoption goals to bridge the digital divide
Recognizing the fragmented landscape that governs broadband deployment, federal policy overwhelmingly focuses on solving the collective action challenges around availability. Yet federal policy continues to largely overlook adoption. How the FCC handles Section 706 of the 1996 Telecommunications Act is emblematic of this tension: the law mandates that the FCC review advanced telecommunications deployment based on population, but it is on a voluntary basis that the agency monitors adoption.24
To some extent this arms-length approach stems from the complex array of factors—from pricing and marketing down to consumer choice and digital literacy—that shapes subscription levels. At the same time, the sheer scale of non-subscribed broadband households is difficult to ignore, and the fact that every community is affected—from New York City to rural Wyoming—generates political resonance and suggests the need for more targeted federal policy attention. There are clear opportunities to move adoption issues to the forefront of national policy, but current and past efforts have been patchwork.25 Simply put, formal policy must move beyond volunteerism.
Moving forward, there are a number of ways—through funding, regulation, research, and technical assistance—that federal actors can continue to advance gains in availability while at the same time elevating their focus and commitment to reducing adoption barriers.
The role of local stakeholders: Align data and programs to reflect local needs
Neighborhood-level broadband indicators reveal clear performance differences within and between communities of all sizes. As such, no one community will require the same interventions to address its availability and adoption gaps. However, local stakeholders from the public, private, and civic sectors can use common approaches to geographically target and design interventions that leverage federal, state, and local resources and programs and reflect local conditions and needs. In particular, the neighborhood-level maps can point to areas most in need.
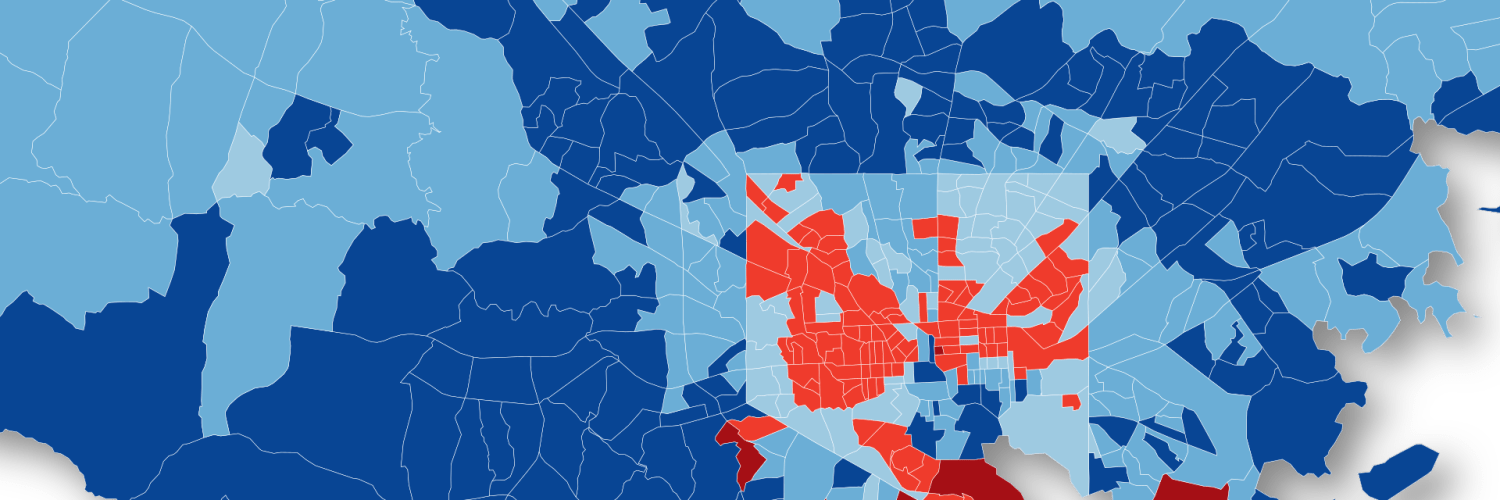
Mapping broadband subscription at the neighborhood scale
While a great amount of variation in subscription levels exists both within and across the 100 largest metro areas, the pattern uniting each metro area is the presence of digital disconnect. In fact, low subscription tracts exist in the surrounding suburbs of all 100 metro areas and in the cities of all but six metro areas: Allentown, Pa.; Deltona, North Port, and Palm Bay, Fla.; Providence, R.I.; and San Jose, Calif. In other words, the digital divide is pervasive. Use the interactive feature below to map neighborhood broadband subscription rates in each of the 100 largest metropolitan areas.
Data visualization produced by Alec Friedhoff.
Related Content


Authors
-
Footnotes
- Broadband literature, inside and outside government, often uses the word “fixed” interchangeably with “wireline.” In addition, the subscription rates include fixed wireless and satellite subscriptions meeting a certain speed threshold.
- According to the Pew Research Center, smartphone ownership rates jumped from 35 percent in 2011 to 77 percent in late 2016.
-
Paul N. Rappoport, Donald J. Kridel, and Lester D. Taylor, “The Demand for Broadband: Access, Content and the Value of Time,” 2003, https://www.researchgate.net/publication/251183337_The_Demand_for_Broadband_Access_Content_and_the_Value_of_Time. -
Christine Zhen-Wei Qiang, Carlo M. Rossotto, and Kaoru Kimura, “Economic Impacts of Broadband,” 2009, http://elibrary.worldbank.org/doi/pdf/10.1596/978-0-8213-7605-8#page=57. - Pew Research Center, “Mobile Fact Sheet,” 2017, http://www.pewinternet.org/fact-sheet/mobile/.
- Jan van Dijk and Kenneth Hacker, “The Digital Divide as a Complex and Dynamic Phenomenon,” The Information Society 19, no. 4 (2003): 315–26. doi:10.1080/01972240309487.
- Karen Mossberger, Caroline Tolbert, and Christopher Anderson, “Digital Literacy Is a Game Changer: A Neighborhood-Level Analysis of Chicago’s Smart Communities” (Washington: Brookings Institution, 2014).
- James E. Prieger, “The Supply Side of the Digital Divide: Is There Equal Availability in the Broadband Internet Access Market?” Economic Inquiry 41, no. 2 (2003): 346–63. doi: 10.1093/ei/cbg013.
- Jed Kolko, “A New Measure of US Residential Broadband Availability,” Telecommunications Policy 34, no. 3 (2010): 132–43. doi: 10.1016/j.telpol.2009.11.015.
- Tonny J. Oyana, “Exploring Geographic Disparities in Broadband Access and Use in Rural Southern Illinois: Who’s Being Left Behind?” Government Information Quarterly 28, no. 2 (2011): 252–61; Tony H. Grubesic and Mark W Horner, “Deconstructing the Divide: Extending Broadband xDSL Services to the Periphery,” Environment and Planning B: Planning and Design 33, no. 5 (2006): 685–704.
- FCC, “2016 Broadband Progress Report,” 2016.
- The FCC denoted this change regarding speeds qualifying as “advanced telecommunications capability” (ATC) in the 2015 Broadband Progress Report (FCC 15-10), https://apps.fcc.gov/edocs_public/attachmatch/FCC-15-10A1.pdf. The report uses the ATC definition of 25 Mbps for download and 3 Mbps for upload speeds in order to meet the requirements of section 706 (a.k.a. 1303) in determining whether ATC is being deployed to all Americans in a reasonable and timely fashion. The definition may change in future releases of the report.
- John Horrigan and Maeve Duggan, “Home Broadband 2015” (Washington: Pew Research Center, 2015).
- Octavian Carare, Chris McGovern, Raquel Noriega, and Jay Schwarz, “The Willingness to Pay for Broadband of Non-Adopters in the U.S.: Estimates From a Multi-State Survey,” Information Economics and Policy 30 (2015): 19–35.
- Marc D. Weiner and Orin T. Puniello, “The Effect of Poverty on the Propensity to Adopt Broadband: Household-Level Evidence From the Broadband Technology Opportunities Program,” Journal of Poverty 18, no. 4 (2014): 427–52, doi: 10.1080/10875549.2014.951983.
- In this context, developed country refers to countries with Human Development Indexes of at least 0.85, as published by the United Nations Development Program. In addition to the FCC data cited in Figure 1, the Organization for Economic Cooperation and Development also finds similar gaps in broadband pricing; see http://www.oecd.org/sti/broadband/oecdbroadbandportal.htm#PRICES.
- For additional cost-related considerations, see Nick Russo, Danielle Kehl, Robert Morgus, and Sarah Morris, “The Cost of Connectivity 2014” (Washington: New America, Open Technology Institute, 2014).
- For more information about digital readiness, see John Horrigan, “Digital Readiness Gaps” (Washington: Pew Research Center, 2016).
- Horrigan 2016.
- Dharma Dailey et al., “Broadband Adoption in Low-Income Communities,” Social Science Research Council, 2010, pp. 9 and 38-42.
- American Library Association.
- Brian Whitacre and Colin Rhinesmith, “Public Libraries and Residential Broadband Adoption: Do More Computers Lead to Higher Rates?” Government Information Quarterly 32, no. 2 ( 2015): 164-71.
- Robert Fairlie, “The Effects of Home Computers on School Enrollment,” Economics of Education Review 24, no. 5 (2005): 533-47.
- FCC, “2016 Broadband Progress Report,” GN Docket No. 15-191.
- At the time of publication, the Broadband Opportunity Council maintains the clearest collection of broadband-related federal programs. See United States Departments of Agriculture and Commerce, “Broadband Opportunity Council Agencies’ Progress Report,” January 2017.
Paul N. Rappoport, Donald J. Kridel, and Lester D. Taylor, “The Demand for Broadband: Access, Content and the Value of Time,” 2003, https://www.researchgate.net/publication/251183337_The_Demand_for_Broadband_Access_Content_and_the_Value_of_Time.
Christine Zhen-Wei Qiang, Carlo M. Rossotto, and Kaoru Kimura, “Economic Impacts of Broadband,” 2009, http://elibrary.worldbank.org/doi/pdf/10.1596/978-0-8213-7605-8#page=57.
The Brookings Institution is committed to quality, independence, and impact.
We are supported by a diverse array of funders. In line with our values and policies, each Brookings publication represents the sole views of its author(s).