This paper examines the tradeoffs among three competing goals that are inherent in a revenue-neutral income tax reform—maintaining tax revenues, ensuring a progressive tax system, and lowering marginal tax rates. As a motivating example, we estimate the degree to which individual income tax expenditures would have to be limited to achieve revenue neutrality under the individual income tax rates and other features advanced in presidential candidate Mitt Romney’s tax plan, and how the required reductions in tax breaks could change the distribution of the tax burden across households. (We do not score Governor Romney’s plan directly, as certain components of his plan are not specified in sufficient detail, nor do we make assumptions regarding what those components might be.)
Our major conclusion is that a revenue-neutral individual income tax change that incorporates the features Governor Romney has proposed – including reducing marginal tax rates substantially, eliminating the individual alternative minimum tax (AMT) and maintaining all tax breaks for saving and investment – would provide large tax cuts to high-income households, and increase the tax burdens on middle- and/or lower-income taxpayers. This is true even when we bias our assumptions about which and whose tax expenditures are reduced to make the resulting tax system as progressive as possible. For instance, even when we assume that tax breaks – like the charitable deduction, mortgage interest deduction, and the exclusion for health insurance – are completely eliminated for higher-income households first, and only then reduced as necessary for other households to achieve overall revenue-neutrality– the net effect of the plan would be a tax cut for high-income households coupled with a tax increase for middle-income households.
In addition, we also assess whether these results hold if we assume that revenue reductions are partially offset by higher economic growth. Although reasonable models would show that these tax changes would have little effect on growth, we show that even with implausibly large growth effects, revenue neutrality would still require large reductions in tax expenditures and would likely result in a net tax increase for lower- and middle-income households and tax cuts for high-income households.
It would be possible to reduce the regressivity of such plans or even to maintain progressivity in such plans with reductions in the tax rate cuts for high-income taxpayers and/or significant reductions in the tax preferences for saving and investment, including the preferential rates on capital gains and dividends.
Background
In this exercise, we estimate by how much tax expenditures would need to be reduced to maintain current revenues given the tax rates specified in presidential candidate Mitt Romney’s tax plan as described on his campaign website. This plan would extend the 2001-03 tax cuts, reduce individual income tax rates by 20 percent, eliminate taxation of investment income of most taxpayers (including individuals earning less than $100,000, and married couples earning less than $200,000), eliminate the estate tax, reduce the corporate income tax rate, and repeal the alternative minimum tax (AMT) and the high-income taxes enacted in 2010’s health-reform legislation.[1] We estimate that these components would reduce revenues by $456 billion in 2015 relative to a current policy baseline.[2] According to statements by Governor Romney and his advisors, the remainder of the plan will include policies to offset this revenue loss, although there are no details on how that would be achieved.
We select this plan because it is representative of a number of frequently discussed plans that propose reducing marginal tax rates while broadening the tax base—for example, Representative Paul Ryan’s plan calls for collapsing the income tax rates into two brackets, 10 percent and 25 percent (which is more than a 20 percent reduction in the top marginal rate), and proposes offsetting some or all of the revenue losses through broadening the tax base, also without specifying which tax expenditures would be cut.[3]
We examine 1) what it would take to offset the revenue losses arising from reducing individual tax rates and eliminating the AMT and estate tax in order to make the overall Romney plan revenue neutral, 2) by how much tax expenditures would need to be reduced, and 3) what the consequences would be for the distribution of the tax burden under traditional scoring conventions. In addition, we discuss how alternative assumptions about the macroeconomic growth the plan would create would affect the conclusions.
Modeling Assumptions
We make the following assumptions:
- Any reductions in revenue due to the lower corporate rate would be offset by reducing corporate tax preferences. As a result, we examine only changes to the individual income tax, alternative minimum tax, payroll tax, and estate tax. We ignore the effect of the proposal to reduce the corporate rate to 25 percent.
- The plan would not reduce tax expenditures that aim to promote saving and investment. That is consistent with Governor Romney’s plan (and statements made by proponents of similar plans).[4] These provisions include preferential rates on capital gains and dividends; exemption of income accrued in qualified retirement and other tax-favored accounts (e.g., traditional and Roth IRAs and 401(k)s and education and health saving accounts); exemption of interest on state and local bonds; the exclusion of capital gains on home sales; the step-up in basis of assets bequeathed to heirs; and the Saver’s Credit. We exclude these provisions because most plans that have proposed large reductions in individual rates have also proposed to retain or even expand tax incentives for saving and investment.
- The tax expenditure for imputed rent on owner-occupied homes and certain smaller hard-to-eliminate exclusions from income cannot or will not be eliminated. This group includes provisions that many would not identify as tax breaks, that have rarely or never been identified by policymakers as “on the table”, or that would be difficult to administer in practice.[5] The largest of these provisions are the tax exclusion for “imputed rent,” (the value of the housing services that homeowners obtain from living in their own homes) and the exemption from tax on the increase in the value of life insurance policies as people age. Smaller provisions include the exclusion from taxable income of combat pay, veterans’ benefits, and benefits for low-income families; previous reform proposals have excluded most of these smaller items. Moreover, because they are small, and because many primarily benefit lower- and middle-income households, including them would not meaningfully affect the results.
- Tax expenditures would be eliminated or reduced “starting at the top.” This assumption is perhaps most important for our distributional analysis. Specifically, we offset revenue losses from tax rate reductions by first eliminating tax expenditures for the highest-income groups. If–as it turns out–base-broadening at high-income levels does not recoup all lost revenue, we then limit tax expenditures for the next highest income group, and so on, until the overall plan is revenue neutral. This approach will likely (vastly) overstate the progressivity of any tax changes that could be pursued in practice, because it would be both administratively and politically impractical to completely eliminate all tax expenditures only above a given income threshold. (See further discussion on this point below.) Thus it serves as an upper bound on how progressive the reformed system could be relative to current policy.
- Revenue and distributional effects are measured against the current policy baseline constructed by the Tax Policy Center. This baseline assumes permanent extension of the 2001, 2003, and 2010 tax cuts and certain other provisions (except the temporary payroll tax cut and a few temporary investment incentives) and the scheduled implementation of the ACA provisions. [6] (Using the current-law baseline would make the proposed tax changes look even more regressive—and they would no longer be revenue-neutral.)
- Spending cuts are excluded from the analysis. As a result, tax rate reductions are wholly financed by the most progressive possible combination of cuts in available income tax expenditures. If spending cuts were used as a form of partial financing for the rate cuts listed above, the precise distributional effects would depend on the composition of the cuts and which programs and government functions were reduced. It is likely, however, that cutting spending would make the plan even more regressive because government spending tends to benefit low- and middle-income households more than tax preferences do.
Summary of Results:
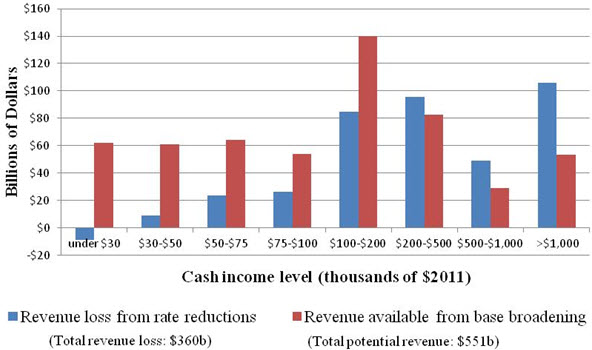
Absent any base broadening, the proposed reductions in individual and estate taxes specified in Governor Romney’s plan would decrease federal tax revenues by $360 billion in 2015.[7] These tax cuts predominantly favor upper-income taxpayers: Taxpayers with incomes over $1 million would see their after-tax income increased by 8.3 percent (an average tax cut of about $175,000), taxpayers with incomes between $75,000 and $100,000 would see somewhat smaller increases of about 2.4 percent (an average tax cut of $1,800), while the after-tax income of taxpayers earning less than $30,000 would actually decrease by about 0.9 percent (an average tax increase of about $130) due to the expiration of the temporary tax cuts enacted in 2009 and extended at the end of 2010.
In order to form a revenue neutral plan, the proposed revenue reductions from lower rates must be financed with an equal-value elimination or reduction in available tax preferences. (In our analysis, we assume that eliminating preferences that lower rates on savings and investment is off the table.) Offsetting the $360 billion in revenue losses necessitates a reduction of roughly 65 percent of available tax expenditures. Such a reduction by itself would be unprecedented, and would require deep reductions in many popular tax benefits ranging from the mortgage interest deduction, the exclusion for employer-provided health insurance, the deduction for charitable contributions, and benefits for low- and middle-income families and children like the EITC and child tax credit.
The key intuition behind our central result is that, because the total value of the available tax expenditures (once tax expenditures for capital income are excluded) going to high-income taxpayers is smaller than the tax cuts that would accrue to high-income taxpayers, high-income taxpayers must necessarily face a lower net tax burden. As a result, maintaining revenue neutrality mathematically necessitates a shift in the tax burden of at least $86 billion away from high-income taxpayers onto lower- and middle-income taxpayers. This is true even under the assumption that the maximum amount of revenue possible is obtained from cutting tax expenditures for high-income households.
Specifically, it is not possible to design a revenue-neutral plan that does not reduce average tax burdens and the share of taxes paid by high-income taxpayers under the conditions described above, even when we try to make the plan as progressive as possible. For instance, our calibration of the upper limit suggests that even by eliminating tax expenditures ‘starting at the top’—where we combine the proposed rate cuts with complete elimination of tax expenditures for taxpayers with income over $200,000—after-tax income would still increase by 4.1 percent among taxpayers with income over $1,000,000 and 0.8 percent for taxpayers earning between $200,000 to $500,000. (That translates to a tax decrease of $87,000 and $1,800 for those two groups.) However, on average, after-tax income for taxpayers earning less than $200,000 would need to decrease by 1.2 percent, an effective tax increase of $500 per household.[8] (Revenue neutrality would require eliminating 58 percent of total tax expenditures for these households.)
The above estimates assume that all available tax expenditures for higher-income households are completely eliminated—tax expenditures that include deductions for charitable contributions, mortgage interest, state and local taxes, and exclusions from income of health insurance and other fringe benefits. To the degree any of these were even partially retained for high-income households, the net tax cuts for high-income households and tax increases for low- and middle-income households would be even larger.
Discussion, Qualifications, and Caveats
First, the results above largely examine the changes in tax burdens across income groups, but the shifts in tax burdens between taxpayers with similar incomes is also of interest. For example, families with children currently receive 57 percent of the available tax expenditures examined in this exercise but 23 percent of the revenue reductions. Thus a reform that imposed an across-the-board reduction in tax expenditures would increase taxes much more on families with children than on childless adults. In the example above, if tax expenditures were completely eliminated for households above $200,000 and reduced across-the-board by 58 percent for taxpayers below $200,000 then taxpayers with children who make less than $200,000 would pay, on average, $2,000 more in taxes, whereas taxpayers without children who make less than $200,000 would receive a small tax cut of, on average, $75.
Second, we provide a discussion of how these results might be affected if we depart from conventional scoring assumptions and assume that the cost of the tax cuts could be partially offset by increased economic growth.
In the context of revenue-neutral tax reform, any positive growth effects are likely to be small. While the lower tax rates under the reform would strengthen incentives for employment and savings, the base broadeners would increase the portion of income that is subject to tax and have incentive effects in the opposite direction. As Brill and Viard note “lowering statutory tax rates while broadening the income tax base generally does not reduce work disincentives because it leaves the relevant effective tax rates unchanged” (Brill and Viard 2011).[9] Moreover, analysis by the CBO and JCT suggest that the revenue effects arising even from rate cuts that were not accompanied by base broadening would be small (CBO 2003, 2005; JCT 2005).[10]
Nevertheless, even if one were to use the model from Mankiw and Weinzierl (2006) and assume that after five years 15 percent of the $360 billion tax cut is paid for through higher economic growth, the available tax expenditures would still need to be cut by 56 percent; on net lower- and middle-income taxpayers would still need to pay higher taxes.[11]
Third, we have not examined whether it would be politically realistic to reduce tax expenditures—provisions like the mortgage interest deduction, charitable giving, the tax benefit for health insurance, the EITC, and the child tax credit, etc,—by 58 percent for those earning less than $200,000, and to eliminate such features entirely for all households earning more than $200,000. These are extremely popular tax breaks, not just for the taxpayers who benefit directly from lower tax bills, but also from other parties who benefit indirectly such as charities and their constituents, or the home building industry. For instance, no recent major reform plan has proposed entirely eliminating the deduction for charitable contributions for higher-income individuals. If certain tax expenditures, say for charitable giving, mortgage interest, or health insurance were scaled back by the same percentage for everyone instead of eliminated, then the requirement of revenue neutrality would require even larger tax increases on middle- and lower-income households.
Fourth, it is unlikely to be technically and practically feasible to design the tax expenditure cuts to occur “starting at the top” as we have assumed. If it is not, then any revenue-neutral plan will be even less progressive than we have estimated and will generate larger tax cuts for high-income households and larger net tax increases for low- and middle-income households. In our analysis we have assumed that tax expenditures could be eliminated exclusively for high-income groups (but not for lower-income groups) to illustrate the most progressive possible distribution of tax burdens possible given the specified tax rates. In practice, such a policy would require that these benefits be phased out over some income range, increasing marginal tax rates in that range. Our analysis implicitly assumes that these benefits would be phased out immediately and in full as a household’s income rises from $200,000 to $200,001—this would create an enormous tax on that particular dollar of income, which is one reason why such a plan is not likely to implemented. More realistically, benefits would probably be phased-out more gradually, which would mean raising less revenue from high-income households and an even larger tax shift to lower- and middle-income households.
Taken together, these qualifications suggest that a reform that cuts income tax rates uniformly, preserves individual income tax expenditures aimed at saving and investment, and makes up the revenue by cutting individual income tax expenditures will wind up shifting the tax burden to middle- and lower-income households and away from high-income households.
Illustrating the Tradeoffs in a Revenue Neutral Tax Reform
In our example, we assume that the 2001 and 2003 tax cuts, currently scheduled to expire in 2013 are extended and that marginal tax bracket rates are then cut by an additional 20 percent. As a result, the top bracket would fall from 35 percent to 28 percent, while the bottom bracket would fall from 10 percent to 8 percent in our example. We also assume that the AMT, the federal estate tax, and the tax provisions contained in the Affordable Care Act are repealed. Finally, we assume that taxes on long term capital gains, dividends, and interest income would be eliminated for married couples filing jointly with income under $200,000 ($100,000 for single filers and $150,000 for heads of household). Rates for taxpayers above the threshold would remain at current statutory rates—15 percent for long-term gains and qualified dividends and up to 35 percent on interest income.
These provisions would reduce tax revenues by an estimated $360 billion in 2015 relative to our modified current policy baseline, not including any base broadening or macroeconomic effects (or reductions in corporate tax rates). (Extension of the 2001 and 2003 tax cuts is assumed in the baseline, and so this estimate includes only the cost of the additional tax cuts.) According to these estimates, taxpayers earning more than $1 million would see their after-tax income increased by 8.3 percent (an average reduction in their tax burden of about $175,000). The after-tax income of Americans earning between $500,000 and $1 million would increase by 7.8 percent (an average tax cut of $42,000), and those earning between $200,000 and $500,000 would see a 5.9 percent increase in after-tax income (an average $14,000 tax cut). Americans making under $200,000—about 95 percent of the population—would also, on average, pay less in taxes when we do not take into account any base-broadening measures. Those making between $100,000 and $200,000 would see an average increase in after-tax income of 3.1 percent (an average tax cut of $3,500), and those making between $75,000 and $100,000 would see an increase of 2.4 percent (on average, a $1,800 tax cut). Finally, although individuals making less than $75,000 would see an increase in after-tax income of 0.1 percent (about a $200 tax cut per person), those at the very bottom of the income distribution—Americans who make less than $30,000 per year—would actually see a small tax increase because tax provisions in the 2009 stimulus bill and subsequently extended through 2012 expire.[12]
Figure 1: Distributional Effects of Tax Cuts with No Base Broadening
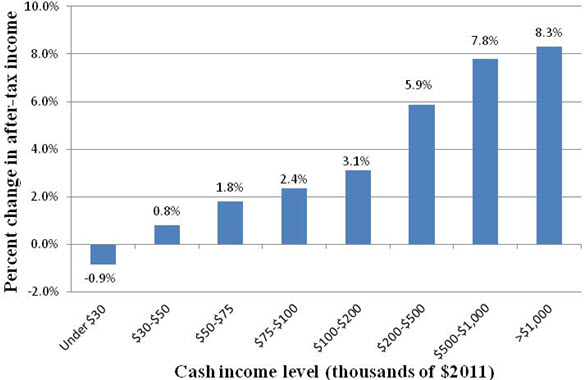 Note: Baseline is current policy, which assumes that 2011 law is permanent (except for the one-year payroll tax cut and temporary investment incentives). The specified tax changes include extension of the 2001 and 2003 tax cuts and a 20 percent reduction in all individual income tax rates; the repeal of the Alternative Minimum Tax, the federal estate tax, and some of the tax provisions contained in the Affordable Care Act; and the elimination of taxes on long-term capital gains, dividends and interest income for married couples filing jointing with income under $200,000 ($200,000 for single filers and $150,000 for heads of household).
The basic arithmetic of revenue neutrality requires eliminating $360 billion worth of tax expenditures to offset $360 billion of tax cuts. We make the following assumptions about which tax breaks are available for elimination with the goal of being as expansive as possible, given the constraints of preserving current treatment of savings and investment and the practical difficulties of eliminating certain provisions.
First, we assume that tax increases on savings and investment are off the table, and therefore allow for no reductions in tax expenditures intended to promote savings and investment. Specifically, we assume the following savings- and investment-related tax breaks are not reduced: preferential rates on capital gains and dividends; exclusion of income accrued in qualified retirement savings accounts and pensions (e.g., Traditional and Roth IRAs, 401k plans, defined benefit pensions); the step-up basis at death; the exclusion of capital gains on home sales, exemption of interest on state and local securities and certain other small provisions.[13] In total, these tax breaks make up about one third of the value of all tax expenditures, according to Nguyen, Nunns, Toder, and Williams (2012).[14]
In addition, certain other tax expenditures are difficult to eliminate for technical or practical reasons. The most significant example is “imputed rent on owner occupied housing,” the measure of the flow of value that a homeowner receives from living in his or her own home. Similarly, the increase in the value of life insurance policies as people age is technically income but is not subject to tax in the current system. In addition, a number of smaller items, like the value of veteran’s benefits, Medicare benefits, and transfer benefits to low-income households, are excluded from taxable income, but in principle could be subject to tax. Rarely have policymakers expressed a desire to target these expenditures. We assume that such expenditures are effectively off the table.[15]
Finally, just as we ignore the corporate and business tax rate reductions, we also assume that corporate and business tax expenditures are not available to offset the individual and estate tax cuts.[16]
Given these assumptions, it may be useful to point out which tax expenditures we are assuming are “on the table”: employer provided health insurance and fringe benefits; the partial exclusion of social security benefits; above-the-line deductions like moving expenses; education-related benefits and tax credits; the deductions for medical expenses, state and local taxes, mortgage interest, and charitable contributions; child- and dependent-related tax credits like the child care credit, earned income tax credit, and child tax credit; and other items listed in the appendix.
Under the assumptions and rate schedules specified above, eliminating all of these available tax expenditures would raise about $551 billion. The magnitude of this figure contrasts conspicuously with headline estimates that tax expenditures reduce revenues by about $1.3 trillion in 2015. According to Nguyen, Nunns, Toder, and Williams (2012), about one-third of these tax expenditures promote savings and investment and an additional 10 percent fall into the hard-to-eliminate category, and are excluded as described above. In addition, the fact that marginal tax rates are 20 percent lower reduces the revenues available from eliminating tax breaks. For example, eliminating $1 of deductible mortgage interest raises $0.35 when the top rate is 35 percent, but only $0.28 when the rate is 28 percent.[17] These factors reduce the available revenues from the $1.3 trillion headline number to the $551 billion we estimate.
Thus, in order to offset $360 billion in cuts, one must eliminate 65 percent of all of the available $551 billion in tax expenditures.
In addition, this poses a direct challenge to preserving the same distribution of tax burdens as under the existing tax schedule because many of these available tax expenditures were designed to benefit lower- and middle-income households. For instance, Figure 2 compare the revenue arising from tax rate cuts and AMT and estate tax relief to the potential revenue that could be raised by eliminating the non-protected tax expenditures, by income group. The revenue reductions are concentrated in the middle- and higher-income levels, but the potential revenue raisers are even more concentrated among lower- and middle-income taxpayers. For the top income groups, revenue losses greatly outweigh the potential revenue available from base broadening.
As a result, it is not mathematically possible to design a revenue-neutral plan that preserves current incentives for savings and investment and that does not result in a net tax cut for high-income taxpayers and a net tax increase for lower- and/or middle-income taxpayers under the assumptions we have described above. This means that even if tax expenditures are eliminated in a way designed to make the resulting tax system as progressive as possible, there would still be a shift in the tax burden of roughly $86 billion from those making over $200,000 to those making less than that amount.[18]
Figure 2. Revenue Reductions from Lower Rates and Revenues Available from Base Broadening
 Note: The blue bars correspond to the revenue reductions arising from specified tax cuts by income group. The red bars correspond to the revenue available from eliminating available non-savings-related tax preferences by income group.
To estimate how average household tax burdens among different income groups would change as a result of this shift, we assume that the available tax expenditures are curtailed “from the top down” in order to make the tax plan as progressive as possible. For instance, Table 3 Column 2 shows that the rate reductions would reduce average tax payments by $175,961 among households earning more than $1,000,000. Column 4 shows that the complete elimination of tax expenditures for this group would increase taxes in this group by an average of $83,594. This means it is impossible offset the tax cuts with revenue raisers within this income group. The same is true for all income groups earning more than $200,000. Even after eliminating all available tax expenditures for households earning more than $200,000, this group still faces a net tax break. Americans making over $1 million would see an increase in after-tax income of 4.1 percent (an $87,000 tax cut), those making between $500,000 and $1 million would see an increase of 3.2 percent (a $17,000 tax cut), and those making between $200,000 and $500,000 would see an increase of 0.8 percent (a $1,800 tax cut).
Because taxpayers above $200,000 as a group have received a net tax cut, revenue neutrality requires that taxpayers below $200,000—about 95 percent of the population—experience a tax increase. If this increased burden is shared equally among all households earning less than $200,000, after-tax income among individuals in this group would decrease by (on average) 1.2 percent (an average tax increase of $500 per household). Without additional details about how specific tax expenditures below this threshold would be curtailed, it is impossible to say which households and which income groups would experience the tax increase. The results shown in Figure 3 are illustrative based on the assumptions that the tax increase would be distributed in proportion to different income groups’ shares of after-tax income.
Finally, as discussed above, implementing this exercise of eliminating tax expenditures starting “at the top” and going down is easier said than practically achieved. In practice, tax expenditures would probably have to be income-limited using more gradual phase-outs that reduce the benefit of the expenditure gradually as income rises. This would raise marginal tax rates, add complexity to the tax system, and further affect the progressivity of the tax schedule.
Figure 3. Tax Plan Assuming Revenue Neutrality through Base Broadening
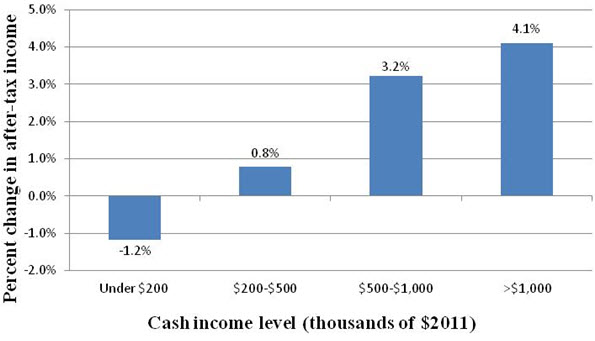 Note: This analysis assumes that base broadening occurs “starting at the top” so that tax preferences are reduced or eliminated first for high-income taxpayers in order to make the resulting plan as progressive as possible.
Discussion: Achieving Revenue Neutrality Using Optimistic Assumptions about Economic Growth
Finally, we provide a discussion of whether it is reasonable to expect any additional economic growth from a reform plan that was revenue neutral or nearly revenue neutral, and what the potential consequences for the above results would be if revenue reductions were offset partially by increased economic growth.
Traditional tax scoring— including the revenue estimates done by the TPC, the Treasury, Congressional Budget Office and the Joint Committee on Taxation—accounts for many of the behavioral responses to lower tax rates that could result in higher tax revenues. For example, traditional “micro-dynamic” scoring takes into account that that lower tax rates may lead taxpayers to engage in less tax avoidance, or that eliminating the home mortgage interest deduction might lead taxpayers to hold less housing-related debt.
Traditional scoring does not account for potential additional revenues arising from higher macroeconomic growth due to higher labor supply or capital investment. Traditional scoring has generally ignored these effects both for technical reasons—there is little agreement about how to effectively model the macroeconomy—and practical reasons—any model of the macroeconomy would require a full analysis of the entire federal budget, the budget deficit, and the anticipated response of monetary policy to changes in the budget. Furthermore, estimates indicate that the effects of tax rate reductions on the macroeconomy are likely to be small or even negative, at least, over the typical 10-year budget window.[19]
What’s more, as discussed above, there are particular reasons to be skeptical that revenue-neutral tax cuts will have much effect on growth. While lower tax rates provide a stronger incentive for employment and saving, base-broadening measures would increase the portion of Americans’ income that is subject to tax, and this would create incentives that would work in the other direction. At the end of the day, the net effects on labor supply and saving behavior would likely be small. As Brill and Viard summarize, “lowering statutory tax rates while broadening the income tax base generally does not reduce work disincentives because it leaves the relevant effective tax rates unchanged” (Brill and Viard 2011).[20] To the degree that tax expenditures were reduced by proportionately larger amounts for high-income groups, as assumed in this exercise, the Brill-Viard observation would be even stronger.
Nevertheless, the above results are not qualitatively different even if one were to assume that tax cuts pay for themselves according to the rule of thumb estimates from Mankiw and Weinzerl (2006). This model, which is based on an assumption that saving is infinitely elastic, may well overstate the capital income response, in addition to the other concerns raised above. Moreover, this model that assumes that rate reductions are paid for with lump sum tax increases, which means their model would overstate the growth effects in the context of a tax plan that included progressive reductions in tax expenditures.
If we assume, as in their model, that 21.3 percent of capital income taxes and 13.5 percent of labor income taxes are offset by higher growth after five years this would imply a revenue offset of 14.7 percent. (Assuming the tax cuts are 85 percent labor and 15 percent capital, which is roughly the share of labor and capital income reported on individual tax returns).[21]
According to this assumption, the tax cuts would result in revenue reductions of $307 billion (instead of $360 billion). If we assume that base broadening therefore only needs to pay for $307 billion in revenues (after five years), even in this scenario, more than 56 percent of all available tax expenditures would need to be eliminated (versus 65 percent without this assumption). Although a tax reform would need to raise $53 billion less through base-broadening, this is not be enough to offset the $86 billion net tax increase faced by lower- and middle-income households in the analysis above. Indeed, in this example, even if all of the additional economic growth accrued to high-income taxpayers, and all of the additional revenue were paid by high-income taxpayers, high-income taxpayers would still experience a net reduction in their tax payments. Thus, even in this case, the required base broadening still results in a net tax reduction for the top 1 percent and for taxpayers making more than $200,000, and a net tax increase on taxpayers earning less than $200,000.
Thus even generous assumptions regarding the ability of tax cuts to partially pay for themselves does not change the basic qualitative results.
Conclusion
In this paper we examine the tradeoffs between rates, tax expenditures, and the progressivity of the tax schedules that are inherent in revenue-neutral tax returns. We show that plans that advance steeply lower marginal tax rate structures would require deep cuts in tax expenditures to offset the revenue losses arising from low rates. Because many of the largest tax expenditures benefit middle- and lower-income households, deep reductions tax expenditures can alter the distribution of the tax burden. To illustrate these tradeoffs, we examine as an example a set of tax rate reductions specified in Governor Romney’s tax plan. We show that given the proposed tax rates and proscription against reducing tax expenditures aimed at saving and investment, cutting tax expenditures will result in a net tax cut for high-income taxpayers and a net tax increase for lower- and/or middle-income taxpayers—even if individual income tax expenditures could be eliminated in a way designed to make the resulting tax system as progressive as possible.
Table 1: Change in After-Tax Income by Income Level
 Memo: Average percent change in after-tax income in revenue-neutral case:
Taxpayers with income below 200k: -1.2%
Taxpayers with children and income below 200k: -3.5%
Taxpayers without children and income below 200k: 0.2%
Note: Baseline is current policy, which assumes that 2011 law is permanent (except for the one-year payroll tax cut and temporary investment incentives). The specified tax changes include extension of the 2001 and 2003 tax cuts and a 20 percent reduction in all individual income tax rates; the repeal of the Alternative Minimum Tax, the federal estate tax, and some of the tax provisions contained in the Affordable Care Act; and the elimination of taxes on long-term capital gains, dividends and interest income for married couples filing jointing with income under $200,000 ($100,000 for single filers and $150,000 for heads of household). In the revenue-neutral case, the analysis assumes that tax expenditures are reduced or eliminated “starting at the top” so that tax preferences are eliminated first for higher-income taxpayers to make the resulting plan as progressive as possible. In practice, revenue-neutrality requires a net tax increase on taxpayers with income below $200,000, which we assume is implemented so that those taxpayers all experience an equal reduction in after-tax income. “Average percent change in after-tax income in revenue-neutral case” assumes equal across-the-board reductions in tax expenditures for taxpayers below $200,000 of 58 percent, the reduction required to achieve revenue neutrality.
Table 2: Change in After-Tax Income by Income Percentile
 Note: Baseline is current policy, which assumes that 2011 law is permanent (except for the one-year payroll tax cut and temporary investment incentives). The specified tax changes include extension of the 2001 and 2003 tax cuts and a 20 percent reduction in all individual income tax rates; the repeal of the Alternative Minimum Tax, the federal estate tax, and some of the tax provisions contained in the Affordable Care Act; and the elimination of taxes on long-term capital gains, dividends and interest income for married couples filing jointing with income under $200,000 ($100,000 for single filers and $150,000 for heads of household). In the revenue-neutral case, the analysis assumes that tax expenditures are reduced or eliminated “starting at the top” so that tax preferences are eliminated first for higher-income taxpayers to make the resulting plan as progressive as possible. In practice, revenue-neutrality requires a net tax increase on taxpayers with income below the 95th percentile, which we assume is implemented so that those taxpayers all experience an equal reduction in after-tax income.
Table 3. Average Federal Tax Changes by Income Levels

Memo: Average federal tax change ($) in revenue-neutral case
Taxpayers with income below 200k: $539
Taxpayers with children and income below 200k: $2,041
Taxpayers without children and income below 200k: -$74
Note: Baseline is current policy, which assumes that 2011 law is permanent (except for the one-year payroll tax cut and temporary investment incentives). The specified tax changes include extension of the 2001 and 2003 tax cuts and a 20 percent reduction in all individual income tax rates; the repeal of the Alternative Minimum Tax, the federal estate tax, and some of the tax provisions contained in the Affordable Care Act; and the elimination of taxes on long-term capital gains, dividends and interest income for married couples filing jointing with income under $200,000 ($100,000 for single filers and $150,000 for heads of household). In the revenue-neutral case, the analysis assumes that tax expenditures are reduced or eliminated “starting at the top” so that tax preferences are eliminated first for higher-income taxpayers to make the resulting plan as progressive as possible. In practice, revenue-neutrality requires a net tax increase on taxpayers with income below $200,000, which we assume is implemented so that those taxpayers all experience an equal reduction in after-tax income. “Average federal tax change ($) in after-tax income in revenue-neutral case” assumes equal across-the-board reductions in tax expenditures for taxpayers below $200,000 of 58 percent, the reduction required to achieve revenue neutrality.
Table 4. Average Federal Tax Changes by Income Percentiles

Note: Baseline is current policy, which assumes that 2011 law is permanent (except for the one-year payroll tax cut and temporary investment incentives). The specified tax changes include extension of the 2001 and 2003 tax cuts and a 20 percent reduction in all individual income tax rates; the repeal of the Alternative Minimum Tax, the federal estate tax, and some of the tax provisions contained in the Affordable Care Act; and the elimination of taxes on long-term capital gains, dividends and interest income for married couples filing jointing with income under $200,000 ($100,000 for single filers and $150,000 for heads of household). In the revenue-neutral case, the analysis assumes that tax expenditures are reduced or eliminated “starting at the top” so that tax preferences are eliminated first for higher-income taxpayers to make the resulting plan as progressive as possible. In practice, revenue-neutrality requires a net tax increase on taxpayers with income below the 95th percentile, which we assume is implemented so that those taxpayers all experience an equal reduction in after-tax income.
APPENDIX: ASSUMPTIONS ABOUT AVAILABLE TAX EXPENDITURES:
On the table:
Exclusion of worker and employer ESI contributions for health plan premiums (current employees and retirees)
Exclusion of worker and employer ESI contributions for dental, vision, and supplemental premiums
Exclusion of worker and employer ESI contributions for HSA and Medical Flexible Spending Accounts
Exclusion of worker and employer ESI contributions for dependent care flexible contributions and other excludable contributions
Partial exclusion of Social Security benefits
Educator Expenses
Self-Employed Health Insurance
Foreign Housing Allowance
Other Above the Line Deductions
Education Expenses Deduction
Student Loan Interest Deduction
Rent Passive Loss
Sales Taxes
State and Local Taxes
Medical Expenses Itemized Deduction
Mortgage Interest
Charitable Contributions
Casualty & Theft Losses
Miscellaneous Itemizations
Hope Education Credit
Lifetime Learning Credit
American Opportunity Credit
Dependent Care Credit
Credit for the Elderly or Disabled
General Business Credit
AMT Credit
Foreign Tax Credit
Earned Income Tax Credit
Child Tax Credit
“Off the table”: (Savings and Investment)
Preferential rate on capital gains and dividends
Exclusion of interest on tax exempt municipal bonds
Deduction for HSA Contributions from taxed income
KEOGH, SEP, & Simple Contribution Deduction
Penalty on Early Withdrawal of Savings
Self-Employment IRA Deduction
Investment Interest
Saver’s Credit
Capital gains exclusion on home sales
Step-up basis of capital gains at death
Off the table (other):
Exclusion of net imputed rental income
Exclusion of benefits and allowances to armed forces personnel
Exclusion of parsonage allowances
Exclusion of certain allowances for Federal employees abroad
Exclusion for benefits provided to volunteer EMS and firefighters
Exclusion of interest on life insurance savings
Exclusion of workers’ compensation benefits
Exclusion of interest spread of financial institutions
Exclusion of public assistance benefits (normal tax method)
Exclusion of special benefits for disabled coal miners
Exclusion of military disability pensions
Exclusion of veterans death benefits and disability compensation
Exclusion of employer-provided educational assistance
Exclusion of veterans pensions
Employer provided child care exclusion
Exclusion of GI bill benefits
Editor’s Note: This paper has a follow-up analysis published after the 2012 election.
[1] These provisions correspond to those provided by http://www.mittromney.com/issues/tax, accessed on June 25nd, 2012.
[2] In an earlier analysis, the TPC estimated a revenue loss of $480 billion for 2015 in a completely static analysis. Our analysis is constructed under the same set of baselines and assumptions, but allows for micro behavioral responses, which reduces the revenue loss in 2015 to $456 billion. See http://taxpolicycenter.org/taxtopics/Romney-plan.cfm.
[3] http://budget.house.gov/uploadedfiles/pathtoprosperity2013.pdf
[4] For example, Governor Romney’s plan proposes to “further reduce taxes on saving and investment,” while Chairman Ryan’s “Path to Prosperity” states, “Raising taxes on capital is another idea that purports to affect the wealthy but actually hurts all participants in the economy… Tax reform should promote savings and investment.” http://paulryan.house.gov/UploadedFiles/Pathtoprosperity2013.pdf, p. 67.
[5] See this paper for a discussion: http://www.taxpolicycenter.org/UploadedPDF/412608-Base-Broadening-to-Offset-Lower-Rates.pdf
[6] Note that this baseline incorporates revenues from the ACA high-income surcharges. Our primary analysis therefore assumes that the repeal of the ACA is “paid for” to achieve revenue neutrality. However, this does not alter our primary conclusions. For example, using a modified baseline that excludes the ACA leads to similar results.
[7] Our revenue estimate only considers the revenue loss attributable to specified changes in income, estate, and payroll tax law. Reducing the corporate tax rate to 25 percent without accompanying corporate tax base broadening would increase the revenue loss to $456 billion.
[8] Without making assumptions regarding which tax expenditures would be eliminated it is impossible to know by how much taxes would rise on any particular household earning less than $200,000, only that, on average for all these households, it must rise by about $500.
[9] http://www.aei.org/files/2011/09/27/TPO-Sept-2011.pdf
[10] http://www.cbo.gov/sites/default/files/cbofiles/ftpdocs/44xx/doc4454/07-28-presidentsbudget.pdf http://www.cbo.gov/sites/default/files/cbofiles/ftpdocs/69xx/doc6908/12-01-10percenttaxcut.pdf
http://www.jct.gov/publications.html?func=startdown&id=1189
[11] See analysis in last section. http://www.economics.harvard.edu/faculty/mankiw/files/dynamicscoring_05-1212.pdf
[12] These include the American Opportunity tax credit for higher education, the expanded refundability of the child credit, and the expansion of the earned income tax credit (EITC).
[13] A complete list of what we assume is “off the table” and “on the table” is included in the Appendix.
[14] http://www.taxpolicycenter.org/UploadedPDF/412608-Base-Broadening-to-Offset-Lower-Rates.pdf
[15] A list of these items is included in the Appendix.
[16] We are implicitly assuming that business tax expenditures reductions would pay for the reduction in the rate to 25 percent and a territorial tax system. According to Treasury (2007), eliminating all business tax expenditures would only be sufficient to pay to cut the rate to 28 percent while retaining the current international tax regime; a shift to territorial taxation would likely reduce revenues making it more difficult to reduce the rate to 28 percent in a revenue neutral reform. As a result, it seems conservative to assume that no net corporate tax raisers would be available to help offset the cost of the reductions in the individual income tax rates. (Note: if the Treasury calculation counts deferral of income in CFCs as one of the business tax expenditures being eliminated, then the required rate rises not only because of the move to territorial but also from the failure to move from the current international system to worldwide taxation)
[17] In general, the reduction in the revenues available is not exactly 20 percent because of interactions among provisions.
[18] This conclusion would be unchanged by the inclusion of the tax expenditures we considered off the table, like the exclusion of veterans and military benefits. The reason is that, with the exception of the imputed rent, these items collectively provide relatively small benefits to households making over $200,000. As a result, eliminating them for those households would add relatively little additional revenue and thus not avoid the tax increase on middle-class families. To the degree these expenditures were limited for households with incomes below $200,000 they would change the composition of tax expenditure reductions for these households but not the average tax increase they faced.
[19] See, for example the CBO analysis of the 2001 and 2003 tax cuts: http://www.cbo.gov/sites/default/files/cbofiles/ftpdocs/44xx/doc4454/07-28-presidentsbudget.pdf
[20] http://www.aei.org/files/2011/09/27/TPO-Sept-2011.pdf
[21] Although most of the tax cuts go to high income households and although high income households receive a large share of their income in the form of capital income, the capital income share of the tax cuts examined in this paper is small because the rates on capital gains and dividends are unchanged relative to the baseline and because the marginal tax rate changes apply to ordinary income, which is largely income from labor.
Related Content


Related Books


Authors