
Despite a robust national economy, deep regional divides persist with technology hubs in the coastal states pulling away from the nation’s industrial Heartland. This growing regional inequality poses serious economic, social, and political consequences for the nation.
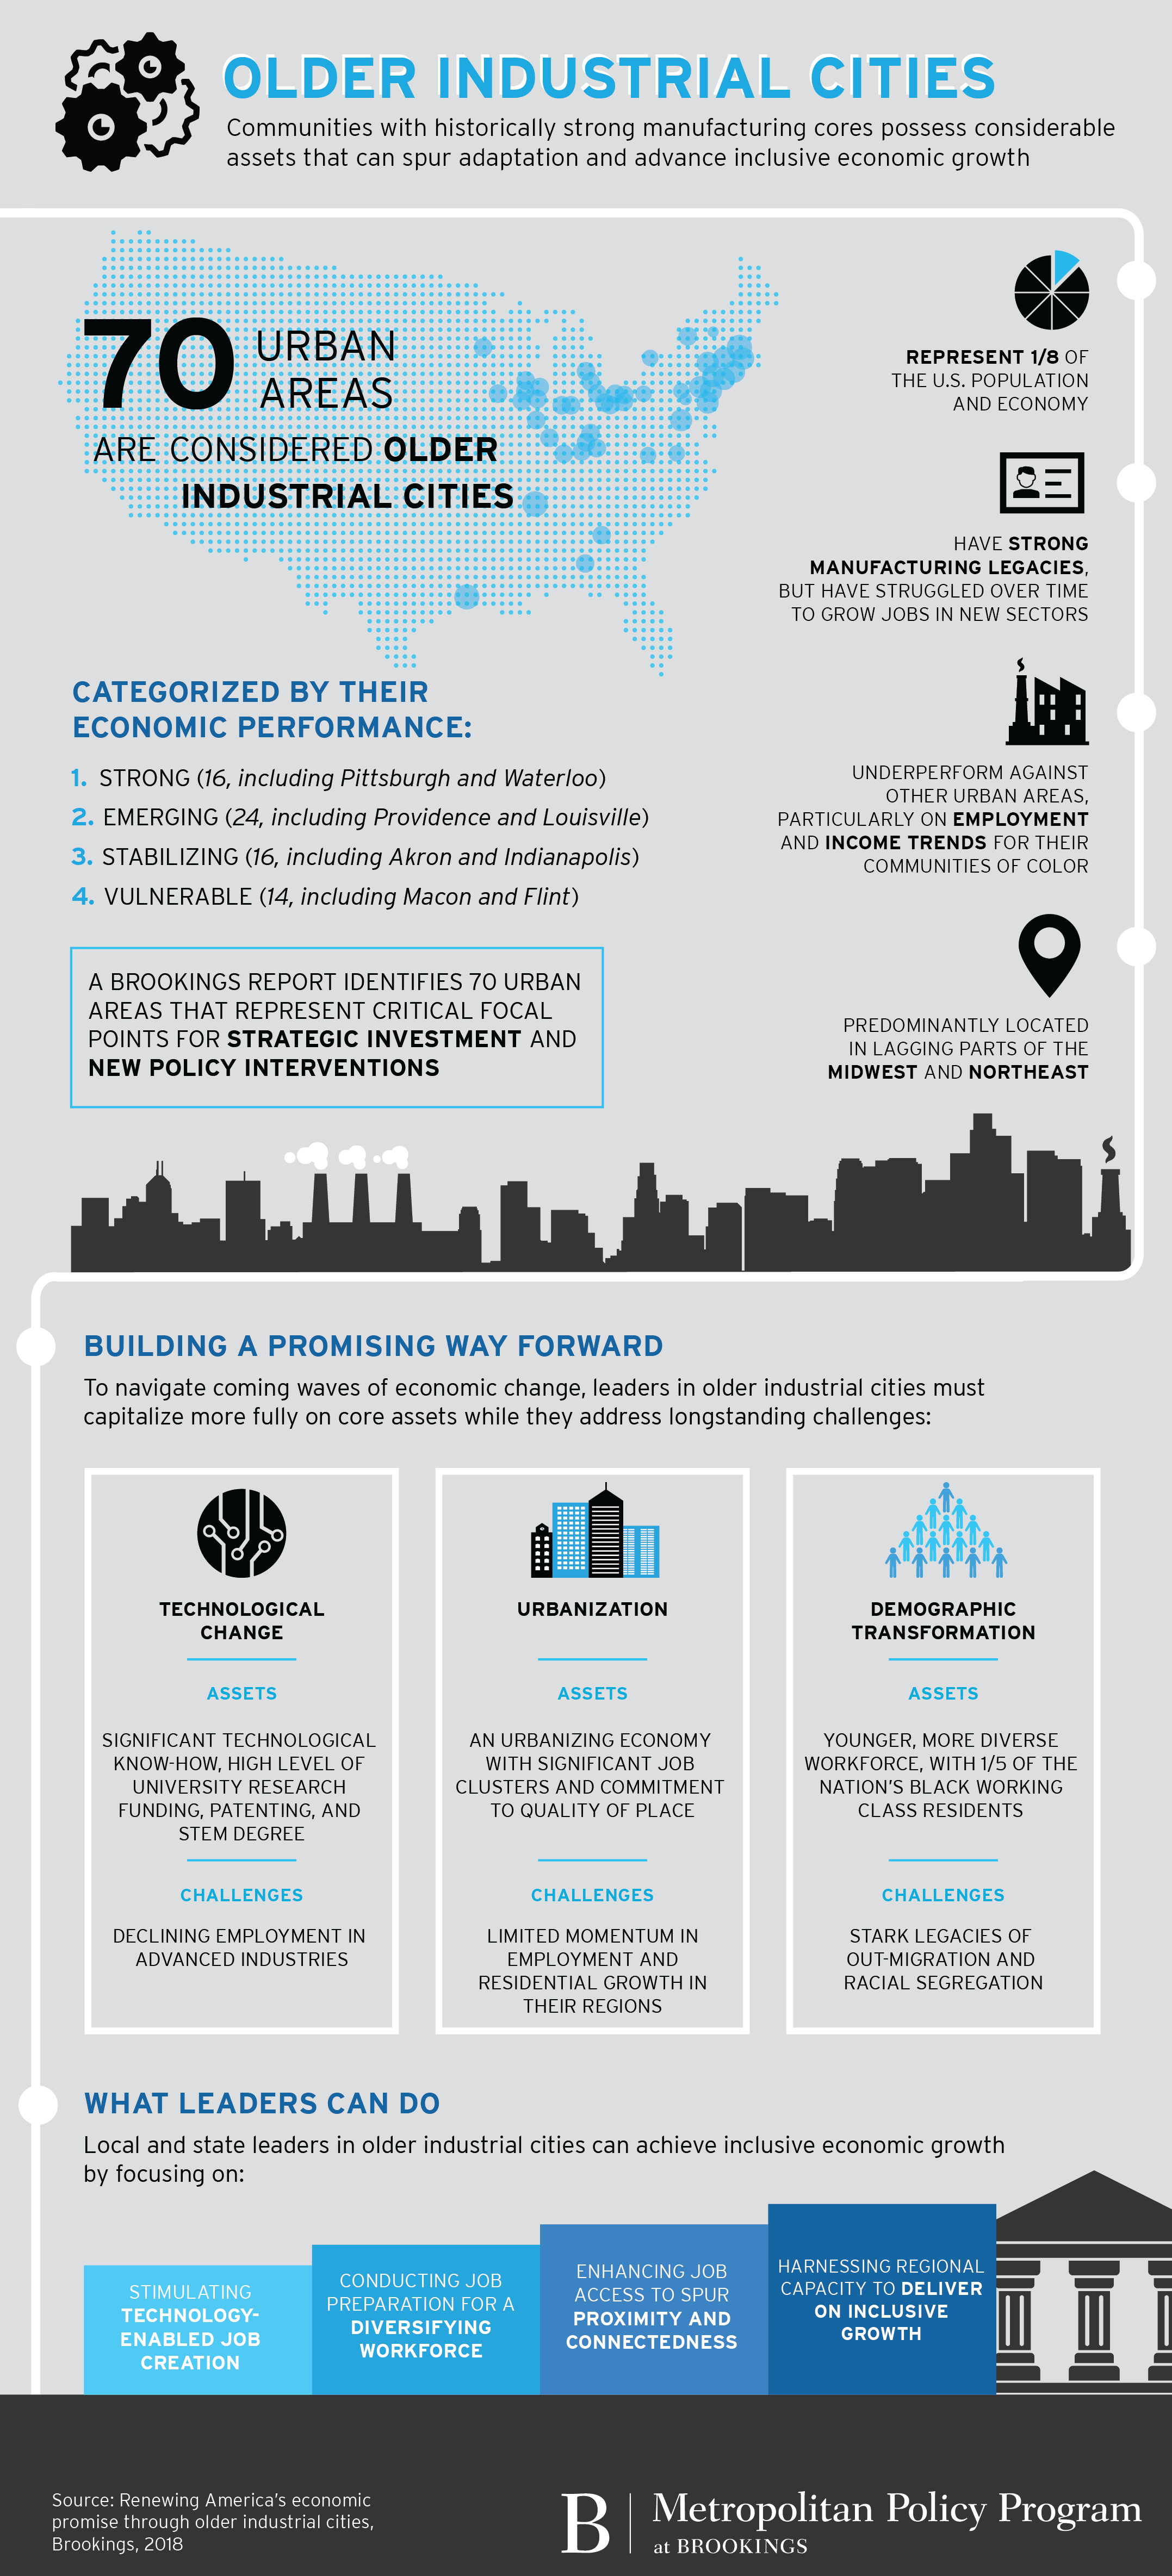
The middling performance of communities with historically strong manufacturing cores is a key feature of America’s uneven economic growth. These so-called older industrial cities, predominantly located in the Midwest and Northeast, have struggled over time to grow jobs in new sectors and to boost employment and income, particularly for their communities of color. They range from very large cities like Baltimore and Detroit, to smaller communities like Schenectady, New York, and Terre Haute, Indiana.
This report identifies, analyzes, and categorizes the considerable assets and distinct challenges of 70 older industrial cities that collectively account for one-eighth of the U.S. population and economy. With increasing interest in local, state, and national policies to revive the fortunes of struggling communities, older industrial cities represent promising regions for strategic investment and critical centers for promoting inclusive economic growth.
Jump to dashboard »
Defining older industrial cities
This report defines an older industrial city as a significant urban area with a history in manufacturing that has struggled over time to grow jobs in new sectors.
Read about the report’s definitions for older industrial cities on page 16 of the full report »
Note: While this report references older industrial cities, the underlying data are based on counties that contain major urban centers.
Presence of a major urban center
We identify 365 urban counties that contain a city with at least 50,000 residents in 2016.
Industrial heritage
Of those 365 counties, we identify 185 urban industrial counties in which manufacturing represented at least 20 percent of all jobs in 1970.
Competitive challenge
Of those 185 industrial urban counties, we identify 70 older industrial counties that transitioned less successfully than other industrial counties from 1970 to 2016.
1. Presence of a major urban center
We identify 365 urban counties that contain a city with at least 50,000 residents in 2016.
2. Industrial heritage
Of those 365 counties, we identify 185 urban industrial counties in which manufacturing represented at least 20 percent of all jobs in 1970.
3. Competitive challenge
Of those 185 industrial urban counties, we identify 70 older industrial counties that transitioned less successfully than other industrial counties from 1970 to 2016.
Performance
How are older industrial cities faring?
Through much of the twentieth century, older industrial cities were the engines of America’s unparalleled manufacturing prowess. However, in the last few decades, they have grown slowly, with stagnant populations and tepid job growth.
Read more about the growth of older industrial cities on page 27 »
Older industrial communities have not grown in population since 1970
Indexed population growth, 1970-2016
OIC economies have, by definition, grown more slowly than others
Indexed output, employment, and jobs at young firms
Older industrial communities have not grown in population since 1970
Indexed population growth, 1970-2016
Source: Brookings analysis of decennial census and American Community Survey data.
OIC economies have, by definition, grown more slowly than others
Indexed output, employment, and jobs at young firms
Note: Jobs at young firms refers to employment at firms less than five years old.
Source: Brookings analysis of Moody’s Analytics and Census Bureau data.
Source: Brookings analysis of decennial census and American Community Survey data.
Note: Jobs at young firms refers to employment at firms less than five years old.
Source: Brookings analysis of Moody’s Analytics and Census Bureau data.
Concurrently, older industrial cities have lagged behind similar places on measures of prosperity and inclusion, with lower gains in productivity and median income.
Read more about the prosperity of older industrial cities on page 28 »
OIC economies are lagging on prosperity
Indexed productivity and per capita income
OICs are rebounding on employment but not income
Employment ratio and median income, 2000-2016
OIC economies are lagging on prosperity
Indexed productivity and per capita income
Source: Brookings analysis of Moody’s Analytics, decennial census, and American Community Survey data.
OICs are rebounding on employment but not income
Employment ratio and median income, 2000-2016
Note: Employment-to-population ratio is calculated among the civilian population aged 25-64.
Source: Brookings analysis of decennial census and American Community Survey data.
Source: Brookings analysis of Moody’s Analytics, decennial census, and American Community Survey data.
Note: Employment-to-population ratio is calculated among the civilian population aged 25-64.
Source: Brookings analysis of decennial census and American Community Survey data.
Stark variations in inclusion outcomes by race and place characterize older industrial cities, including wide racial gaps in income and employment, and higher levels of concentrated poverty and economic segregation.
Read more about older industrial cities’ inclusion measures on page 30 »
Employment patterns in OICs diverge by race
Employment-to-population ratio, non-Hispanic whites vs. people of color, 2010-2016
Concentrated poverty rose faster in OICs
Share of population living in extreme-poverty neighborhoods, 2000-2016
OICs also exhibit greater economic segregation
Share of population living in poor and wealthy neighborhoods, 2006-10 vs. 2012-16
Employment patterns in OICs diverge by race
Employment-to-population ratio, non-Hispanic whites vs. people of color, 2010-2016
Note: Employment-to-population ratio is calculated among the civilian population aged 25-64.
Source: Brookings analysis of American Community Survey data.
Concentrated poverty rose faster in OICs
Share of population living in extreme-poverty neighborhoods, 2000-2016
Note: Extreme-poverty neighborhoods are census tracts with poverty rates of 40 percent or higher.
Source: Brookings analysis of American Community Survey data.
OICs also exhibit greater economic segregation
Share of population living in poor and wealthy neighborhoods, 2006-10 vs. 2012-16
Note: Poor and wealthy neighborhoods are census tracts with median household incomes below 67 percent and above 150 percent,respectively, of county-wide median income.
Source: Brookings analysis of American Community Survey data.
Note: Employment-to-population ratio is calculated among the civilian population aged 25-64.
Source: Brookings analysis of American Community Survey data.
Note: Extreme-poverty neighborhoods are census tracts with poverty rates of 40 percent or higher.
Source: Brookings analysis of American Community Survey data.
Note: Poor and wealthy neighborhoods are census tracts with median household incomes below 67 percent and above 150 percent, respectively, of county-wide median income.
Source: Brookings analysis of American Community Survey data.
Based on their medium-term economic performance (2000 to 2016), older industrial cities group into a four-part typology that relates to their future prospects for improved economic growth and opportunity:
- Strong older industrial cities (16 in all) are not growing particularly rapidly, but achieve high marks on prosperity and inclusion (ex: Pittsburgh, Pa. and Waterloo, Iowa)
- Emerging older industrial cities (24 in all) are regionally diverse and exhibit average marks among all urban counties on prosperity and inclusion (ex: Providence, R.I. and Louisville, Ky.)
- Stabilizing older industrial cities (16 in all) generally rank among the bottom third of all counties on measures of growth, prosperity, and inclusion (ex: Akron, Ohio and Indianapolis, Ind.)
- Vulnerable older industrial cities (14 in all) rank among the bottom 5 percent of all urban counties on a combined index of growth, prosperity, and inclusion (ex: Macon, Ga. and Flint, Mich.)
Assets and Challenges
What factors influence older industrial cities’ adaptation to major economic and social forces?
This report focuses on three primary forces that are reshaping local and regional economies—technological change, urbanization, and demographic transformation—which illuminate older industrial economies’ assets and challenges.
Advantages + Opportunities
Older industrial cities possess significant assets that can enable their continued adaptation to economic pressures.
Older industrial cities boast an outsized presence of research universities that attract considerable federal funding for scientific research, and their STEM-trained workforces generate high numbers of patents. They are located in a highly urbanized area of the country and contain important clusters of employment at the neighborhood scale. And they are attracting new migrants both from abroad and from some of the nation’s more expensive, tech-heavy cities.
Read more about the assets of older industrial cities on page 37 »
OICs house many significant research-intensive universities
NIH and NSF grant dollars per capita, 2016
OICs retain significant, growing urban employment clusters
Median share of jobs in employment clusters, 2015
Immigrants are becoming larger shares of the local population in OICs
Change in foreign-born population share, 2010-2016
OICs house many significant research-intensive universities
NIH and NSF grant dollars per capita, 2016
Source: Brookings analysis of USASpending.gov data.
OICs retain significant, growing urban employment clusters
Median share of jobs in employment clusters, 2015
Note: Employment clusters are census tracts where jobs per square mile ranks in the top quintile of all U.S. census tracts.
Source: Brookings analysis of Census Longitudinal Employer Household Dynamics data.
Immigrants are becoming larger shares of the local population in OICs
Change in foreign-born population share, 2010-2016
Source: Brookings analysis of American Community Survey data.
Source: Brookings analysis of USASpending.gov data.
Note: Employment clusters are census tracts where jobs per square mile ranks in the top quintile of all U.S. census tracts.
Source: Brookings analysis of Census Longitudinal Employer Household Dynamics data.
Source: Brookings analysis of American Community Survey data.
Challenges + Disparities
At the same time, older industrial cities have complicated economic and social legacies that pose unique challenges for their efforts to stimulate growth and broaden access to opportunity.
Older industrial cities have shed jobs in advanced industries and may have fewer avenues to technology-enabled innovation and growth. Their shares of metropolitan employment continue to decline, and their rates of new housing development lag those in other urban areas. And their histories of racial segregation have yielded considerable contemporary disparities between whites and people of color in educational attainment and occupational access.
Read more about the challenges of older industrial cities on page 42 »
OICs lost more advanced manufacturing jobs, and grew fewer advanced services jobs
Indexed advanced industries employment, 2000-2016
OICs lag other urban counties on new residential development growth
Percent change in housing unit permits, 2010-2016
Workers of color in OICs are more concentrated in low-paying sales and services jobs
Minority overrepresentation in low-wage jobs
OICs lost more advanced manufacturing jobs, and grew fewer advanced services jobs
Indexed advanced industries employment, 2000-2016
Source: Brookings analysis of Moody’s Analytics data.
OICs lag other urban counties on new residential development growth
Percent change in housing unit permits, 2010-2016
Source: Brookings analysis of Census Building Permits Survey data.
Workers of color in OICs are more concentrated in low-paying sales and services jobs
Minority overrepresentation in low-wage jobs
Note: Rate reflects difference between workers of color share in lower-wage occupations and share of all workers.
Source: Brookings analysis of American Community Survey data.
Source: Brookings analysis of Moody’s Analytics data.
Source: Brookings analysis of Census Building Permits Survey data.
Note: Rate reflects difference between workers of color share in lower-wage occupations and share of all workers.
Source: Brookings analysis of American Community Survey data.
Responses
How can older industrial cities achieve improved growth and opportunity?
While older industrial cities possess varying assets and challenges, they are places worth investing in for the future of the country, where we can build on the strengths of innovative institutions, knowledgeable workers, valuable infrastructure, and civic commitment. This report offers a framework and promising responses for state and local leaders in older industrial cities to achieve inclusive economic growth, including:
- Learning from older industrial cities that have effectively transitioned from their industrial past and embraced the goal of inclusive economic growth. Public and private actions have focused on (1) identifying and investing in key technological capabilities; (2) spurring strategic urbanization; (3) preparing a diverse workforce for current and future opportunities; and (4) stewarding inclusive growth at the regional scale.
- Building on existing local and state efforts already at work in older industrial cities, while emphasizing collaboration and shared responsibility among local stakeholders. These efforts promote increased job creation, job preparation, and job access, with strategic emphasis on overcoming stark legacies of out-migration and economic segregation.
- Expanding economic opportunity for people and neighborhoods of color, and establishing new metrics and frameworks for inclusive success. The economic strength of OICs overall, and the economic resiliency of their racial and ethnic minority populations, are closely related.
Dashboard
This interactive dashboard provides data on each of the 70 older industrial cities, including their inclusive economic growth performance, a summary of key assets and challenges, and their position in the four-part typology.
To access the data in spreadsheet format, please see the downloads section at the top of the page.
…
View all of the report’s graphics in a slideshow here »
Data visualization produced by Alec Friedhoff.
Authors


