The history of population growth in the United States has been largely tied to immigration. Current high levels of immigration combined with a slower growing U.S.-born population is changing our demography, and transforming the racial, ethnic, linguistic, religious, age, and skills composition of many places across the country. While the more than 42 million foreign-born U.S. residents comprise 13 percent of the population, these shares differ widely across metropolitan areas.
Ten years ago, the Brookings paper “The Rise of New Immigrant Gateways” documented how an immigrant population primarily concentrated in urban centers—such as New York, Chicago, and Los Angeles—was beginning to disperse to fast-growing metropolitan areas, primarily in the South and West.
A subsequent paper revised and expanded the typology using the U.S. Census Bureau’s 2009 American Community Survey (ACS) data. This brief examines recent trends in immigrant population growth (2000-2014) through an updated metropolitan immigration gateway typology, with special attention to the working age population, and the impact of immigrants on population change in metropolitan America.
It also updates the typology for the 104 largest U.S. metropolitan areas (those with at least 500,000 people in 2010) using the 2014 ACS data and Office of Management and Budget’s (OMB) 2013 metropolitan area delineations.
The refreshed analysis —built on metropolitan immigration trends in the size, concentration, and rate of growth of the immigrant population using more than a century of data from the Census Bureau (using data from NHGIS.org)—shows that:
Eighty percent of the nation’s immigrants live in one of 57 named immigrant gateways, which are classified into seven types.
The immigrant gateways typology summarizes both continuity and change among the largest U.S. metropolitan areas. Over the course of the 20th century, immigrant destinations have shifted as the economy transitioned from one based on agriculture, to one dominated by manufacturing, to the current one characterized by job growth in the service and technology sectors. As U.S. cities and suburbs developed throughout the 20th century, population growth and economic activity became less concentrated in urban cores as massive growth occurred in suburbs after World War II. At the same time, the population began to shift to the South and West, and immigrants followed those trends, giving rise to new immigrant gateways in the contemporary period, many with little history of mass immigration.
Currently, 86 percent of all foreign-born persons in the United States live in the 104 metro areas analyzed here. Among the 104 largest metropolitan areas, 57 have distinctive patterns of historical immigrant settlement and are classified into seven types of named immigrant gateways: former, major-continuous, minor-continuous, post-World War II, re-emerging, major-emerging, and minor-emerging. The remaining 47 metro areas did not meet the criteria for any of the gateways and include places with small foreign-born populations, although some are growing. See the metropolitan gateway classification guide (PDF) for descriptions of each.
Four gateway types represent established settlement areas, and three represent new or re-emerging immigrant locations.
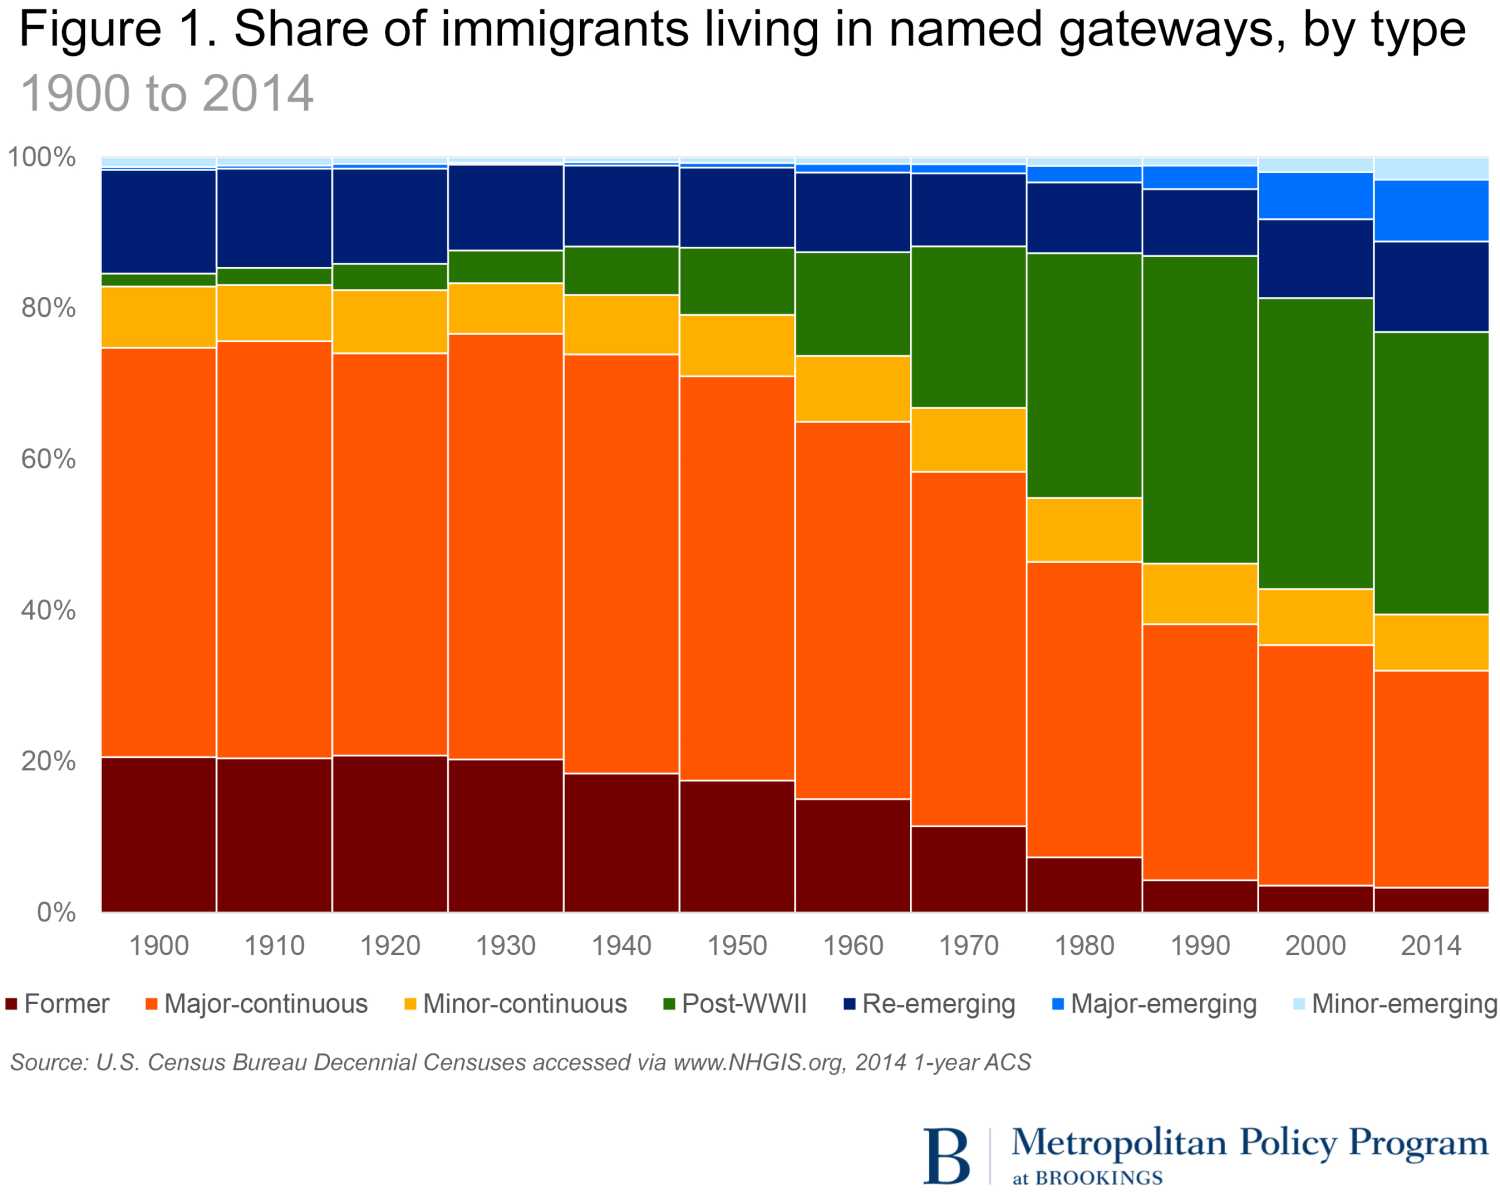
Based on the size and growth of their immigrant populations, four types of metro areas stand out as established immigrant gateways: former, major-continuous, minor-continuous, and post-WWII. The former gateways are mostly located in the Midwest and saw their manufacturing heyday in the earlier half of the 20th century, but have since waned. During the 1900 to 1930 period, 20 percent of all immigrants in a named gateway lived in just these seven metro areas: Buffalo, Cleveland, Detroit, Milwaukee, Pittsburgh, Providence, and St. Louis. That figure is now 3 percent (Figure 1).
Four large metro areas (Boston, Chicago, New York, and San Francisco) have had sustained continuous immigration, attracting more than their fair share of immigrants. While these major-continuous gateways housed more than half of all immigrants through 1960, only 29 percent of immigrants lived in one in 2014.
Yet, their minor-continuous counterparts—with more modest but equally long immigration histories—have maintained a fairly steady 7 or 8 percent of the total.
Gateways that developed after World War II are some of the largest presently, and more than one in three immigrants live in one of these six metropolitan areas, all of which are located in the West or the South: Dallas-Ft. Worth, Houston, Los Angeles, Miami, Riverside, San Diego, and Washington, D.C. The post-WWII gateways have seen impressive numeric growth, comprising just a tiny share of the total (2 percent) in the early 20th century, by 1990 they topped out at 41 percent and currently house 37 percent of immigrants.
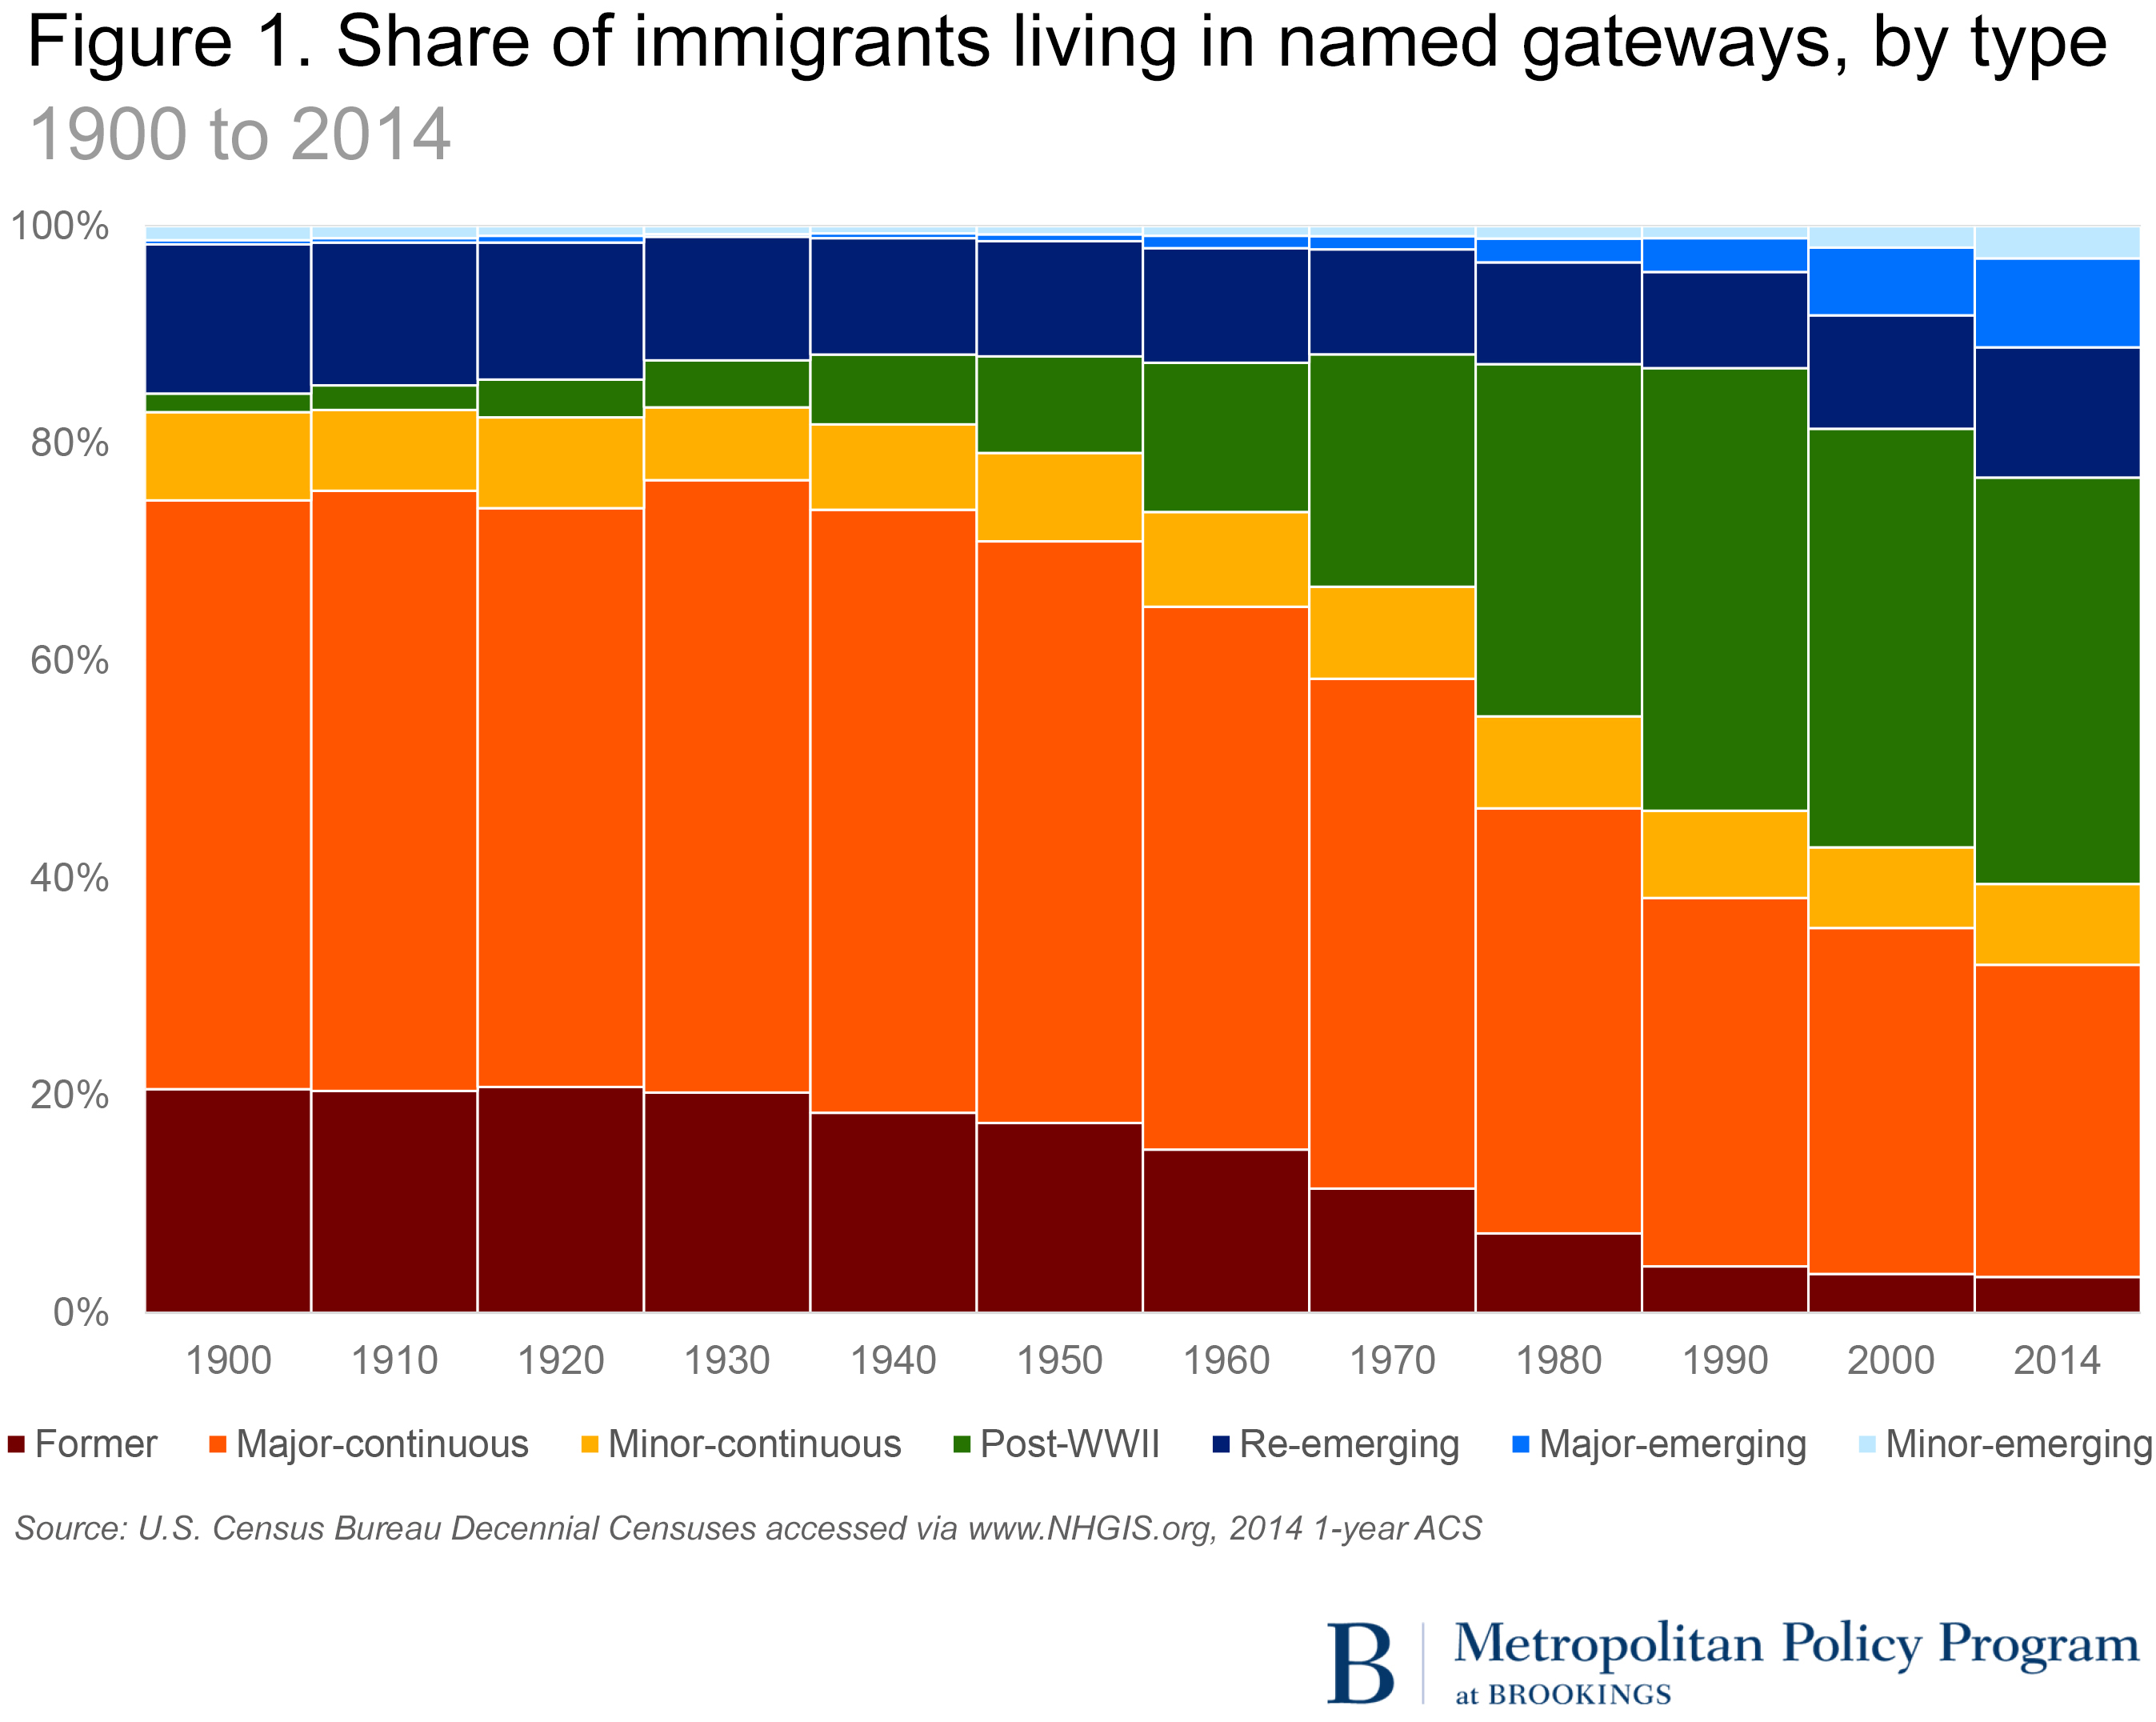
The other three gateway types are those that are emerging or re-emerging in the 21st century. The re-emerging gateways, metro areas including Baltimore and Philadelphia in the East, and Seattle and Denver in the West, had significant immigrant populations in the early 20th century and declines at mid-century, trends akin to the former gateways. By the end of the 20th century and into the beginning of the 21st, the re-emerging gateways had a solid uptick in immigrants, inching up to 12 percent in 2014, but not yet reaching the level of 14 percent seen in 1900.
The fastest contemporary growth rates belong to the major-emerging gateways (Atlanta, Austin, Charlotte, Las Vegas, Orlando, and Phoenix); together they comprise 8 percent of the total foreign-born population in 2014.
The up-and-coming minor-emerging gateways had miniscule foreign-born populations until very recent, very fast growth. They include places such as Nashville, Raleigh, Durham, and Greensboro in the South and Columbus and Indianapolis in the Midwest. Together both emerging gateway groups now make up 11 percent of the total.
Two gateway types have been renamed, and two metro areas have been reclassified from one type of gateway to another.
Metropolitan areas are dynamic and their population shifts reflect changes in economic and social conditions. Over time, changes in the size, share, and growth rates of immigrant populations require reclassification of some metro areas between gateway types and re-labeling of categories.
The 2000 to 2014 period saw relatively fast growth in the number of immigrants living in the United States even as it was interrupted by the recession, which temporarily slowed immigration and produced variable economic recovery across metropolitan areas. Still, more than 11.3 million more immigrants live in the United States in 2014 than in 2000 for a total of more than 42 million foreign-born persons.
In this update, two of the seven immigrant gateway types have been renamed. What were previously termed “emerging” gateways are now the “major- emerging” gateways, and what were the “pre-emerging” gateways are now “minor-emerging.”
Two metropolitan areas changed categories since 2009. With nearly one-quarter of a million immigrants, Charlotte joins the major-emerging gateways, all with foreign-born populations between 200,000 and 750,000. Indianapolis is now a minor-emerging gateway with more than 125,000 immigrants, on par with others in that category including Columbus, Nashville, Raleigh, and Salt Lake City.
Immigrants continue to find opportunities in both more established gateways as well as those that are emerging and re-emerging in the 21st century. New York, for example, had a whopping net increase of nearly 900,000 immigrants between 2000 and 2014, and Houston and Miami each gained over half a million new immigrants. Atlanta’s gain of more than 300,000 foreign-born topped the major-emerging gateways, and Seattle’s nearly 250,000 was the largest increase among re-emerging gateways.
Across all gateway types the foreign-born population is growing faster than the native-born population, and in all three of the emerging gateway types, increases in the immigrant population outpace the U.S. average.
The population growth of metropolitan areas is currently dependent on immigration, although it varies considerably across metro areas. While natural increase (births over deaths) in population is an important source of growth, in-migration of both U.S. and foreign-born persons contribute in uneven ways across places. The three emerging gateway types experienced faster increases in immigrant population than the established gateways, and all have higher growth rates than the U.S. population as a whole in the 2000 to 2014 period (Figure 2).
Together, the six major-emerging gateways grew by 39 percent, three times the U.S. average, with their U.S.-born populations growing by 35 percent, and their immigrant populations by 74 percent. However, the minor-emerging gateways experienced the fastest increases in their foreign-born population, including Nashville, Indianapolis, and Cape Coral, FL. It is worth noting that while the nine minor-emerging gateways together have doubled their foreign-born populations, the major-emerging immigrant gateways have the fastest growing overall populations across the 2000-2014 period, with natural increase, in-migration of U.S.-born people, and immigrants all playing a role. Re-emerging gateways experienced slightly higher total and U.S.-born growth rates on the whole, relative to the total U.S. population, but immigrant growth was stronger, in particular in Baltimore and the Twin Cities.
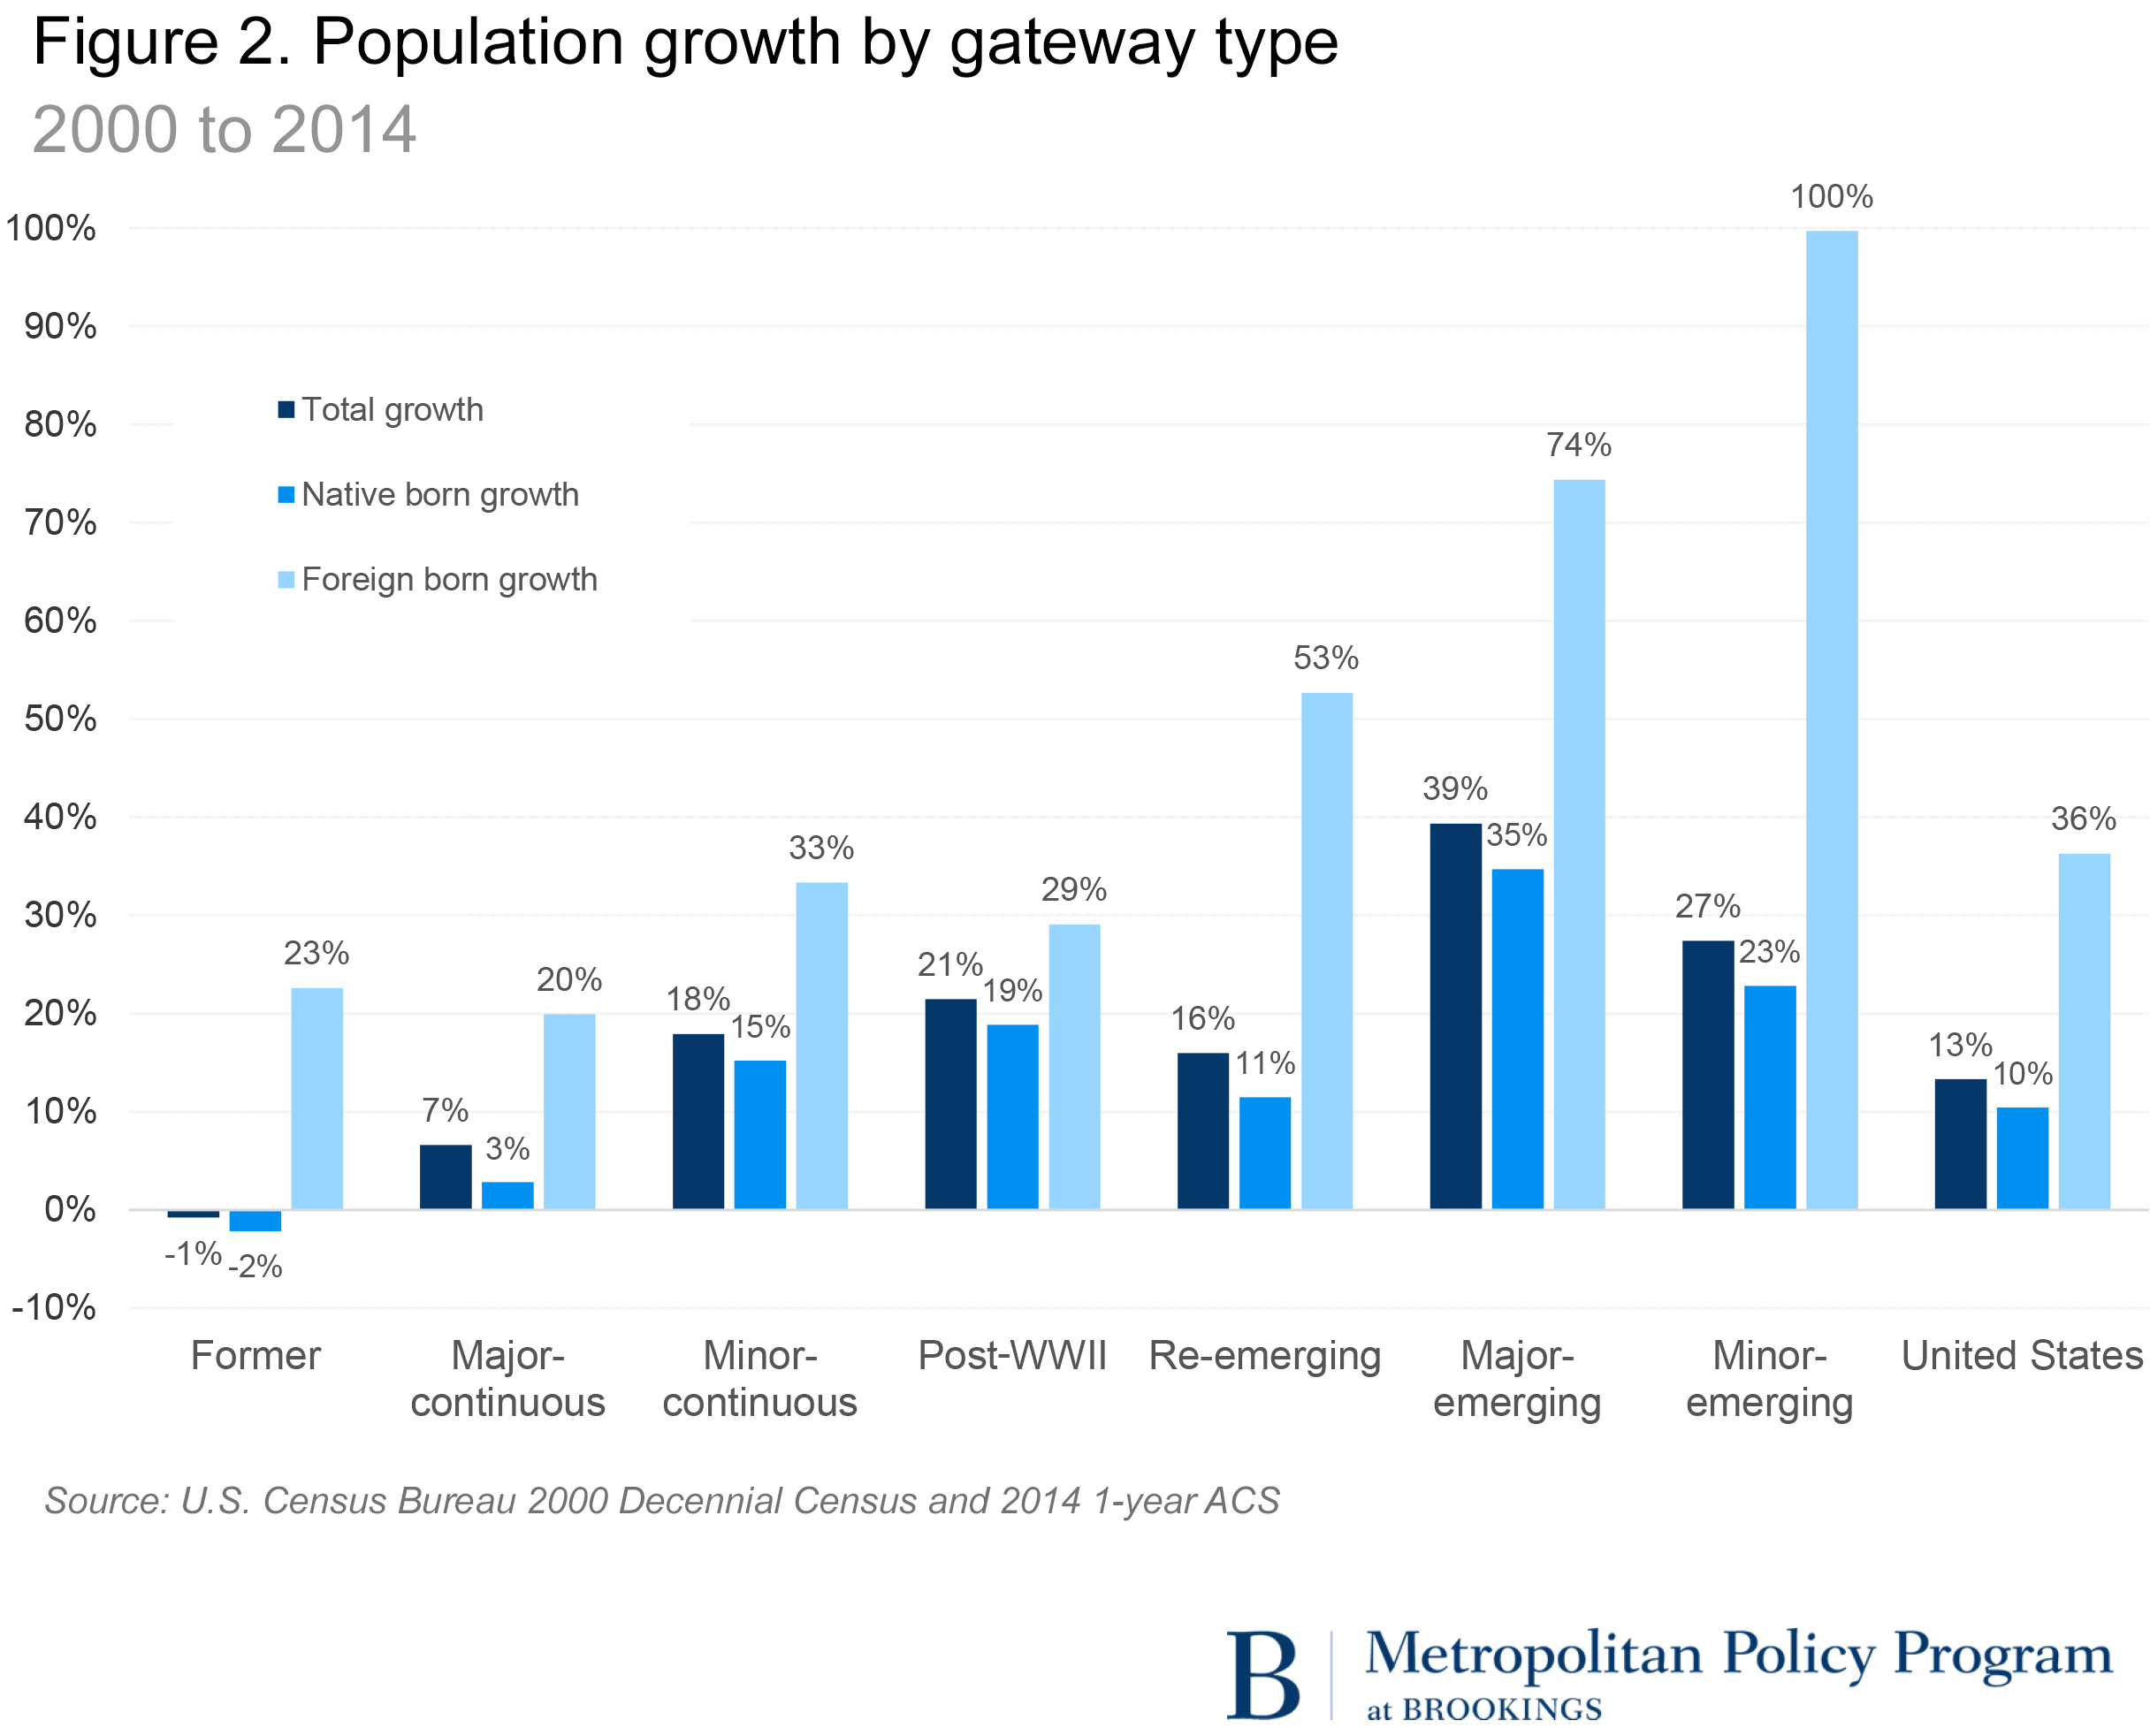
It is not a surprise that the former and major-continuous gateways saw the slowest growth rates in the 2000-2014 period, but for different reasons. The former gateways include Buffalo, Cleveland, Detroit and Pittsburgh, all metro areas that have declined in overall population during the period due to a shrinking native-born population. In contrast, the immigrant population grew by 23 percent on average across the seven former gateway metros. A number of municipal and non-profit leaders in many of these gateways have made the case for attracting and retaining immigrant workers and families as a boon for local economies and a tonic for shrinking populations.
The major-continuous gateways have a different storyline. They have a large, long-standing immigrant base and thus the rate of population increase of this group is lower, despite the fact that immigrants continue to go to these places. For their part, the minor-continuous gateways are a combination of the slower-growing New England metro areas such as New Haven, Bridgeport, and Hartford, with faster-growing metro areas in Texas and California such as San Antonio, McAllen, and Bakersfield posting more elevated growth rates. Boasting some of the largest immigrant populations in America, the post-WWII gateways together grew faster than the U.S. average, but their immigrant increases fell below the U.S. average despite the absolute numeric gains registered by Houston, Miami, Washington, D.C., Dallas-Ft. Worth, and Riverside, Calif. in particular. Notably Los Angeles’ population growth is slowing across the board.
In all of the immigrant gateway metros, the share of the foreign-born population of prime working age (25-64) is greater than the share of the native born, with the gap between the two ranging from 2 percent in Buffalo to 36 percent in Bakersfield, Calif.
The question of whether the United States will be able to replace its labor force to remain economically viable in the global market is also tied to immigration. The majority of immigrants come to the United States during their most productive working and reproductive years. This will prove to be more important in the next several decades as the large cohort of U.S.-born baby boomers enter retirement age.
The difference in the age composition of the immigrant and the native population is evident already. While 53 percent of the total U.S. population is in the prime working ages (25-64); only 50 percent of the native born population is in this age range versus 72 of the foreign-born population. This plays out differently across metro areas (Figure 3). In examining the percentage point difference in the share of foreign-born and native-born of prime working age (25 to 64), it is possible to see where immigrants are potentially contributing most to the labor supply across metro areas. Fast-growing minor-continuous gateways in the Southwest, such as Bakersfield, McAllen, and Fresno have greater shares of the immigrant population of prime working age relative to the native population. Indeed, the 10 metropolitan areas with the greatest differences in the two are all minor-continuous (those primarily in the Central Valley in California) or post-WWII gateways in Texas and California (Houston, Dallas-Ft. Worth, and Riverside).The exception is San Jose, a re-emerging gateway. On the other end of the spectrum, the 10 metro areas with more similar shares of both native- and foreign-born in the prime working ages include almost all of the former gateways, and the many in the group of minor-continuous gateways in New England, along with Tucson.
Note: Percentage point difference between foreign- and native-born population shares in prime working ages (25-64)
Being of working age, however, doesn’t guarantee employment or economic success. The integration of immigrants, especially when it comes to education, occupational training, and English language ability remains critical for metropolitan areas to make the most of their immigrant population and their mostly U.S.-born offspring.
One thing is sure, the search for a better life and greater economic opportunities that have drawn so many immigrants to the United States over its history hasn’t changed. But the locations where those opportunities are found have shifted over time.
The Brookings Institution is committed to quality, independence, and impact.
We are supported by a diverse array of funders. In line with our values and policies, each Brookings publication represents the sole views of its author(s).