Content from the Brookings Institution India Center is now archived. After seven years of an impactful partnership, as of September 11, 2020, Brookings India is now the Centre for Social and Economic Progress, an independent public policy institution based in India.
This Working Paper was prepared for a roundtable discussion on the Food Security Act. For a summary and videos from the discussion, click here.
Contents
- Introduction
- Different estimates of the costs of the Food Security Act to the government
- Nutrition in India
- Food Production and Food Consumption Trends
- Public Distribution System
- References
Introduction
The UPA government’s rights-based welfare initiatives have fueled much controversy over the last decade. The Food Security Bill, recently (and contentiously) passed in the Rajya Sabha, has been an integral part of this rights vs. entitlements debate. The Food Security Bill (FSB) aims to provide subsidized food grains to around 67% of India’s 1.2 billion people. As per the provisions of the bill, beneficiaries would get rice at Rs 3 per kg, wheat at Rs 2 per kg, and coarse grains at Rs 1 per kg. Every pregnant woman and lactating mother would get free meal during pregnancy till six months after child birth while availing of a maternity benefit of Rs 6000 in installments.
Arguments in favour of the FSB centre on the benefits of a reformed PDS system along with the need for investment in human capital. Some who are in favour of food security have criticized the details of the bill in particular for leading to over-centralisation of the PDS and ineffective distribution by shifting from per-capita to per-household. Other criticisms include allegations of populist politics, flawed measurements of poverty/malnutrition, principled opposition to entitled-based welfare, and unaffordable macroeconomic costs. While the Finance Minister has stated that the Budget has provided an additional Rs 10,000 crore towards the food security law with a provision of Rs 80,000 crore for food subsidy in 2013-14, other projected costs determine that we will be spending not less than Rs 2,00,000 crore (Gulati). In addition, justifications for the FSB’s necessity to 67% of the population have been called into question, fueling a debate on flawed standards for measuring malnutrition and/or hunger.
But, all this is behind us now. The bill has become an act, an instrument of state policy. The debate needs to refocus on how to make it work as efficiently as possible. Solutions have to be found for the several potential weaknesses that have been highlighted in the debate.
Fiscal uncertainties: Estimated costs of the food security bill range from Rs. 85,000 crore a year to approximately Rs. 3,14,000 crore a year – which is more likely and how well can our current fiscal situation handle such levels of unpredictable expenditure?
Agricultural production: Price incentives in agricultural production have altered cropping patterns leading to disproportionate market values and stagnating yield of essential crops. This has resulted in more grain production at the cost of other foods such as pulses, vegetables and fruits, making dietary diversification and a nutrient-balanced meal increasingly difficult for households to afford.
Nutritional implications: A 2011 report shows that almost half of children under 5 years of age are malnourished. Are WHO indicators genetically relevant to our population, or do they overestimate the proportion of the stunted and underweight? While macronutrient deficiency (that is, deficiency of calories and proteins) is prevalent, studies have shown that the traditional cereal-pulse diet excludes several essential micronutrients (vitamins and minerals). Although under-nutrition is the leading cause of death in India, over-nutrition is paradoxically a close second – how can food subsidies reconcile these deficiencies?
Efficiency of delivery: The Bill seeks to reform the PDS in various ways by incorporating UID to identify beneficiaries, ensuring transparency of distribution through end-to-end computerization, enabling cash-transfer schemes and doorstep delivery to fair price shops. Will these measures be able to effectively curb deep-seated leakages and inefficiencies?
Estimated costs of the Food Security Act
Government of India (as articulated by Mr. P. Chidambaram, Finance Minister): Rs. 1,27,000 crore a year
“I have already said fiscal deficit target of 4.8% of GDP and the absolute number indicated in the Budget is a red line. The red line will not be breached. We have done our sums”. Chidambaram said the government has provided enough money towards implementing the new scheme. The Budget had provided an additional Rs 10,000 crore towards the food security law besides a provision of Rs 80,000 crore for food subsidy in 2013-14.
“As the rollout takes place in different states on different dates, the money would be made available. In fact, after providing for the food security bill, we would still remain within the limits that were accepted in the Budget papers,” the minister said.
According to the estimates of the consumer affairs ministry, after factoring in the impact of the food subsidy law, the food subsidy bill will cost Rs 1.27 lakh crore a year.
Surjit Bhalla, Oxus Investments: Rs 3,14,000 crore a year
“Start with the pre-FSB year of 2011-12, when the food subsidy bill was Rs 72,000 crore. In that year, 44.5 percent of the population accessed the public distribution system (PDS), taking an average of Rs 2.1 kg per head in subsidised food per month, according to National Sample Survey (NSS) data.
Under the Sonia-backed FSB, the per head entitlement will be 5 kg of rice or wheat or coarse cereals at Rs 3, Rs 2 or Re 1 a kg,
Bhalla takes the weighted market price of rice and wheat (assuming the PDS user takes his 2.1 kg monthly average) at Rs 19 a kg, from which he minuses the average price paid at the ration shop (Rs 5.5 per kg), leaving a subsidy of Rs 13.5 percent to be paid by the UPA.
Now, adjust 2.1 kg per head (actual drawal from the PDS per head per month) to 5 per kg under FSB, and adjust again for the fact that the per head subsidy under FSB will be Rs 16.5 per kg (against Rs 13.5 per kg earlier), and adjust once more for the fact that subsidies will now cover 67 percent of the population (against current PDS’s the 44.5 percent).
Do the math and Rs 72,000 crore of 2011-12 food subsidy before the FSB bloats to Rs 3,14,000 crore.”
Ashok Gulati, Chairman of the Commission for Agricultural Costs and Prices: Rs. 2,00,000 crore a year
“The estimates of direct food subsidy for a full year hover around Rs 1,30,000 crore at this year’s prices, up from about Rs 80,000 crore last year. By next year, when hopefully the full roll-out takes place, at least 8-10% more can be added on account of rising support prices and costs of procurement, storage and distribution. The full year cost will not be below Rs 1,40,000 crore in FY 2015. And this does not include additional investments that would be needed to store grains, in the railways to move the grains, to modernise the PDS at the state level and, above all, in agriculture to stabilise production of grains. If one adds all these additional costs to make the FSB a meaningful ‘right to food’ act, the costs will reach Rs 2,00,000 crore a year.”
Ashok Kotwal, Milind Murugkar, Bharat Ramaswami: Rs 85,000 crore a year
“In rupee terms, the subsidy increases from R72,000 crore (approximately $11.8 billion) to R85,000 crore (approximately $13.9 billion) firmly within 1% of GDP.
The major concern about the NFSO is not its immediate cost. The major concern ought to be how to ensure that the full benefits are received by households. How can leakages be stopped? The costs to think about are those borne by households and not by the government. A PDS-driven model drives out local and often more nutritious cereals from household budgets. On the producer side, excessive increases in the minimum support price lead to more grain production at the cost of other foods such as pulses, vegetables and fruits. These latter costs are certainly not budgetary costs. But still, the debate about the NFSO should be about these costs and how they can be minimised by the judicious use of cash transfers and other policies. We hope that the debate will not be led astray by reckless calculations that remain unexamined.”
DK Joshi, chief economist at ratings agency Crisil: will exceed Rs. 1,25,000 crore a year
“The government will have to work on cutting wasteful spending and get aggressive on reducing fuel and fertiliser subsidy. There is a good probability of the FSB expenditure exceeding the government’s estimate of Rs 1.25 lakh crore.”
Madan Sabnavis, chief economist at CARE Ratings: Rs. 1,15,000 crore a year
The implication will not be large. “Already the PDS is covering about 900 million people, which is nearly the same as estimated for the FSB. The government expenditure will go up from Rs 90,000 crore to Rs 1.15 lakh crore, which I do not feel is a big amount,” Sabnavis said.
Nutrition in India
The World Bank estimates that India is one of the highest-ranking countries in the world for the number of children suffering from malnutrition with the Prime Minister calling the matter a ‘national shame’. The prevalence of underweight children in India is among the highest in the world, and is nearly double that of Sub-Saharan Africa with dire consequences for mobility, mortality, productivity and economic growth. Between 2003 and 2007, the nutrition status of children under the age of 5 years was measured through data collected by the Demographic and Health Surveys (DHS) in 41 developing countries (the relevant DHS survey was conducted in India during the period 2005-06 – the third wave of the National Family and Health Survey). This DHS data revealed that the prevalence of underweight children in India was higher than in any of the other 40 countries. Moreover, the prevalence of underweight children in India was about twice as high as the average prevalence in the 26 sub-Saharan African countries for which data was collected by the DHS (NFHS 2009)
The social causes and health consequences of the growing prevalence of both over-nutrition as well as poor nutrition are a documented trend. Indicators for under-nutrition, however, are deeply controversial. The universality of WHO international indicators for stunted height and growth has been challenged by those who believe that Indian children might on average be genetically shorter and lighter than the reference population from which the World Health Organization (WHO) standards are derived. Therefore, using a uniform WHO-specified measure would overestimate the proportion of stunted and underweight children in India. Indeed, overestimating under-nutrition, it is argued, would also give us a skewed understanding of poverty. While there is no consensus on what poverty is and how it ought to be measured, child malnutrition is seen as reflective of desirable outcomes of development i.e. improvement in gender equality, intra-household distribution, and health environment quality whereas income levels tend to ignore more multi-dimensional aspects of poverty.
Measurement: WHO indicators
The debate about how to measure malnutrition and the validity of various methodologies has dominated a discussion of malnutrition in the country as, indeed, it builds the foundation for policy interventions and justifications for food subsidies. In order to begin, it would be important to provide a breakdown of what the WHO standard for measuring malnutrition actually is. In 2006, WHO came out with new child growth standards, which have been adopted by the Government of India. The new standards are based on properly fed children with no significant morbidity in Brazil, Ghana, India, Norway, Oman, and the United States. The new standards use the breastfed child as the normative model for growth and development. Compared to the old NCHS/WHO growth reference, the new WHO growth standards estimate that a higher proportion of children are stunted and wasted and a lower proportion are underweight. However, under both standards, the level of malnutrition in India is remarkably high (NFHS-3).
Health or nutritional status of a child is usually assessed in three ways: through measurement of growth and body composition (anthropometric indicators); through analysis of the biochemical content of blood and urine (biochemical indicators); and through clinical examination of external physical signs of nutrient deficiencies (clinical indicators). Among the three method of assessment, anthropometric measurement is a common and easy way to assess health and nutrition status. The other two methods are less practical because of the logistical difficulties and because data collection and analysis is expensive and time consuming.
Anthropometric indices are a combination of measurements related to body size and composition. At the individual level, anthropometry is used to assess the person as being in need of special interventions. In population, anthropometric data is used to make decisions about the need for intervention, what type of intervention is needed and to whom it should be delivered. To do the anthropometric measurement, four variables need to be collected: age, weight, height (or length of babies) and gender. Each of these variables provides one piece of information about a person. When they are used together, they can provide important information about the person’s nutritional status. When two of these variables are used together they form an index – there are three indexes that are commonly used in assessing the nutritional status: weight for age, height (length) for age, and weight for height (length). When these indexes are compared to a reference standard of anthropometry to assess the magnitude, distribution and severity of a nutritional problem in a country they are called an anthropometric indicator.
There are several possibilities of anthropometric classification by comparison with a reference population. Weight for age is often used to tell if a child is normal, overweight or underweight. When a child weighs less than expected for their age, they are underweight, and when they weigh more than they should for their age, they are overweight. Height (or length) is used to tell if a child is the normal height for his or her age. A child who is not as long or tall as expected may be stunted, meaning that a child did not grow to its full potential. Weight for height helps to identify children who are wasted, meaning that children do not weight as much as they should for their height. Underweight, stunting, and wasting, are the nutritional status conditions are concerned in anthropometric assessment.
A child is considered malnutrient if any of these indexes fall below refers two standard deviations (<-2SD) of the median value of the National Center for Health Statistics/World Health Organization (NCHS/WHO) international reference. Severe malnutrition is when the indexes fall below 3 SD of the median value. (ADB) A 2011 HUNGaMA (Hunger and Malnutrition) Survey conducted by young parliamentarians forming the Citizens’ Alliance against Malnutrition found that while nutrition has been improving in parts of the country, there is still a high rate of malnutrition across the board. The districts for the HUNGaMA survey were selected using the Child Development Index developed in 2009 by Indicus Analytics for UNICEF India. The HUNGaMA survey covers the 100 rural districts that ranked at the bottom of the Index (“Focus districts”), and 12 districts ranked near the top. These 12 top districts were selected to represent a spread of examples across India; six of them are the top ranking rural districts in the six states (one district per state) of the 100 focus districts; the remaining six are the top ranking rural districts in Himachal Pradesh, Kerala and Tamil Nadu (two districts per state), the three states whose rural districts led the all-India Index ranking. Findings of the survey showed that in the 100 focus districts, 42% of children under five are underweight while 59% are stunted (half of whom are severely stunted). In the best district in each of these states, the rates of underweight and stunting were significantly lower. It was also found that in the 100 focus districts, child underweight prevalence has decreased from 53% (as reported in the DLHS 2004) to 42%. The education level of the mother also seemed to determine the nutrition of the child, as rates of underweight and stunting were found to be significantly higher among mothers with low levels of education.
Nutritional security?
Studies have indicated a correlation between socio-economic status and over/under-nutrition. That is, the higher the socioeconomic status, the higher the tendency to be overweight, while the lower the socioeconomic status, the higher the tendency to be underweight. However, shifting nutritional, epidemiological and socioeconomic trends indicate that with an increasingly sedentary urban lifestyle and higher levels of urban migration, there is an increased fat and oil intake and a decreased protein and calorie intake across the socioeconomic spectrum (though to differing degrees). Inadequate intake of calories and protein leads to low weight, reduced muscle tissue, and (in children) slow growth. At the same time, increased fat/oil intake with an inactive lifestyle amongst the more affluent sections has led to an increase in over-nutrition.
Malnutrition refers to the situation where there is an unbalanced diet in which some nutrients are in excess, lacking or in wrong proportion. Malnutrition, with its two constituents of macronutrient (protein-energy malnutrition) and micronutrient deficiencies, continues to be a major health burden in developing countries. It is globally the most important risk factor for illness and death, with hundreds of millions of pregnant women and young children particularly affected. Apart from marasmus and kwashiorkor (the two forms of protein- energy malnutrition), deficiencies in iron, iodine, vitamin A and zinc are the main manifestations of malnutrition in developing countries (Muller and Krawinkel 2005). Besides deficiency of calories and protein (macronutrients), deficiency of micronutrients (that is, vitamins and minerals) is rampant. Micronutrient deficiency is referred to as ‘the hidden hunger’ as often times it is not an obvious killer or crippler, but extracts heavy human and economic cost.
National consumption trends of macronutrients (that is, calories and proteins) are discussed in the following section. Repeated diet surveys done by the National Nutrition Monitoring Bureau (NNMB) (National Institute of Nutrition, ICMR) in 9 states of India indicate that cereal-pulse based Indian diets are qualitatively deficient in micronutrients. Cereal-pulse diets particularly lack iron, calcium, vitamin A, riboflavin and folic acid, due to low intake of income-elastic protective foods such as pulses, vegetables particularly green leafy vegetables, fruits, and foods of animal origin. In recent years, there has been substantial decrease of area under cultivation of coarse grains and millets and share of these nutritious grains in total cereals produced and consumed. Apart from human suffering due to morbidity and mortality, malnutrition in general and micro-nutrient deficiencies in particular have a high economic cost. Productivity losses due to poor nutrition are estimated to be more than 10% of lifetime earnings for individuals, and 2-3 % of GDP to the nation. Cost of treating malnutrition is 27 times more than the investment required for its prevention. (INSA 2011)
Hence, while the FSB would play a significant role in preventing starvation, it would not necessarily lead to a diverse intake of micro/macronutrients and nutritional security while potentially skewing food production. On the other hand, it could free up existing income for the purchase of other foods, leading to a more diversified dietary intake.
Food consumption and production trends
Food production: supply responses to price incentives
An essential component of this must be considered: what is the cost of rebalancing nutrients to a healthy equilibrium? With price incentives having led to a domination of cereal production, dietary diversification and providing a nutrient-balanced meal may be growing increasingly difficult to afford. The impact of price-incentives (both input and output) on food production and market prices is a significant consideration in public policy initiatives. A study conducted by G. Mythili (IGIDR 2008) on pre- and post-reform acreage and yield of major crops maintains that farmers respond to market incentives not only by adjusting acreage but also by adjusting other inputs. The study notes that in order to model a supply response to price incentives, we must note first that farmers allocate land based on expected prices and secondly, that yield is determined based on other inputs and climate. Yield variable, she notes, is treated as a proxy for non-acreage inputs. Mythili considers both the influence of price-factors as well as non price factors such as the irrigation variable, rural literacy rate, and rainfall and yield risk.
Mythili’s study assumes that both area and yield are influenced by the expected output price. The idea of yield response to price is further supported by the literature that area alone might under-estimate the actual level of supply response. Farmers may display response by adopting better technology of production with no change in area or by using more or better quality of inputs which will change the output without changing the area. The intensive nature of cultivation will not be revealed by the input application alone, but will also be reflected in the quality of inputs and the timing and the method of application. Past studies have found that the rural literacy rate influences the choice of technology – hence, both irrigated area and the literacy rate are included as proxies for technology. A paper by Kanwar (2004) on crop-supply response, indicates that the supply response of Indian agriculture is influenced by the weather, input availability (specifically irrigation, and possibly fertiliser and HYVs), and prices, in that order.
The table below shows annual compound growth rates of Area, Production and Yield (APY) of major crops in India. The Green Revolution introduced high yielding varieties in wheat and rice in the 1960s, as represented in the table. It is shown that wheat production registered compound annual growth of 5.03% during the early green revolution period (1967-68, 1979-80) as both yield and area contributed to higher growth in production. In rice, growth in yield contributed to production growth of 1.84% per annum.

However, long-term growth rate (1967-68 to 2007-08) shows that only rapeseed, mustard and potato register productivity growth of more than 4% per annum. Other crops that show decent growth in production are wheat, cotton, sugarcane and rice. Long-term growth also shows that area shifts have been taking place from coarse cereals and pulses towards high-value crops like sugarcane, potato and the more remunerative oilseeds and fibres. In a paper on agricultural trends in India, Kannan and Sundaram recommend policy interventions to encourage production of pulses and coarse cereals (Kannan and Sundaram 2011). Due to high domestic demand of pulses and their volatile international market prices, the authors recommend that incentives be put to farmers to encourage growth. Most food grains received negative or low growth across the states (Andhra Pradesh, Himachal Pradesh, Madhya Pradesh, Maharashtra, Orissa, Tamil Nadu) implying that cross diversification is increasingly inclined towards commercial crops in these states, resulting in shrinkage of area under coarse cereals and small millets. Another suggestion by Vandana Shiva is to liberate the farmer and the government from costly chemical inputs and subsidies such as fertilizers, seeds, and pesticides. Lowering the costs of production through ecological agriculture, she argues, would not just improve the farmers’ livelihoods and food security but also the health and fertility of the soil, thus strengthening the ecological foundation for food security.
Indeed, through observation of APY data for cereals and non-cereals over the last several decades, there seems to be a distinct downward or stagnating trend in area and production of pulses and coarse cereals, while there is an upward trend in rice and wheat.
Prices of foods and consumption trends: fats, oils and protein
Shifting prices of foods have played a role in influencing national food consumption trends. Cereals are more affordable to those in the lower socioeconomic spectrum, while a varied diet (including proteins) is available to those in the higher socioeconomic groups. The share of cereals in household expenditure has fallen from 41% to 18% in rural India and from 23% to 10% in urban India from 1972-2005. Despite fall in expenditure, there has been a small increase in the cereal consumption of the lower income groups while in the middle and high income groups there has been some decline in cereal consumption. There has also been a change in the type of cereals consumed among the lowest income group. With the availability of wheat and rice through PDS the poorer segments of population have changed over to rice and wheat as staple cereals. Coarse cereals such as bajra, ragi, maize and jowar, which are rich in micronutrients and minerals, are no longer being consumed in substantial quantity by the lowest income group (Ramachandran 2007).
Over this period, the expenditure on pulses has remained more or less same in middle and higher income groups. However, due to rising costs of pulses, there has been a decline in pulse consumption in lower income groups. Greater dietary diversification comes with greater income, resulting in an increase in consumption of milk and animal products in higher income groups, and the converse in lower income groups. Among the poorer segments of the population, pulses remain the major source of protein and lower pulse consumption can result in further reduction in already low protein consumption. NSSO survey data also shows that there has been an increase in the per capita consumption of edible oil both in rural and urban areas. The growing consumption of empty calorie from oils, fats, sugar and beverages is a matter of concern, as they contribute to an increasing prevalence of over-nutrition, especially among the urban affluent segments of the population.
According to Ramachandran, poverty and lack of purchasing power have been identified as the two major factors responsible for the low dietary intake in India. Data from NSSO surveys indicate that overall calorie and protein intake in rural areas has shown a decline in the last three decades. Dietary intake in urban areas has remained unaltered. However, when the data is analysed by income, the calorie intake has shown a small increase in both urban and rural poor and a decline among the urban and rural rich. In spite of the fact that calorie intake has not increased, there is a rise in over-nutrition mainly because of changes in life style and consequent reduction in energy expenditure.
As mentioned earlier, there has been a substantial increase in the fat intake in both rural and urban areas over the last few decades. In view of adverse nutrition (obesity) and health implications of increased fat intake especially among the affluent group, this should be curtailed through appropriate nutrition education.
Public Distribution System
The Process
The Targeted Public Distribution System (TPDS) was launched in 1997 to benefit the poor and to alter the existing Public Distribution System by limiting budgetary food subsidies to those who needed it most. The objective of keeping the budgetary consumer subsidy in check was proposed to be met through sale of food grains to APL (Above Poverty Line) households at economic cost and confining the budgetary food subsidy to about sixty five million identified BPL (Below Poverty Line) families. Though the supply of the requisite quantity of food grains for distribution at BPL prices was to come from the Central Pool, the success of TPDS in terms of meeting its objectives depended largely on the ability of State Governments in identifying the genuine poor families, restricting the number of poor families to the number estimated by Planning Commission and in putting in place an effective and efficient delivery system.
The Public Distribution System (PDS) in India is implemented through process of procurement, storage, movement, distribution and sale of foodgrains. The flowchart below provides a useful understanding of these processes.
Measuring Outcomes
In accordance with the Planning Commission and the Ministry of Consumer Affairs, Food & Public Distribution, the Programme Evaluation Organisation conducted an evaluation of these processes in 2005. The results, however, show a bleak and painfully inefficient distribution system. A household–ration card mapping for each State was carried out to understand the mis-match between different types of households and ration cards. This exercise found that the implementation of TPDS is plagued by large Errors of Exclusion (of BPL families) and Inclusion (of APL), and by the prevalence of ghost BPL cards. Some States have issued more cards than the number of households, while some others have the problem of unidentified households. Leakages and diversions of a large part of subsidized grains imply lower share of the genuine BPL households. During 2003-04, the 16 large States were issued 14.07 million tonnes of BPL quota from the Central Pool. Of this, around 5.93 million tonnes was delivered to the BPL families and 8.14 million tonnes intended for them never reached them.
Overall, the study finds that about 58% of the subsidized food grains issued from the Central Pool do not reach the BPL families because of identification errors, nontransparent operation and unethical practices (such as ghost ration cards and diversions of food grains from the deserving demographic) in the implementation of TPDS. The cost of handling of food grains by public agencies is also suggested to be higher than other models of distribution. According to the study, for one rupee worth of income transfer to the poor, the Government of lndia spends Rs. 3.65, indicating that one rupee of budgetary consumer subsidy is worth only 27 paise to the poor.
However, a 2011 survey in 9 states (Andhra Pradesh, Bihar, Chhattisgarh, Jharkhand, Himachal Pradesh, Orissa, Rajasthan, Tamil Nadu and Uttar Pradesh) by R. Khera represents an improved level of inclusion. One of the major findings of the survey shows that for BPL and Antyodaya cardholders, there has been a marked improvement in the PER (the purchase-entitlement ratio – the proportion of full entitlement purchased by BPL households) across states. In a 2002 survey of 400 households in Rajasthan, Khera found that BPL households were buying only 12.6kg/month, 36% of their 35kg quota. In the PDS survey 2011, the corresponding figure for the Rajasthan sample was 85-91%. Average purchase in the past three months, across states, ranged between 24.0 and 30.4kg/month (for BPL and Antyodaya cards respectively). The average PDS purchase in the past three months was 84% of the monthly entitlement (28.7kg/household per month), on average. (Khera 2013)
PDS and Direct Benefit Transfers (also known as cash transfers)
The cash-transfer model has been suggested as an alternative to or as supplementary to the PDS. It is perhaps hasty to be generally for or against cash transfers – the questions arise when one considers what direct subsidies the cash transfer will be replacing and who will have greater or lesser access to these goods. The primary aim of the current Direct Benefit Transfer program is to bring transparency to the welfare process and attempt to curb excessive leakages. The Central Plan Scheme Monitoring System acts as the common platform for routing payments into the bank accounts of beneficiaries using the Aadhar Payment Bridge.
Svedberg (2012) outlines the case for and against the replacement of PDS with a targeted and differentiated cash-transfer scheme. The author argues that such a scheme could cover two-thirds of households and make far larger transfers to the poorest as compared to the actual subsidy embedded in the current system, eliminating the risk of large exclusion errors. Svedberg also argues that many of the reasons for opposing the CT scheme (such as exclusionary errors as a result of barely-universal UID) can be alleviated at the design stage. He outlines the case for CTs as the following:
- About two-thirds of all households can be covered,
- The transfers to the poorest are huge compared to the actual transfers embedded in the TPDS,
- The impact on income distribution is progressive,
- The risk of large exclusion errors is eliminated,
- The scope for corruption and fraud is diminished,
- Operational costs are slashed,
- No poverty lines,
- No central caps are required,
- Objections from the one-third of households left out would probably be muted as they may
- Prefer not to be brandished as poor, and the overall budget can be held at the level of the present TPDS.
On the other hand, an op-ed piece in The Hindu (2012) outlines a few reasons against replacing the PDS with the CT scheme. Firstly, subsidised food from the Public Distribution System (PDS) is a source of food and economic security for millions of poor families. In 2009-10, the article states, implicit transfers from the PDS wiped out about one-fifth of the “poverty gap” at the national level, and close to one-half of it in States like Tamil Nadu and Chhattisgarh. Secondly, the banking system in rural areas is not ready to handle large volumes of small transfers. Banks are often far and overcrowded. The alleged solution, banking correspondents, is fraught with problems. Post offices could possibly be converted into useful payment agencies, but this will take time. Thirdly, rural markets are often poorly developed. Dismantling the PDS would disrupt the flow of food across the country and put many people at the mercy of local traders and middlemen. Four, there are concerns of special groups such as single women, disabled persons and the elderly who cannot easily move around to withdraw their cash and buy food from distant markets.
Last but not least, the authors state that inflation could easily erode the purchasing power of cash transfers. “When the government refuses to index pensions or Mahatma Gandhi National Rural Employment Guarantee Act (NREGA) wages, how can it be trusted to index cash transfers to the price level?” Even if indexation does happen, small delays or gaps in price information could cause significant hardship for poor people.
Svedberg counters a few of the above arguments in his essay. Banking systems in rural areas, he notes, will not be necessary as with modern technology, money can be transferred through ordinary mobile phones. The most successful and well-known such scheme is the Kenyan M-PESA (mobile money in Swahili), which can be used for a variety of transactions. It was started in 2007 and as of April 2011, had 14 million subscribers (more than half the adult population). Similar schemes are under implementation in many countries, including India. In times of inflation, the solution would be to index the transfers to the real price of basic food items, which, he notes, “is technically simple, but politically sensitive”. Svedberg also notes that subsidised foodgrains means that households have the effortless and costless option to cut down on open-market purchases of grains and use the money thus freed to buy whatever they prefer.
State PDS reforms
State-level innovations within the PDS have worked from both the demand side as well as the supply side. Three demand-side policies are: a shift towards a more inclusive PDS, a reduction in state PDS prices below the issue prices prescribed by the Centre, and the provision of a more diversified range of food items through PDS outlets. All three have the effect of strengthening people’s stake in the PDS. In remedying supply-side issues, state departments have also implemented: management of PDS outlets, door-step delivery of grain, use of Information Technology (IT), instituting and enforcing a schedule for the opening of PDS outlets, and rationalizing official PDS commissions. (Khera 2013)
Proposed PDS reforms in the New Food Security Act
The Bill states that central and state governments “shall endeavour to progressively undertake” various PDS reforms, including: doorstep delivery of foodgrains; end-to-end computerisation; leveraging “aadhaar” (UID) for unique identification of entitled beneficiaries; full transparency of records; preference to public institutions or bodies in licensing of fair price shops; management of fair price shops by women or their collectives; diversification of commodities distributed under the PDS; full transparency of records; and “introducing schemes such as cash transfer, food coupons or other schemes to the targeted beneficiaries in order to ensure their foodgrain entitlements” as prescribed by the central government. (Dreze 2013)
The Bill also creates three categories of households – general, priority, and excluded – how will these three categories be identified efficiently? Will proposed mandatory reforms over-centralise the PDS, interfering with the several improvement state governments are are already implementing through their PDS? Will they detract from more inclusive PDS reforms in states by confining distribution to strict estimates of poverty?
References
Arnold, et al., NFHS-3, 2005-06: Nutrition in India, August 2009. International Institute for Population Studies: Mumbai.
Public Distribution System (PDS) in India – A Brief Overview, Association of Protection of Civil Rights.
Explanatory note: why we oppose the rush to cash transfers and UID, The Hindu. December 1st, 2012.
G. Mythili. 2008. Acreage and Yield Response for Major Crops in the Pre- and Post-Reform Periods in India . IGIDR: Mumbai.
The HUNGaMA Survey Report, 2011. Naandi Foundation.
Kanwar, Sunil. 2004. Price Incentives, Nonprice factors, and Crop Supply Response: The Indian Cash Crops. Centre for Development Economics: Delhi School of Economics.
Kannan and Sundaram. 2011. Analysis of trends in India’s agricultural growth. Institute for Social and Economic Change.
Khera, R. 2013. Food Security Act: One step forward, one step back?. IIT Delhi.
Müller O, Krawinkel M. 2005. Malnutrition and health in developing countries. Canadian Medical Association Journal (CMAJ) Aug 2; 173(3):279-86.
Performance Evaluation of Targeted Public Distribution System (TPDS) 2005. Planning Commission, Government of India, New Delhi
Setboonsarng, S. 2005. Child Malnutrition as a Poverty Indicator. Asian Development Bank.
Sharma, VK. 2011. An Economic Analysis of Food Consumption Pattern in India. International Referred Research Journal.
Svedberg, Peter. 2012. Reforming or Replacing the Public Distribution System with Cash Transfers?. Economic and Political Weekly, Vol xlvII no 7.
Ramachandran, P. 2008. Nutrition Transition in India 1947-2007. The Nutrition Foundation of India: India.
Rao, Veena S. 2011. India’s Malnutrition: A Multi-Sectoral Solution. Britannia Nutrition Foundation.
Indian National Science Academy, Micronutrient Security for India, 2011.
NSSO Data on Nutritional Intake in India 2007, Ministry of Statistics and Programme Implementation.
National Nutrition Monitoring Bureau (NNMB), Prevalence of micronutrient deficiencies; Technical report No.22, National Institute of Nutrition, ICMR, 2003
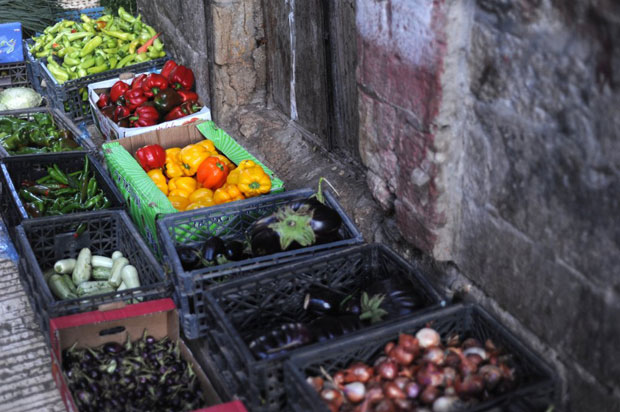
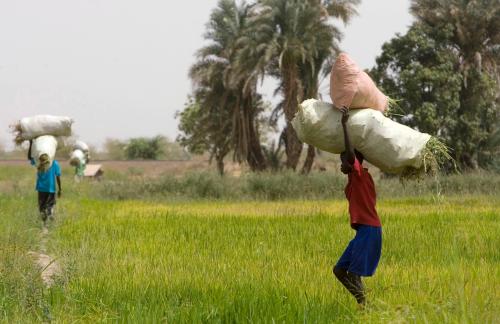
Photo by Guillaume Paumier
Related Content

Related Books