I. Introduction
With the passage of the American Taxpayer Relief Act of 2012 (in early January, 2013), many observers are claiming that fiscal issues have been, essentially, resolved and that the nation should move on to other issues. The February 2013 release of the Congressional Budget Office’s Budget and Economic Outlook provides an opportunity to re-examine these issues and to update our estimates (most recently, Auerbach and Gale 2012) of the fiscal status of the country.
Our overarching conclusion from this analysis is that, while the nation faces many other pressing economic and social issues – including boosting the strength and pace of the current recovery – we are still far from attaining a sustainable fiscal policy.
Several additional conclusions emerge as well. First, because ATRA instituted tax changes that had been widely expected, the official CBO (“current law”) baseline is now more reflective of plausible outcomes than it has been in the past, though alternative fiscal scenarios still seem more likely. Before ATRA, the differences between the current law and current policy baselines were so large that ATRA could be described as either a $600 billion tax increase (relative to a widely used current policy baseline) or a $4 trillion tax cut (relative to a current law baseline) (CBO 2013a). In practice, ATRA is widely regarded as a tax increase, because it raised taxes relative to a continuation of existing policies and because both political parties have an interest in making that case – the Democrats to show that they obtained a result that they had wanted, the Republicans to argue that no further tax increases are needed.
Second, unlike in long-term budget scenarios – where rising entitlement spending and, ultimately, health care spending is the single most important factor – there is no “smoking gun” in the 10-year projections. Mainly, there is “just” an overall continuing imbalance between spending and taxes. Revenue is not projected to collapse, as it did in 2009-12, but rather to grow to higher-than-historical-average levels. Spending isn’t spiraling out of control—it is projected at the same share of GDP in 2023 as it was in 2012, as large cuts in discretionary spending are offset by increases in mandatory spending and net interest rising to historically high levels.
Third, while we do not face an imminent budget crisis, the 10-year budget outlook remains tenuous. Even if seemingly everything goes right – in economic terms and in political terms – we still face the prospect of a dangerously high and rising debt-GDP ratio by the end of the next decade.
Fourth, the fiscal problems worsen after the next 10 years under all scenarios, with the debt/GDP ratio hitting 100 percent in 2029 and rising continually to 200 percent in 2049 under our current policy baseline (with projections of health care spending based on the Medicare Trustees latest report). Even under the most optimistic assumption about health care spending – that the recent slowdown in health care cost growth is assumed to be the start of a permanent slowdown – the long-term fiscal gap is on the order of 3-5 percent of GDP.
II. The 10-Year Budget Outlook
We provide three estimates of the 10-year outlook. The first estimate is simply CBO’s August 2012 baseline. The CBO baseline is typically referred to as a “current law” baseline. However, it differs from current law in at least three prominent ways. First, it assumes that the debt ceiling will be increased over time even if there are no enacted changes to tax and spending policies. Second, although it assumes that (almost all) temporary tax provisions are allowed to expire as scheduled under current law, it assumes that mandatory spending programs that are slated to expire are in fact continued.[1] Third, the baseline assumes that if dedicated trust funds – such as Medicare or OASDI – run out of money from which to pay scheduled benefits, that those scheduled benefits are paid anyway.[2]
The second approach, which CBO calls its alternative fiscal scenario, adjusts the baseline to reflect three factors. First, in their baseline, CBO assumes that all temporary tax provisions (other than excise taxes dedicated to trust funds) expire as scheduled. In their AFS, these provisions are assumed to be extended. Second, under current law, payments to physicians under Medicare are scheduled to decline by about 25 percent in January 2014. In every year since 2003, however, the Administration and Congress stepped in to postpone these reductions, adopting the so-called “doc fix.” The AFS assumes similar actions will prevail in the future and thus includes the cost of maintaining physician payment rates under Medicare at their current levels. Third, the current-law baseline assumes that the discretionary spending caps and sequestration procedures as imposed in the Budget Control Act of 2011 will be enforced. The AFS assumes that the original caps on discretionary appropriations set out in the Budget Control Act remain in effect, but that the automatic enforcement procedures of the legislation (sequestration in 2013 and lowered caps on discretionary budget authority) do not.
Our current policy scenario adjusts the AFS for two factors. First, based on CBO’s projections of scenarios not included in its official baseline (CBO 2013b, Table 1-6), we assume that war-related defense spending will fall steeply after 2012, resulting in a $582 billion reduction in defense spending relative to the CBO’s alternative defense baseline.
Second, we assume that the increase in disaster relief spending that occurred last year will not be permanent, whereas CBO’s baseline and AFS assume it is permanent. Both of our adjustments reduce future deficits relative to the AFS.
The general trends for deficits and debt under the three scenarios are reported in Table 1 and Figures 1 and 2. Under the current-law baseline, deficits fall from 5.5 percent of GDP currently to 2.7 percent in 2017, before rising to 3.8 by the end of the decade. Note that this projection assumes that the economy returns to full employment in 2017 and remains there throughout the remainder of the projection period. Under the AFS, the deficit falls to 3.8 percent by 2017 before rising to 5.0 percent by the end of the decade. Our current policy projections generate a deficit estimate of 4.4 percent by 2023. The debt-to-GDP ratio is project to fall slightly under all of the scenarios and then rise – to 77 percent under current law, 87 percent under the AFS and 82 percent under current policy.
We organize more detailed analysis of the 10-year outlook around 13 specific thoughts.
(1) The current-law baseline and current-policy baselines are much closer together than before.
With the passage of the American Taxpayer Relief Act of 2012, much of the difference between the current-law baseline and various current policy scenarios has disappeared. Whereas the January 2012 Outlook showed a $7.9 trillion difference in the 10-year budget totals between current law and what CBO calls their alternative fiscal scenario, the February 2013 Outlook shows only a $2.5 trillion difference. Nearly all of this narrowing comes from the permanent adoption of several long-standing but temporary tax policies.
(2) Debt/GDP is projected to be high over the next decade.
Debt as a share of the economy will rise from 73 percent in 2012 to 77 percent in 2023 under current law. Debt rises to 87 percent of GDP under CBO’s alternative fiscal scenario and 83 percent under current policy. These levels are high compared to past experience: from 1957 to 2007, the ratio did not exceed 50 percent and averaged just 37 percent of GDP. Relative to the magnitude of historical shifts in the ratio and the doubling of the ratio since 2007, the debt/GDP ratio is essentially projected to stabilize at a new, higher level over the next 10 years under the current-law baseline.
(3) Total spending is projected to be about the same share of the economy in 2023 as it is in 2012.
Total spending was 22.8 percent of GDP in 2012, and is projected to fall to 22.2 percent in 2013 and to 21.5 percent in 2017, before rising to 22.9 percent by 2023 under current law. Under current policy, total spending will rise slightly over the decade, to 23.1 percent of GDP.
(4) Net interest payments are projected to rise to unprecedented levels.
Net interest payments rise from 1.4 percent of GDP in 2012 to 3.3 percent in 2023 under current law. The projected rise is due to the increase in the debt/GDP levels in recent years, coupled with an expected rise in interest rates as the economy returns to full employment. The projected rise in interest rates is particularly notable given both the low levels of current interest rates and the magnitude of the projected changes. The three-month Treasury bill rate rises to 4.0 percent in 2023 compared to 0.1 percent in 2012. The 10-year Treasury note rate rises to 5.2 percent in 2023 compared to 1.8 percent in 2012. Various measures of the inflation rate are expected to rise by 0.5 percentage points over the same period, so almost all of the projected increases represent higher real interest rates.
Net interest payments would rise to 3.5 percent of GDP under the current policy baseline and 3.7 percent of GDP under CBO’s alternative fiscal scenario. These are extremely high levels relative to the past. Net interest payments previously peaked at 3.3 percent of GDP in 1991.
(5) Non-interest spending is projected to fall significantly.
In 2012, non-interest spending was 21.4 percent of GDP. Under current law, this figure is projected to fall to 19.2 percent by 2018. By 2023 it rises slightly to 19.6 percent, but still remains 1.8 percentage points of GDP lower than the 2012 level. Under current policy, non-interest spending is also at 19.6 percent of GDP in 2023. This is a higher spending level than the historical average. From 1957 to 2008, non-interest spending averaged about 18.1 percent of GDP.
(6) The decline in non-interest spending is due to dramatic declines in discretionary spending, including both the defense and non-defense portions.
The projected decrease in discretionary spending is due to the Budget Control Act of 2011. The legislation instituted caps on discretionary spending that would, by itself, reduce discretionary spending to its lowest share of the economy since records separate records were kept in 1962 (see Alternative Fiscal Scenario data). The legislation also instituted, in the absence of further deficit reduction, a broad-based sequester of federal spending – mainly discretionary –that would drive down discretionary spending even further.
Under current law, discretionary spending will decrease from 8.3 percent of GDP in 2012 to 5.5 percent in 2023. Defense spending is projected to fall from 4.3 percent of GDP to 2.8 percent in 2023. Non-defense discretionary spending is projected to fall from 4.0 percent of GDP in 2012 to 2.7 percent of GDP in 2023. Under the current policy baseline, total discretionary spending decreases to 5.3 percent of GDP by 2023.
All of these shares are remarkably low relative to historical figures. Between 1962 and 2012, the lowest discretionary spending level as a share of GDP occurred in 1999, at 6.2 percent.
(7) Mandatory spending rises, but slower cost growth is projected for Medicare and Medicaid.
Mandatory spending is projected to rise from 13.1 percent of GDP in 2012 to 14.1 percent in 2022 and 2023. This is a slightly lower than CBO’s projection last year for 2022, which was 14.3 percent. The lower mandatory spending is due to slower projected cost growth in Medicare and Medicaid. Last year, CBO expected Medicare and Medicaid to account for about 6.7 percent of GDP in 2022; this year it projects these programs to be 6.3 percent of GDP in 2022. CBO’s projections for income security outlays and other mandatory outlays increased by 0.2 percentage points of GDP to partially offset the projected decrease in Medicare and Medicaid growth (CBO 2013c).
(8) Revenues are not only projected to recover from extremely low levels in recent years, but to rise significantly to above average historical levels.
Due to the recession and slow recovery, as well as tax policy choices, federal revenues have been at historic lows, less than 16 percent of GDP, since 2009, representing the lowest share of GDP in more than 60 years. As the economy recovers, and ATRA and surtaxes adopted under the Affordable Care Act (ACA) kick in, CBO projects revenue will rise to 19.1 percent of GDP by 2015 and remain close to that level for the rest of the decade.
Receipts averaged 18.0 percent of GDP from 1957 to 2007, and have exceeded 19 percent of GDP only eight times since 1957. Five of these years were during the 1990s at the end of the Clinton administration when real economic growth was particularly strong and income taxes surged with the growth in income at the high end of the income distribution. The assumed extension of temporary tax policies in CBO’s alternative fiscal scenario and in the current policy baseline reduce revenue levels to about 18.7 percent of GDP in 2023.
(9) Income tax revenues are projected to grow steadily and stay high
Revenues from the individual income tax are projected to rise steadily through the decade, reaching 9.8 percent of GDP by 2023 under current law. The only years the income tax has ever raised at least 9 percent of GDP in revenue were 1944 (at the height of the war), 1969 (the income tax surtax), 1980-82 (leading to the Reagan tax cuts) and 1997-2001 (leading to the Bush tax cuts in 2001 and 2003). The current law baseline, though, projects income tax revenues will reach 9.1 percent of GDP in 2017 and rise gradually to 9.8 percent by 2023.
It is not immediately clear how much extension of temporary tax policies would reduce income tax receipts (as opposed to other receipts), but the total revenue loss is 0.4 percent of GDP, so even if the entire loss occurred in the income tax, revenues from that source would still be high relative to levels that have been viable politically in the past.
(10) The projected growth rate of potential output has fallen.
CBO has lowered its projection of the growth rate for potential output to 2.3 percent, down from 2.5 percent last year. Declines in the growth rate will generally hurt the budget outlook.[3]
(11) Even if economic trends and political actions go well from the perspective of fiscal sustainability, the nation will face high levels of debt over the next 10 years. For example, under the current law baseline:
- Revenues average almost 19 percent of GDP as projected from 2015 through 2023 (a level higher than revenues in all but 5 years since 1982),
- Revenues from the personal income tax rise steadily to 9.8 percent of GDP in 2023 (a figured exceeded only once in U.S. history),
- Defense spending falls to its lowest share of the economy since before WWII,
- Non-defense discretionary spending falls to its lowest share of the economy since before separate records were kept starting in 1962,
- Significant reductions in projected health care cost growth pan out as projected, and
- The economy returns to full employment in 2017 as scheduled and remains there without recession through 2023.
Nevertheless, the implications of those favorable trends would be that:
- Net interest payments will rise from 1.4 percent of GDP in 2012 to 3.3 percent in 2023 (tied for the highest level in history and a sign of approaching fiscal unsustainability),
- The full-employment deficit would reach 3.8 percent of GDP in 2022 and 2023 (other than in the 2009-12 period, these would be the highest levels except for four of the past 50 years).
- The debt/GDP ratio would be 77 percent by 2023. The ratio would be more than 20 percentage points higher in every year during the next decade than it was for any year between 1957 and 2007, and it would be more than double the 37 percent level it averaged during the 1957-2007 period.
Under CBO’s alternative fiscal policy baseline or our own measures of a current policy baseline, all of the budget projections are worse.
(12) How much would it take?
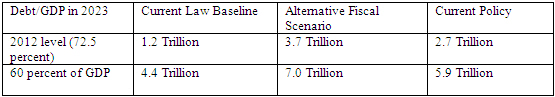
Under the current law baseline, it would take a cumulative $1.2 trillion of additional changes (revenue increases, non-interest spending cuts, and associated interest savings) to obtain in 2023 the 2012 debt/GDP ratio of 72.5 percent. It would take $4.4 trillion in budget cuts to get the 2023 debt/GDP ratio down to 60 percent, the target proposed by the Peterson-Pew (2010), Domenici-Rivlin (Debt Reduction Task Force 2010) and Bowles-Simpson (National Commission on Fiscal Responsibility and Reform 2010) commissions. These numbers are significantly larger under the alternative fiscal scenario and current policy baselines:
For purposes of comparison, it is worth noting that CBO projects that GDP will total $213 trillion over the 2014-2023 period.
(13) The debt-GDP ratio is projected to be rising at the end of the decade, under all three scenarios
Under the CBO baseline, the debt-GDP ratio rises by 4 percentage points from 2018 to 2023. Under the AFS, the increase exceeds 8 percentage points over the same period. Under the current policy baseline, the ratio rises by more than 6 percentage points over the last five years of the projection period. All of these increases occur despite the projection that the economy will be at full employment during this period. These trends hint at the unsustainability of the fiscal situation and the need for longer-term analysis.
III. The Long-Term Outlook
The fiscal gap is an accounting measure that is intended to reflect the long-term budgetary status of the government.[4] As developed by Auerbach (1994) and implemented in many subsequent analyses, the fiscal gap measures the size of the immediate and permanent increase in taxes and/or reductions in non-interest expenditures that would be required to set the present value of all future primary surpluses equal to the current value of the national debt, where the primary surplus is the difference between revenues and non-interest expenditures.[5] Equivalently, it would establish the same debt-to-GDP ratio in the long run as holds currently.
A. Initial Assumptions
We develop three sets of long-term estimates, corresponding to the three 10-year projections above. For years after 2023, for which no official baseline is available, we choose assumptions and, where available, projections for different components of taxes and spending. We assume that, after 2023, most categories of spending and revenues remain constant as a share of GDP. These long-run assumptions, however, would be seriously misleading for the major entitlement programs and their associated sources of funding, for which recent long-term projections are available. For the Medicare and OASDI programs, projections for all elements of spending and dedicated revenues (payroll taxes, income taxes on benefits, premiums and contributions from states) are available or can be calculated from figures presented for the intermediate projections in the 2012 Trustees reports.[6]
For our base case, Social Security spending, Medicare spending, and payroll taxes follow the growth rates assumed in the Trustees’ projections of the ratios of taxes and spending to GDP for the period 2020–2090 for OASDI and 2020–2080 for Medicare, assuming that these ratios are constant at their terminal values thereafter. (As discussed below, we also consider alternative projections for Medicare provided by the Medicare actuary and the CBO, both more pessimistic than the official Trustees’ projections and we consider different ways of incorporating the recent slowdown in health care spending into the long-term estimates.) For Medicaid, CHIP, and exchange subsidies, we use growth rates implied by CBO’s most recent long-term projections (CBO 2012a) through 2087 and assume that spending as a share of GDP is constant thereafter.[7]
It is important to understand how to interpret these assumptions. They do not represent a pure projection of current law but instead assume that policymakers will make a number of future policy changes, including a continual series of tax cuts, discretionary spending increases, and adjustments to keep health spending from growing too quickly. For example, if current tax parameters were extended forward, income taxes would rise as a share of GDP. Our forecast implicitly assumes policymakers will cut taxes in response. Conversely, our forecast assumes that a richer society will want to spend more on discretionary spending, going beyond the current services provided by government. Kamin (2012) provides additional perspective on these assumptions.
We provide six different projections of Medicare spending. The intermediate projections of the Medicare Trustees have for many years incorporated the assumption that Medicare growth will eventually slow in the future. Starting in the 2010 report, however, the Trustees’ official medical projections have assumed a much stronger slowdown, as a consequence of provisions in the ACA. These assumptions, though they may be consistent with the impact of the bill’s provisions should they remain in force over the long term, are controversial, for the sustainability of such spending reductions is not clear. Reflecting this controversy, the Medicare Actuary has, since 2010, released a separate set of projections (CMS Office of the Actuary 2012) showing less optimistic (although still positive) reductions in spending. CBO’s Alternative long-fiscal scenario (2012) provides a third, and more pessimistic projected path of Medicare spending.[8]
We provide long-term calculations for each of these three projected paths of the projected growth in health care spending, starting from CBO’s 2023 baseline projection. Also, for each of these three paths, we provide estimates that incorporate an additional permanent slowdown in the growth rate. CBO (2013c) noted that lower-than-expected health care spending growth rates had caused it to revise down its federal health spending assumptions. We provide simulations where the health care growth rates in each of the three scenarios mentioned above is permanently lower by 0.5 percentage points to reflect the continuation of the recent slow-down, not only through the 10-year window but for the long-term.
B. Estimates
Table 2 displays calculations of the long-term fiscal gap, in two panels corresponding whether the near-term projected reductions in health care spending growth are assumed to be temporary (upper panel) or permanent (lower panel). For each option, we show three variants according to the source of post-2023 Medicare projections — the Medicare Trustees, the Medicare Actuary, and CBO’s Alternative scenario. For each combination of 10-year baseline and long-term Medicare projections, we show the fiscal gap over two horizons: through 2089, and over the infinite horizon. We begin by discussing the various baselines that rely on the most optimistic Medicare projections, those in the official Trustees report, shown in the top row of the table.
Under the CBO baseline assumptions, we estimate that the fiscal gap through 2089 is now 3.51 percent of GDP (Table 2).[9] This implies that an immediate and permanent increase in taxes or cut in spending of 3.51percent of GDP — roughly $560 billion per year in current terms — would be needed to maintain fiscal balance through 2089. In present-value dollars, rather than as a share of GDP, the fiscal gap through 2089 under these assumptions amounts to $35.1 trillion. The fiscal gap is even larger if the time horizon is extended, since the budget is projected to be running substantial deficits in years approaching and after 2089. If the horizon is extended indefinitely, for example, the fiscal gap rises to 4.40 percent of GDP under the CBO baseline, or $82.9 trillion.
The fiscal gaps under the CBO’s alternative fiscal scenario are about 0.9 percentage points of GDP larger than the baseline scenario. Recall that this scenario has lower revenues because it assumes that the Congress will continue to renew the “tax extenders” and will renew certain tax provisions that expire in 2018. It also assumes higher spending as the sequestration is rescinded and the Medicare provider payment cuts are continually delayed. Through 2089, the fiscal gap is 4.42 percent of GDP, or $44.2 trillion. The fiscal imbalance over the infinite horizon is 5.32 percent of GDP. In present-value dollars, the gap exceeds $100.2 trillion.
Under extended policy, the fiscal gap lies between the CBO’s two scenarios. This scenario differs from the CBO’s alternative fiscal scenario because the higher spending assumptions are almost offset by the drawdown in war spending and eliminating the disaster relief spending that is extrapolated in discretionary spending. Under extended policy, the fiscal gap through 2089 amounts to 3.97 percent of GDP, or 0.5 percent of GDP more than under the CBO baseline. In present-value dollars, the fiscal gap under this scenario almost reached $39.7 trillion through 2089. Over the infinite horizon, the fiscal gap under the extended policy baseline is 4.86 percent of GDP, or $91.6 trillion.
In the second row, we see the impact of using the projections offered separately by the Medicare Actuary. Doing so raises the fiscal gap by about 1.0 percent of GDP through 2089 and around 1.7 percent of GDP under an infinite horizon. For example, under the scenario based on the CBO baseline, the fiscal gap rises to 4.47 percent of GDP through 2089 and 6.09 percent of GDP under an infinite horizon.
The third set of projections for Medicare spending, from the Alternative Fiscal Scenario in CBO’s long-term budget outlook (2012a), are the most pessimistic we consider and are shown in the third row of Table 2. These projections raise the gap by about an additional 0.3 percent of GDP through 2089 and 0.7 percent of GDP over the infinite horizon, compared to the Medicare Actuary projections. As a result, the permanent fiscal gap is 4.74 percent of GDP under the CBO baseline scenario, 5.67 percent of GDP under CBO’s alternative fiscal scenario, and 7.34 percent of GDP under the extended policy scenario.
The fourth through sixth rows of Table 2 show the fiscal gap projections if the CBO’s downward revision of health care spending growth is continued throughout the long-term horizon. Between the August Update (CBO 2012b) and the February Outlook (CBO 2013b), the CBO revised down the growth rates for Medicare and Medicaid, CHIP, and insurance subsidies by about 0.5 percentage points. If this slowdown is continued beyond 2023, the fiscal gaps through 2089 for the Medicare Trustees health assumptions are lower by about 1 percent of GDP. The fiscal gaps for health spending assumptions under both the CMS Actuary and the CBO’s Alternative Medicare decrease by about 1.2 percentage points each.
Although the fiscal gap is still positive and substantial, our estimates of the gap are considerably smaller than a few years ago, due to the passage of the Budget Control Act in 2011, the American Taxpayer Relief Act of 2012, the recent and projected slowdown in health care cost growth and other factors. For example, our estimates of the permanent fiscal gap – under current policy and under the Medicare Trustees’ projected spending – fell from 6.5 percent of GDP in 2011 before the Budget Control Act (Auerbach and Gale 2011a), to 5.9 percent of GDP in 2011 after the Budget Control Act (Auerbach and Gale 2011b), and then fell to 4.9 percent of GDP in the current estimate if the recent health care cost growth slowdown is assumed to last for 10 years, and to 3.1 percent of GDP in the current estimate if the recent cost growth slowdown is assumed to be permanent.
Figure 3 shows projected revenues and non-interest expenditures through 2089 under two “bracketing” scenarios: the most optimistic scenario (CBO 10-year baseline, Medicare Trustees health spending assumptions permanently modified by the CBO’s health revision) and the most pessimistic scenario (CBO’s alternative fiscal scenario and the CBO Alternative Medicare assumptions with the lower health spending growth only lasting through 2023). Under the former, non-interest outlays will keep rising and will reach 21.1 percent of GDP by 2089 – higher than the 19.0 percent of revenue projected for that year under the scenario. Under the pessimistic scenario, revenue will be lower — at 18.6 percent of GDP, much closer to its historical share — and non-interest outlays will exceed 28 percent of GDP by 2089. Thus, even using the most optimistic projections for both the short term and the long term, the current gap between spending and revenues persists far into the future.
Figure 4 shows the implied debt-to-GDP ratios under the most optimistic and most pessimistic projections. Under the first set, the economy would pass its highest-ever debt-to-GDP ratio (108.6 percent, in 1946) by 2035. This benchmark would be passed six years sooner (around 2029) under the more pessimistic scenario. In both cases, the following years would see additional growth in the debt-to-GDP ratio. Indeed, even the projected debt-to-GDP ratios under the most optimistic scenario would rise to 360 percent of GDP, an astronomical and unsustainable level.
Although not shown in the table, delaying the implementation of a fiscal solution will increase the fiscal gap and thus make it harder to assure the nation’s fiscal future. If Congress cannot reach compromise and implement a solution until 2018 — that is, when CBO projects the economy to return to full employment — the estimated permanent fiscal gaps for the most optimistic and pessimistic scenario rises to 2.82 percent and 8.15 percent of GDP, respectively, or 0.13 and 0.36 percentage points of GDP more than if fiscal adjustment were implemented immediately. Although gradual or slightly delayed implementation may be preferable in light of a still-struggling recovery, the decision to delay should be made actively with full awareness that the necessary fiscal adjustment will then be larger and will require more difficult sacrifices, rather than passively acquiescing to inertia and recent political impasses. And if a solution is not implemented for 10 years (i.e., not until 2023), the estimated permanent fiscal gaps for the most optimistic and pessimistic scenarios will be about 0.27 and 0.77 percent of GDP larger than shown in Table 2.
IV. Conclusions
Recent legislative changes – including the Budget Control Act of 2011 and the American Taxpayer Relief Act of 2012 – along with recent and projected slowdowns in the growth rate of health care spending have helped improve the nation’s medium-term and long-term budget picture. But the country was starting from a position of a substantial fiscal gap, and so while the recent improvements have helped shave part of the problem away, there is still a long way to go. Moreover, even as current-period deficits fall to less atypical historical levels from the enormous levels that persisted in 2009-11, the nation now must carry a debt load that is twice as large as its historical average and makes budget outcomes much more sensitive to interest rates.
Under even the most optimistic scenario, the necessary adjustments must be several times the size of those adopted under the recent legislation. The changes needed relate much more to medium- and long-term deficits, rather than the short-term deficits, which to a considerable extent still reflect the weakness of the economy. Moreover, cuts in discretionary spending alone will not suffice if substantial progress is to be made; changes to entitlement spending and to tax revenues will be needed to close the gap.
List of References
Auerbach, Alan J. 1994. “The U.S. Fiscal Problem: Where We Are, How We Got Here, and Where We’re Going.” In National Bureau of Economic Research Macroeconomics Annual 1994, Volume 9, edited by Stanley Fischer and Julio Rotemberg, 141–175. Cambridge, MA: MIT Press.
Auerbach, Alan J. 1997. “Quantifying the Current U.S. Fiscal Imbalance.” National Tax Journal 50 (3): 387–98.
Auerbach, Alan J., William G. Gale, Peter R. Orszag, and Samara Potter, 2003. “Budget Blues: The Fiscal Outlook and Options for Reform.” In Aaron, Henry J., James Lindsay, and Pietro Nivola (eds.), Agenda for the Nation, 109–143. Brookings Institution, Washington, DC.
Auerbach, Alan J., and William G. Gale. 2011a. “Tempting Fate: The Federal Budget Outlook.” Tax Notes 132 (4): 375-88.
Auerbach, Alan J., and William G. Gale. 2011b. “(Still) Tempting Fate.” Brookings Institution, Washington, DC.
Auerbach, Alan J., and William G. Gale. 2012. “The Federal Budget Outlook: No News is Bad News.” Tax Notes 136 (13): 1597-1607.
Board of Trustees, Federal Old-Age and Survivors Insurance and Disability Insurance Trust Funds. 2012. The 2012 Annual Report of the Board of Trustees of the Federal Old-Age and Survivors Insurance and Federal Disability Insurance Trust Funds. Federal Old-Age and Survivors Insurance and Disability Insurance Trust Funds, Washington, DC.
CMS Office of the Actuary. 2012. Projected Medicare Expenditures under an Illustrative Scenario with Alternative Payment Updates to Medicare Providers. Centers for Medicare and Medicaid Services, Baltimore, MD.
Congressional Budget Office. 2010. Social Security Policy Options. Congressional Budget Office. Washington, DC.
Congressional Budget Office. 2012a. The Long-Term Budget Outlook. Congressional Budget Office, Washington, DC.
Congressional Budget Office. 2012b. An Update to the Budget and Economic Outlook: Fiscal Years 2012 to 2022. Congressional Budget Office, Washington, DC.
Congressional Budget Office. 2013a. “The “Fiscal Cliff” Deal.” Blog Post. Available at: <http://cbo.gov/publication/43835>
Congressional Budget Office. 2013b. The Budget and Economic Outlook: Fiscal Years 2013 to 2023. Congressional Budget Office. Washington, DC.
Congressional Budget Office. 2013c. “How Have CBO’s Projections of Spending for Medicare and Medicaid Changed Since the August 2012 Baseline?” Blog Post. Available at: <http://cbo.gov/publication/43835>
Debt Reduction Task Force. 2010. “Restoring America’s Future: Reviving the Economy, Cutting Spending and Debt, and Creating a Simple, Pro-Growth Tax System.” Senator Pete Domenici and Dr. Alice Rivlin, Bipartisan Policy Center.
Kamin, David. 2012. “Are We There Yet?: On a Path to Closing America’s Long-Run Deficit.” Tax Notes 137 (3): 53-70.
National Commission on Fiscal Responsibility and Reform. 2010. “The Moment of Truth: Report of the National Commission on Fiscal Responsibility and Reform.”
Peterson-Pew Commission on Budget Reform. 2010. “Getting Back in the Black.”
[1] CBO is instructed to assume that most mandatory programs that are slated expire during the budget window will persist throughout the entire projection period. CBO (2013b) reports that the baseline includes $1,234 billion in outlays, not including debt service costs, for mandatory spending programs that are assumed to be extended beyond their expiration dates. CBO is also instructed to assume the continuation of excise taxes that are dedicated to trust funds, even if they are scheduled to expire within the projection period.
[2] See CBO (2010, footnote 11), which states “CBO prepares cost estimates for legislation under the assumption that scheduled payments will be made, which is consistent with a long-standing statutory requirement that CBO, in its baseline projections, assume that laws are implemented as specified and that funding for entitlement programs is adequate to make all payments. See section 257 of the Balanced Budget and Emergency Deficit Control Act of 1985, Public Law 99-177, as amended”; 2 U.S.C. 907.
[3] However, our current long-term growth projections use figures from the Social Security Administration’s 2012 Trustees Report, issued prior to CBO’s reduction in the projected long-term growth rate. This suggests that our long-term estimates may prove to be too optimistic.
[4] Auerbach et al. (2003) discuss the relationship between the fiscal gap, generational accounting, accrual accounting and other ways of accounting for government.
[5] Over an infinite planning horizon, this requirement is equivalent to assuming that the debt-to-GDP ratio does not explode (Auerbach 1994, 1997). For the current value of the national debt, we use publicly-held debt. As discussed above, an alternative might be to subtract government financial assets from this debt measure, but the impact on our long-term calculations would be small (reducing the fiscal gaps reported in Table 3 by less than 0.1 percent of GDP).
[6] Details of these computations are available from the authors upon request. The 2012 Medicare Trustees Report is at http://www.cms.gov/ReportsTrustFunds/downloads/tr2012.pdf. The 2012 OASDI Trustees Report is at http://www.ssa.gov/OACT/TR/2012/tr2012.pdf.
[7] CBO projects two scenarios for spending and revenues, which it refers to as its “Extended-Baseline” and “Alternative” scenarios. For federal spending on Medicaid, CHIP and exchange subsidies, these two scenarios are relatively similar, differing by about 0.4 percent of GDP in 2089. We use the higher of these two sets of projections, the Alternative scenario, to be consistent with our use of the Medicare projections from this scenario as one of the cases we will consider below.
[8] The Medicare projections under CBO’s more optimistic Extended-Baseline scenario yield estimates of the long-term gap that are similar over the infinite horizon to those based on the CMS Actuary’s projections.
[9] The discount rate in these calculations is based, for 2023 onward, upon the intermediate assumptions of the Social Security Trustees, which include a nominal interest rate of about 5.7 percent. For the first 10 years of the calculation, through 2023, we use a blend of the CBO forecasts of the ten-year and 3-month Treasury rates that roughly replicates the debt accumulation pattern under the CBO baseline.


Related Content


Related Books


Authors