
Executive summary
In the United States, public policy and expenditure intended to improve the prospects of children from low-income families have focused on better preparing children for school through Head Start and universal pre-K. This school readiness approach differs from the dominant model of public support for early care and learning in Northern Europe, which places more emphasis on supporting families. It also differs from other government programs in the U.S., such as the Earned Income Tax Credit, that support low-income parents of young children by boosting income. Empirical comparisons of the impact on school achievement of boosting family income vs. providing free pre-K for four-year-olds, summarized in this paper, suggest that supporting family income is a more cost effective expenditure. A policy midpoint between more money for families vs. more money for pre-K is more money for families to spend on their young children. All these policy options should be on the table and subject to test as the nation moves towards increased attention to and investment in the early years.
The dominant focus on school readiness
Federal spending on programs to support children’s early learning and care, including through Head Start and the Child Care and Development Block Grant program, amounts to roughly $22 billion a year. Several billion more is spent by states from their own tax revenues. Some large urban school districts, including New York City and Boston, are spending their own funds on universal pre-K programs. The Obama administration has proposed in its last two budgets the addition of $12 billion in annual federal and state expenditures for a federal/state partnership called Preschool for All.
Public expenditures on early childhood programs are nearly always justified as investments that will eliminate socioeconomic and racial gaps in school readiness and elevate subsequent student achievement and life success.
The purpose of Head Start as defined in the Head Start Act:
“to promote the school readiness of low-income children by enhancing their cognitive, social, and emotional development”[i]
President Obama’s rationale for new spending on early childhood programs:
“Every dollar we invest in high-quality early childhood education can save more than seven dollars later on—by boosting graduation rates, reducing teen pregnancy, even reducing violent crime. In states that make it a priority to educate our youngest children, like Georgia or Oklahoma, studies show students grow up more likely to read and do math at grade level, graduate high school, hold a job, form more stable families of their own. We know this works. So let’s do what works and make sure none of our children start the race of life already behind. Let’s give our kids that chance.”[ii]
New York Mayor Bill de Blasio on the purpose of his administration’s signature universal preschool initiative:
“Full-day pre-K is the cornerstone of the de Blasio administration’s plan to transform public education in New York City…high-quality pre-K represents change at a scale that will raise achievement and reduce inequality across all communities.”[iii]
Presidential candidate Hillary Clinton on preschool:
“One of the best investments we can make as a nation is to give our kids the ingredients they need to develop in the first five years of life. We will help bring together the tools that will give children the chance to succeed by the time they’re five, so that when those kids get to school, they’re able to compete, they are more able to pursue their own dreams.” [iv]
There are consequences, intended and not, of defining the purpose of spending on early childhood almost entirely in terms of school readiness. Among them are a focus within preschool programs on teaching pre-academic skills; the conceptualization of the role of the adults who provide center-based care as that of a teacher; a bias towards delivering pre-K services through school districts; a press towards common standards and curriculum across pre-K providers; accountability regimens that are tied to children’s performance on measures that correlate with later school success; disproportionate spending on four-year-olds as opposed to younger children; and marginalization of the family’s responsibility. In general, just as kindergarten became the new first grade in a previous era, we now see pre-K becoming the new kindergarten with all that implies for curriculum, staffing, funding, and aegis.
Family support as an alternative
There are other models of public support for young children but they have been lost in the preoccupation in the U.S. with school readiness and its corollary: using center-based programs for four-year-olds to make up for what are viewed as deficiencies in parenting among low-income and minority parents that leave too many children behind at the start of formal schooling.
Consider, in contrast, the mission of the Danish childcare system, which is similar to most of the state systems in Northern Europe:
“Danish child and family policy is based on the overall principle that the family is the foundation of a child’s upbringing and that the living conditions of children are mainly the responsibility of their parents. Public authorities have an overall responsibility for providing a good social framework and for providing the best possible conditions for families with children. In addition, public authorities must protect children and young people against abuse and neglect, and they must offer advice and guidance to parents so that the parents will be able to meet their parental obligations and responsibilities.”[v]
This is a fundamentally different framing of the state’s responsibility for young children than illustrated in the quotes above from U.S. law and high officials. It too has consequences, intended and not. Among them are the goal of providing care based on the needs of parents, which means proportionate spending across the early childhood years; the availability of care that is responsive to the working hours of parents; and a requirement that initiatives taken in relation to individual children must be agreed to by the parents (which reinforces the importance in the Danish model of parents having the overall responsibility for the development of their children).
One can look elsewhere in Northern Europe for interesting variations on the general model outlined for Denmark. In Finland, for example, working parents of young children can choose from a variety of providers. They can also opt to receive a financial subsidy that allows them to reduce their work hours in order to be home more with their child. They can also take unpaid leave.[vi] Perhaps as a result, Finland has one of the lowest rates in Northern Europe of enrollment of children under four years of age in center-based care—it is less than half of that in Denmark and much lower even than in the U.S.[vii]
My point is not that the U.S. should adopt European models of early child care. Rather, it is that there are other ways to spend as much or more public funds on early education and child care than under the dominant school readiness model. Those policy counterfactuals should be on the table and subjected to thoughtful consideration as the nation is poised to increase attention to and investment in early childhood programs.
One way to broadly categorize the policy choice is family support vs. school readiness. This a matter of emphasis rather than mutual exclusivity. In other words, expenditures that have a primary goal of strengthening and supporting families in carrying out their responsibilities as parents need not and should not ignore children’s development, including children’s cognitive and social-emotional readiness for school. But in a family support model school readiness is one branch on the tree, not the trunk.
What would a family support model of early childhood programs look like in the U.S.? It could take many forms. In fact, the details should differ if the 50 individual states rather than the federal government were in control. One possible model for the federal government, called Early Learning Family Grants, is outlined in testimony I gave to Congress.[viii] Governor Jeb Bush proposed something similar in his presidential campaign in the form of an annual scholarship for every low-income child under five.[ix] To flesh this out, under such family support models:
Individual families would:
- receive financial subsidies on a sliding scale based on family income to support the costs of raising young children from birth through age five;
- receive additional targeted support for special needs, e.g., children with significant disabilities; and
- choose what kind of out-of-home care they need and when they need it.
The Federal government would:
- provide the basic subsidy and financial support to states for carrying out their responsibilities to low income families; and
- provide technical assistance.
State governments would:
- regulate out-of-home providers to insure basic levels of safety and performance;
- help parents select a provider by making available results from consumer satisfaction surveys and other information on the performance of individual providers; and
- supplement the federal subsidy.
Various governmental entities, non-profits, and others would:
- work to align supply with demand;
- support the training needs of child care workers and the management needs of providers;
- provide linkages between providers and guidance on how providers and parents can promote the successful transition of children into elementary school; and
- support parents in meeting their obligations and providing a caring environment for their children.
The devil is in the details of each of these features, and there is every reason to believe that the impacts of a family support policy could shift in size and sign depending on those details. For example, a subsidy that is too small in dollar value to cover market rates for out-of-home care, or too delayed in receipt to be available when the bill is due, or too uncertain in prospect based on unpredictable short-term changes in earned income could leave children in care settings that do harm and could increase levels of stress for parents. There is some evidence that the federal Child Care and Development Block Program does exactly that.[x] Likewise, a program that is not cleverly structured could entice low-income parents to leave the labor market entirely during long stretches of their young children’s lives, making reentry difficult after the children age out of the family subsidy. Annual subsidies that start at birth and don’t rollover could incentivize parents to put their child in center-based care at an earlier age than necessary or desirable, and so on through each of the bullets above.
There is, as well, variety in the details of school readiness programs. Head Start is not the same as Boston’s pre-K program, although both serve the same age group with related goals. Likewise, Florida’s universal pre-K program for four-year-olds differs in many ways from Oklahoma’s. And nearly all current publicly funded pre-K programs differ in important respects from earlier pre-K programs whose short and longer term impacts have been estimated and the results of which have been extrapolated to justify claims of return on investment in current programs.
Estimating the return on investment in family support vs. school readiness
This squishiness in what, specifically, we’re talking about brings peril to any attempt to provide an empirical comparison of the returns on public investment in family support vs. school readiness. But there is sufficient information available to support a preliminary estimate of the return on investment in children of public spending on center-based programs for four-year-olds vs. family support. I attempt that here in an effort to foster greater attention to the subject by both researchers and policymakers.
Consider what follows a back-of-the-envelope exercise in which I have avoided the heavy lifting that would be necessary to generate point estimates that are defensible. For example, I have not adjusted expenditure levels across studies to current dollars, or scaled the outcomes across studies based on the lag in years between a child experiencing the input being evaluated and the outcomes being assessed, or tried to restrict data on family support to only those inputs a child would experience in early childhood. It would be desirable for someone to do all these things, which in some cases would require data not now available. I do not think that I would need to change the general conclusions I draw in the present report if the approximations I provide were cleaned up in the future. But caveat emptor.
I use child achievement outcomes to generate effect estimates rather than measures of family functioning such as the labor market participation of parents. A priori I would expect that this advantages the school readiness approach since programs that operate under that umbrella are designed to enhance child achievement whereas that is an ancillary goal of family support.
Before getting to the meat of the matter, which is examining the impact of family support and school readiness expenditures in the U.S., consider an important and well-designed study that evaluated the impact in Norway of receipt by lower income parents of a subsidy for child care.[xi]
Because the subsidy was received after parents had already decided to send their child to center-based care and pay their required share of the tuition, it ended up increasing the family’s disposable income by lowering their tuition bill rather than affecting their use of child care. Functionally, this made the program a family support investment rather than a preschool program per se, but one conditioned on the family making an expenditure on their child.
The researchers took advantage of a strict income discontinuity in eligibility to create a treatment and control group of families that just made or missed the cutoff point for the subsidy. They used variation across municipalities in the income cutoff for eligibility to examine differences in impacts by family income. They estimated the long-term outcomes on the children in the two groups using results of national examinations taken by the children when they were in middle school. They also examined impacts on the achievement of older siblings of the treatment and control children, and impacts on labor market participation and family income of parents. Families in the treatment group had a one year boost of about 10 percent of gross family income, or about $1,500 in U.S. dollars.
There were strong positive effects on grade point average and oral exam scores in middle school. Older siblings in the families receiving the supplement did better as well. And the parents receiving the supplement went on to earn more in the years following the supplement. The effect size for middle school grade point average for children who qualified for the subsidy as five-year-olds was .30, a very large impact. The effect was largest in municipalities in which the threshold for eligibility was at lower levels of income, e.g., receiving or failing to receive the $1,500 subsidy had much larger consequences for a family with a gross income of $15,000 than for a family with a gross income of $30,000.
This study shows that a modest boost in income for low-income families during one year of the lives of their preschoolers had substantial long-term impacts, including enhancing school performance in middle school. These effects were not mediated by preschool attendance. Instead, the additional income appears to have allowed the parents to function better and thereby increase their own and their children’s human capital. Of course, Norway differs from the U.S. on many dimensions that may influence the impact of a program like the one that was studied.
For evidence from the U.S. on the impact of a family support model I turn to research on various welfare reforms and on the Earned Income Tax Credit (EITC), a federal program that provides a tax refund to lower-income workers based on amount of earned income and number of children. The present annual federal expenditure on EITC is about $65 billion, which amounts to roughly $2,200 per recipient. About half the states provide their own EITC supplement, which varies in generosity.
Studies of the EITC that have examined impacts on child outcomes typically take advantage of nonlinear variation across time in the generosity of the benefit.[xii] For example, in 1993 the amount of the federal EITC increased substantially for families with more children, allowing comparison of differences in child outcomes for larger families before and after that change. Another approach uses experiments on welfare reform rather than the EITC and takes advantage of variation in the earnings supplements that were provided to families in the treatment conditions.
I focus on methodological strong studies that examine student achievement in school. These include three studies of the impact of the EITC[xiii] and one synthesis[xiv] of several experimental studies of welfare reforms in the 1990s. I compare the impacts of increased family support on student test scores from these four studies with the impacts of pre-K school readiness interventions using, first, a synthesis of findings from 67 pre-K evaluations of test outcomes 2-4 years after pre-K,[xv] and, second, the follow-up findings from the Head Start Impact Study[xvi] for 3rd graders. As a further point of comparison I provide results from a study[xvii] of Project STAR that examined the impact on middle school test scores of exposure to class size reduction in the early grades. Additional detail on the studies is provided in Table 1 in the appendix to this report.
It is conventional in comparing impacts across studies in which the intervention can be expressed as a dollar expenditure to standardize the size of the expenditure in a round number that is related, in general, to the scale of actual expenditure. The size of the difference in outcomes is then adjusted proportionally. This results in the ability to report what the impact of, for example, $1,000 in additional annual family income was on academic achievement in a particular study even though the actual increase in expenditure was only in the ballpark of $1,000. For instance, if the actual difference in the EITC between the treatment and control families was $1,500 and the actual difference in test scores between children in those two groups resulted in an effect size of .12, the findings could be described by downscaling both the intervention and outcome as “an increase in the EITC of $1,000 produced an effect size of .08.” The same approach allows us to compare interventions that are simply financial supports for families, such as the EITC, with substantive programs to which a cost per participant can be attached. For example, the impact of a school readiness program such as Head Start can be compared with the EITC by expressing the return on investment of both as the effect produced by $1,000 of expenditure.
I report child outcomes as an “effect size,” which places an outcome difference between a treatment and comparison group on a scale based on the standard deviation of the outcome (a measure of the spread of scores of the individual cases). Thus a mean difference of 2 points between a treatment and control group on a test that has a standard deviation of 10 would be described as an effect size of .20 (2/10), whereas that same 2 point difference would represent an effect size of .10 on a test with a standard deviation of 20 (2/20).
The figure below presents the effect size on tests of cognitive skills for low-income children of $1,000 of expenditure. It uses data from the studies described above and in Table 1 of the appendix. In the case of the EITC studies the effect is for a single year of a $1,000 of expenditure. For the welfare experiments the effect is for $1,000 per year of expenditure for 2-5 years. For the school readiness interventions the expenditure is derived from the cost per participant for a single program year. Cost data are not available from the reported studies so I use a conservative estimate of $5,000 per year for pre-K and $7,000 per year for Head Start. In all cases, cognitive outcomes are measured during the elementary school years or the elementary and middle school years. The first author of each of the underlying studies is listed below the horizontal axis in the figure.
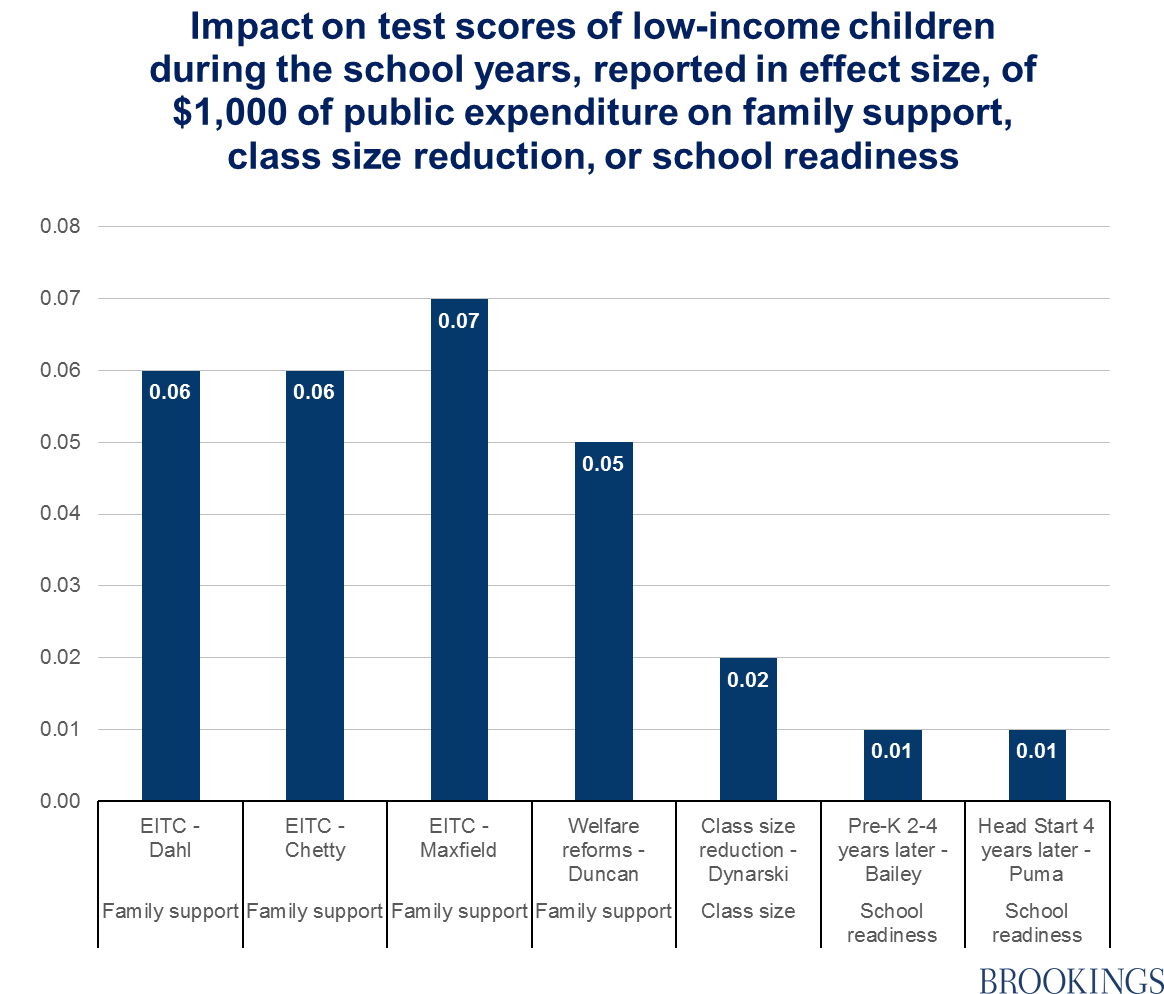
The results illustrated in the graph suggest that family support in the form of putting more money in the pockets of low-income parents produces substantially larger gains in children’s school achievement per dollar of expenditure than a year of preschool, participation in Head Start, or class size reduction in the early grades. The finding that family financial support enhances academic achievement in the form of test scores is consistent with other research on the impact of the EITC showing impacts on later outcomes such as college enrollment.[xviii]
The findings I have presented are with respect to a particular form of family support, more income. They have implications for but are not a direct test of the more constrained forms of family support I presented previously that condition subsidies to activities that directly involve the care of young children. I make the reasonable assumption, based on the research findings illustrated in the figure, that children in low-income families will do better in school if their families receive more income from taxpayer appropriations.
I hypothesize that those children will do even better if the additional family income were delivered with constraints that tie it to direct investments in children, as was the case for the program in Norway in which parents were reimbursed for a portion of their costs of purchasing center-based care for their preschooler. The principal constraint would be that the funds would have to be used to support the direct care of young children, e.g., subsidizing out-of-home child care or the reduction of work hours so that parents can spend more time with their children. Think of the constrained family support option as akin to the federal Supplemental Nutritional Assistance Program, usually referred to as food stamps—a direct financial support that can only be spent on certain types of consumption. Contrast this with the EITC or a subsidized minimum wage in which the family receives extra income with no restrictions on how it can be spent.
There no research of which I’m aware that directly addresses in a rigorous way the relative effectiveness for children of unconditional cash transfers to families vs. cash transfers that reimburse or subsidize parents for spending on their children. Would the EITC be more effective in boosting the human capital of children if it incorporated the conditional characteristics of the federal Child Care Tax Credit? This and related questions are important and unanswered.
In this context we have three broad policy options on the table with regard to public expenditure to support early development and learning in low-income families. The first is investment in particular program services in the form of school readiness programs such as Head Start and statewide universal pre-K. The second is providing parents with additional income that they can spend only on services for their young children, such as center-based care. The third is providing parents with additional income that they can spend on anything. In my view, and in light of the evidence I’ve reviewed, the overwhelming focus by politicians, child advocates, and the research community on option one, the school readiness option, is undesirable. It is possible that options two or three are more effective than providing low-income families with a year of free school for four-year-olds or that they are multipliers of the impacts of doing so. We will never know unless the family support options are included in the policy menu and subject to test.
Grover J. (Russ) Whitehurst served as an informal education advisor to the Jeb Bush campaign.
[i] http://eclkc.ohs.acf.hhs.gov/hslc/standards/law/HS_Act_2007.pdf
[ii] https://www.whitehouse.gov/the-press-office/2013/02/12/remarks-president-state-union-address
[iii] http://www1.nyc.gov/office-of-the-mayor/news/425-14/new-york-city-launches-historic-expansion-pre-k-more-51-000-children#/0
[iv] http://thenextgeneration.org/blog/post/hillary-clinton-next-generation-partnership
[v] http://www.oecd.org/education/school/2475168.pdf
[vi] http://www.oecd.org/finland/2476019.pdf
[vii] http://www.oecd.org/els/soc/PF3_2_Enrolment_in_childcare_and_preschools.pdf
[viii] https://www.brookings.edu/research/papers/2014/02/05-congressional-testimony-preschool-whitehurst
[ix] https://medium.com/@JebBush/restoring-the-right-to-rise-through-a-quality-education-a27ef314f2c#.s6gy1plbv
[x] http://www.chrisherbst.net/files/Download/C._Herbst_Subsidies_Child_Development.pdf
[xi] http://www.nber.org/papers/w18086
[xii] http://eml.berkeley.edu/~jrothst/workingpapers/nichols-rothstein-draft_Mar2015.pdf
[xiii] http://www.nber.org/papers/w14599.pdf; https://www.irs.gov/pub/irs-soi/11rpchettyfriedmanrockoff.pdf; https://msu.edu/~maxfiel7/20131114%20Maxfield%20EITC%20Child%20Education.pdf
[xiv] http://www.ncbi.nlm.nih.gov/pmc/articles/PMC3208322/
[xv] http://www.lifecoursecentre.org.au/wp-content/uploads/2015/11/2015-27-LCC-Working-Paper-Bailey-et-al.1.pdf—for additional information on the studies see http://inid.gse.uci.edu/files/2011/03/InvestingInPreschoolPrograms.pdf
[xvi] https://www.acf.hhs.gov/sites/default/files/opre/head_start_report.pdf
[xvii] http://users.nber.org/~dynarski/Dynarski_Hyman_Schanzenbach.pdf
[xviii] http://www.daymanoli.com/wp-content/uploads/2014/04/Manoli_Turner1.pdf
The Brookings Institution is committed to quality, independence, and impact.
We are supported by a diverse array of funders. In line with our values and policies, each Brookings publication represents the sole views of its author(s).