
Higher education provides extensive benefits to students, including higher wages, better health, and a lower likelihood of requiring disability payments (Oreopoulos and Petronijevic 2013). A population that is more highly educated also confers wide-ranging benefits to the economy, such as lower rates of unemployment (Greenstone and Looney 2011) and higher wages even for workers without college degrees (Moretti 2004).
A postsecondary degree can also serve as a buffer against unemployment during economic downturns. Those with postsecondary degrees saw more steady employment through the Great Recession (Autor 2014), and the vast majority of net jobs created during the economic recovery went to college-educated workers (Carnevale, Jayasundera, and Gulish 2016).
In recognition of the personal and social benefits of higher education, the federal government provides incentives to young people to attain a higher education credential, as well as policies that encourage additional training, reskilling, on-the-job professional development, or credentialing after a spell in the labor market. A large and growing number of Americans participate in these programs. In the fall of 2015, about 20 million students were enrolled in degree-granting institutions of higher education, double the 8.5 million enrolled in the fall of 1970 (National Center for Education Statistics [NCES] 2015, 2016).
Read the full introduction
The higher education sector itself is an important piece of the U.S. economy. In the fall of 2013, institutions of higher education that participated in Title IV federal financial aid programs employed almost 4 million people (NCES 2015). The higher education sector also confers a large advantage to the United States in the global market for talent. In the 2015–16 academic year, more than 1 million international students studied at U.S. colleges and universities. These students contributed more than $32 billion to the economy and supported more than 400,000 jobs (NAFSA 2016).
The substantial federal and state support for higher education flows both through students and directly to public institutions. State support for public institutions of higher education made up an average of 10.1 percent of state budgets in fiscal year 2016, at a total cost of $197 billion (National Association of State Budget Officers [NASBO] 2016, tables 12 and 13). Federal grants and loans to students peaked at $192 billion in the 2010–11 school year.
The investment calculation that students make when deciding whether and where to enroll in postsecondary education involves determining the amount the student will need to borrow to finance her degree, and the value that the degree itself will provide in enabling the student to pay down her education-related debt. In the fourth quarter of 2016 outstanding student loan debt was second only to mortgage debt in total volume, at $1.31 trillion (Federal Reserve Bank of New York 2017). On the other hand, two thirds of undergraduate borrowers borrow less than $20,000 to finance their education (CEA 2016).
The Hamilton Project has previously offered analysis on related topics, including education and economic opportunity (Schanzenbach et al. 2016), education and social mobility (Greenstone et al. 2013), and K–12 education (Greenstone et al. 2012), highlighting the central role that education plays in supporting broad-based economic growth. In these Economic Facts, the Hamilton Project offers evidence of the value a postsecondary education has to people and to the economy.
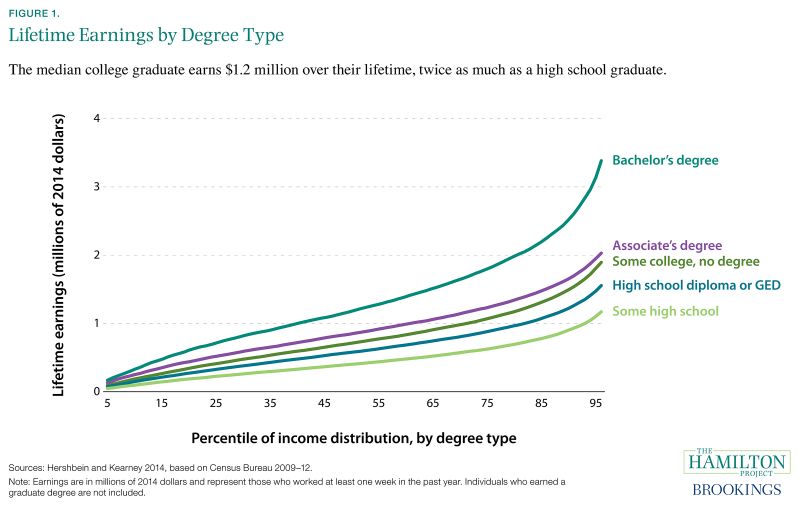
Fact 1: The median lifetime earnings for individuals with bachelor’s degrees are twice that of those with high school diplomas.
Is getting a college degree worth the investment? Although the labor market return to a college degree varies, particularly by the characteristics of a student and her chosen field of study (Altonji, Blom, and Meghir 2012; Barrow and Malamud 2015), those with postsecondary degrees generally have higher lifetime earnings than those who do not.
Figure 1 shows the lifetime earnings of those who completed different levels of education. Hershbein and Kearney (2014) found that the typical bachelor’s degree holder earned about $1.2 million over a lifetime—about $600,000 more than the average high school diploma holder and about $300,000 more than the average associate’s degree holder. At the 95th percentile of the earnings distribution, the earnings advantage is even higher; bachelor’s degree holders have lifetime earnings of $3.4 million—$1.8 million more than high school diploma holders and $1.3 million more than associate’s degree holders. There is also tremendous variability in lifetime earnings among those with the same degree; the bachelor’s degree holder in the 95th percentile earns almost three times as much as the median bachelor’s degree holder over a lifetime.
Of course, students vary in ways that are difficult to observe or measure and students make many decisions during and after college about their careers; these characteristics and choices affect the benefits that students receive from college education. The value of a degree would be somewhat overstated if the average college graduate has a higher earnings potential—even before receiving a degree—than the average high school graduate. While a college degree is more valuable in general, the top tenth of high school graduates out-earn the bottom half of college graduates among those who report working at least one week in the last year. This could reflect differences in hours worked or unobserved differences among individuals that might or might not incline them to pursue postsecondary degrees.
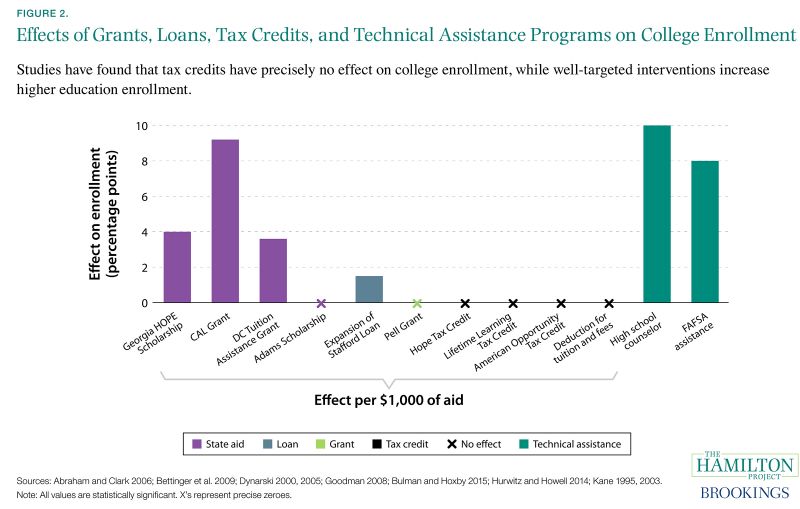
Fact 2: Federal tax credits generally do not increase college enrollment.
Evidence suggests that state-supported programs do generally increase enrollment. For every $1,000 in grant money per student, state-based programs in Georgia, California, and Washington, DC, increased overall rates of enrollment by roughly 4 to 9 percentage points. These programs vary in their generosity and target population. For example, the DC Tuition Assistance Grant can be used at public colleges and universities throughout the United States with an annual cap of $10,000 to cover the difference between in-state and out-of-state tuition; this grant is neither need- nor merit-based, and induced an increase in college-going of 3.6 percentage points (Abraham and Clark 2006). Meanwhile, no effect on overall enrollment was found for the Massachusetts Adams Scholarship, an annual $1,700 grant that could be used only at in-state public colleges and universities (Goodman 2008).
Evidence also suggests that federal tax credits generally do not increase enrollment rates, despite the large scale of investments in these areas (Bulman and Hoxby 2015). There are many theories as to why higher education tax credits do not seem to induce enrollment. For one, because the benefits delivered through the tax code are distributed to families many months after the fall semester begins, it is possible that these benefits do not affect the decision to enroll among price conscious or cost-constrained students (Dynarski and Scott-Clayton 2013). Another possibility is that these tax credits are targeted to families for whom college enrollment is a foregone conclusion, reducing the cost of college but not affecting the decision to go.
Targeted student interventions do seem to be effective at increasing enrollment. Hurwitz and Howell (2014) found that an additional high school counselor increases college enrollment rates by 10 percentage points. Bettinger and coauthors (2009) ran an experiment in which certain low-income filers were offered assistance filling out the Free Application for Federal Student Aid (FAFSA). For those who received FAFSA assistance, college enrollment rates rose 8 percentage points.
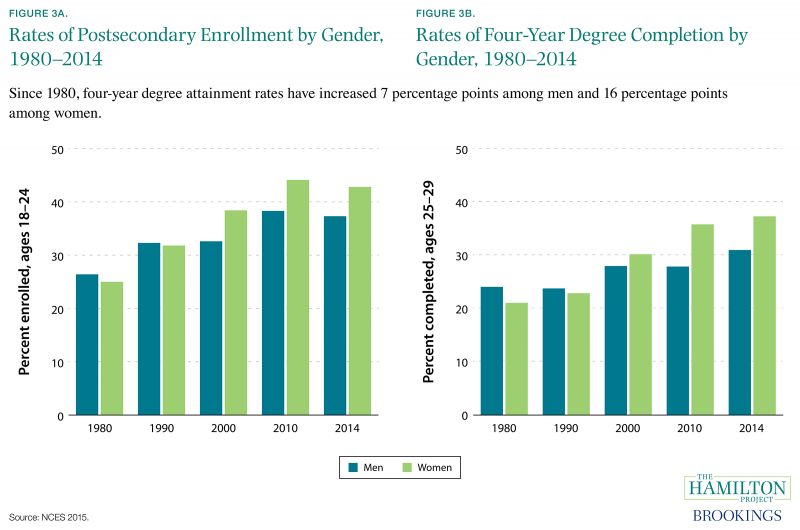
Fact 3: For the past twenty years, women have outpaced men in college attendance and degree attainment.
Figure 3a shows rates of enrollment in two- and four-year degree programs among 18–24 year-olds. Since 1980, enrollment rates among men have increased by almost 11 percentage points. In 1991, rates of college enrollment among women overtook those of men, and have increased by almost 18 percentage points since 1980. Since 2000, enrollment rates for women at two- and fouryear institutions have been about 6 percentage points higher than for men.
Figure 3b shows rates of four-year degree attainment among 25–29 year-olds. Women have overtaken men in rates of four-year degree attainment, increasing by 16 percentage points since 1980. In the last three decades, four-year degree attainment rates have increased by 7 percentage points among men, reaching just over 30 percent in 2014.
It is critical to note that these figures represent rates of enrollment among all 18–24 year-olds and rates of four-year attainment among all 25–29 year-olds. These calculations are not conditional on completing high school or on having even attempted postsecondary education, nor do they capture those who enrolled in or attained a four-year degree outside of the age-range, or who attained a different postsecondary credential. Bailey and Dynarski (2011) and Bound, Lovenheim, and Turner (2010) have found that as overall rates of enrollment have rsien, rates of completion have stalled. Fact 7 documents that many students over the age of 25 are enrolling in postsecondary education, and fact 4 reports that low-income students are disproportionately likely to drop out of postsecondary programs without a credential.
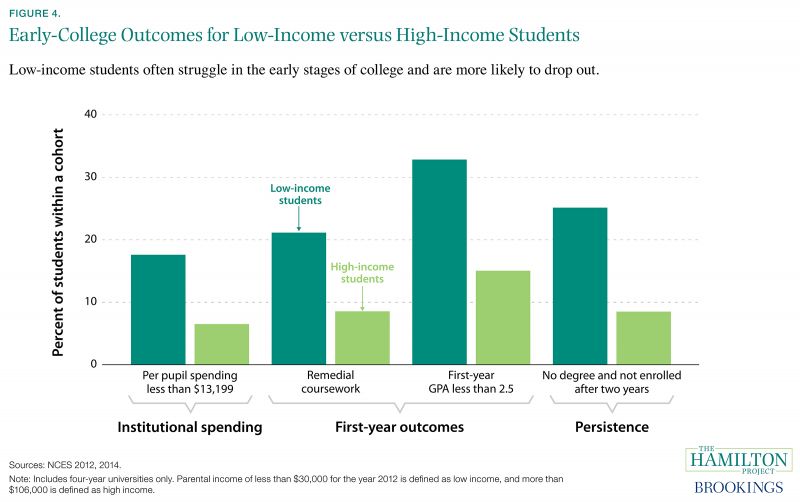
Fact 4: More than a quarter of low-income students who enroll in a four-year institution drop out by the end of the second year.
Though enrollment in institutions of higher education has increased substantially, this has not translated into markedly more graduates (NCES 2015). Low-income students are especially likely to struggle during college and to leave without a degree. While there are many reasons for both poor and positive postsecondary outcomes for low-income students (Goldrick-Rab et al. 2016), characteristics of institutions and early progress in acquiring credits are perhaps more proximal indicators of whether a student is on-track to complete.
Among those who attend a four-year institution, students whose families are in the top and bottom quartiles of the income distribution vary widely in their probability of attending a lower-quality institution. About 18 percent of low-income students attend institutions that spend less than $13,199 per student, as compared to only 6.5 percent of highincome students.
Enrolling in remedial coursework signals that a student is not fully prepared for higher education. Because remedial coursework does not count toward a degree, it also means that the student will need to take additional credits to complete her degree, increasing the cost and time she will need to spend to graduate. About one fifth of low-income students were enrolled in remedial coursework in their first year of postsecondary education, compared to 8.5 percent of high-income students.
Two years after matriculation, one quarter of low-income students were no longer enrolled in college, having dropped out without a credential. Among high-income students, the rate is less than 10 percent.
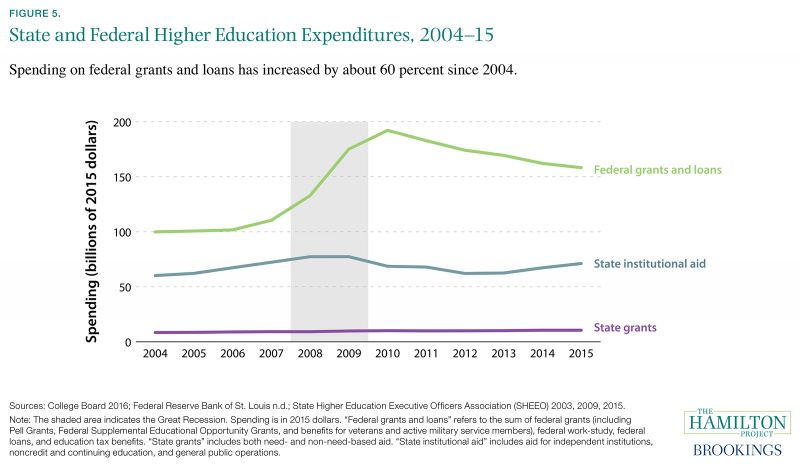
Fact 5: Student financial aid has increased dramatically over the past 15 years, while state direct aid to institutions has stagnated.
Figure 5 describes federal and state expenditures that support students and public institutions of higher education.
Much of the federal investment in institutions of higher education has flowed through grants and loans to students. Over the past decade, there have been substantial increases to the Pell Grant program, a conversion to federal direct lending, and the American Opportunity Tax Credit has been made permanent. Federal spending on grants and loans to students peaked in 2010 at $192 billion. According to the Council of Economic Advisers (CEA), Pell Grant expansions initiated during the Great Recession have led an additional quarter million students to pursue and complete a college degree, resulting in $20 billion more in aggregate earnings (CEA 2016).
Beginning in the 1990s, more than a quarter of states started direct grant programs for students (Deming and Dynarski 2009; Baum et al. 2012). Grants and loans to students from states have grown in the past decade as well, from about $6.5 billion in 2000 to just over $10.5 billion in 2015. Although state grants directly to students have increased steadily in the past decade, these programs did not replace the reduction in state aid to public institutions from 2010 to 2013 (Dynarski and Scott-Clayton 2013).
State spending on institutional aid is more variable over time than state grants and loans to students, in both overall levels and on a per student basis. Direct institutional aid increased from almost $66 billion in 2000 to over $77 billion in 2009; in 2015, state institutional aid was $71 billion. Tandberg and Griffith (2013) report that political factors, pressure on state budgets from other sectors, and state-level governance structures help explain the temporal variation in institutional aid.
Currently, direct federal support to institutions is minimal, even though evidence suggests that greater institutional spending increases rates of college completion (Deming and Walters 2017). In a Hamilton Project policy proposal, David Deming recommends a federal matching grant to increase institutional spending on instruction and academic support.
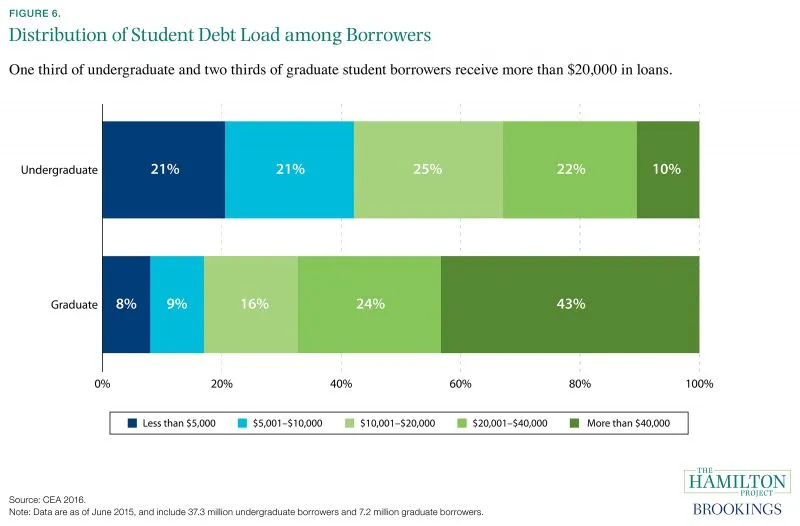
Fact 6: Two thirds of undergraduate borrowers receive less than $20,000 in loans and 90 percent borrow less than $40,000.
Over the past 15 years, the number of student loan borrowers doubled while the amount of outstanding federal student debt quadrupled (Looney and Yannelis 2015). This rapid change in the size of the borrowing population and extent of the total debt has led to a debate as to whether there is (Goldrick-Rab 2016) or is not (Akers and Chingos 2016) a widespread student loan crisis. Figure 6 describes the distribution of outstanding federal student debt in the final quarter of 2015.
The vast majority of undergraduate borrowers take on less than $20,000 in debt. Forty percent of undergraduate borrowers take on less than $10,000 in debt, but two thirds of students who default on their loans do so with original loan values of less than $10,000 (CEA 2016). This could reflect that those with lower levels of debt did not complete their degree or were in programs disproportionately financed through grant aid.
Dynarski and Scott-Clayton (2013) found that those with high levels of student debt (more than $40,000) were much more likely to attend institutions with tuition and room and board in excess of $20,000 per year and much less likely to attend a public institution. Those who accumulate more debt also tend to have higher earnings potential (Looney and Yannelis 2015), suggesting that high debt loads tend to accompany worthwhile investments.
Though 90 percent of undergraduate borrowers accumulate less than $40,000 in debt, 43 percent of graduate degree borrowers accumulate more than $40,000 (CEA 2016). This difference in part reflects greater borrowing capacity: while limited to $31,000 for dependent undergraduates, the only limit to graduate degree borrowing is the cost of attendance less other aid received.
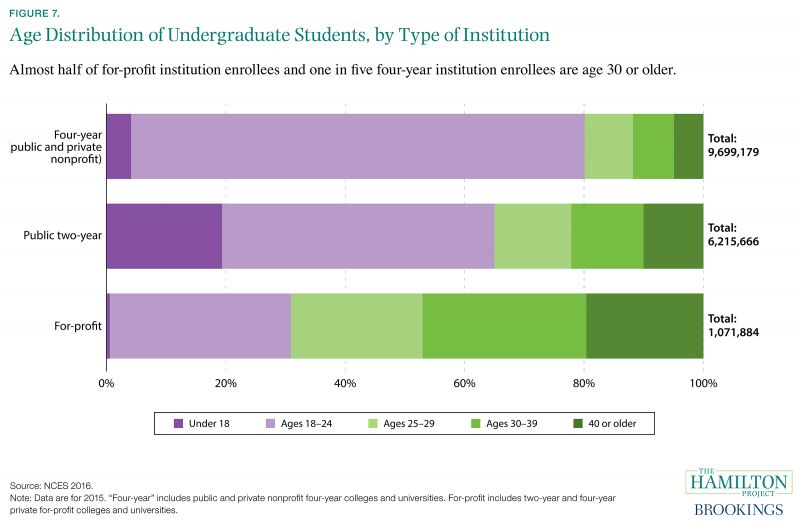
Fact 7: In 2015, 3.5 million students over the age of 30 were enrolled in higher education.
Figure 7 shows the age distribution of undergraduate students by the type of institution in which the students were enrolled in 2015. While the plurality of students at both four-year and public two-year institutions are between the ages of 18 and 24, students at for-profit institutions tend to be older: almost half are age 30 or older. Nonetheless, more than 20 percent of undergraduate students at four-year institutions are over the age of 24.
Enrolling in an institution of higher education as an adult—after spending a year or more working an entry-level job, in response to job loss, or to reskill for a changing economy—can be a valuable human capital investment. The investment calculation is different for older students, because they have fewer remaining working years over which the debt can be repaid and for whom the opportunity cost may be higher because they have already gained some valuable labor market skills.
In a Hamilton Project paper, Sarah Turner (2017) proposes policies aimed at the postsecondary needs of workers who have experienced job loss. Policy options include restructuring Pell Grants and associated Title IV aid for this population, helping workers in the unemployment insurance system select and complete postsecondary programs, and raising the quality of educational programs entered into by these workers.
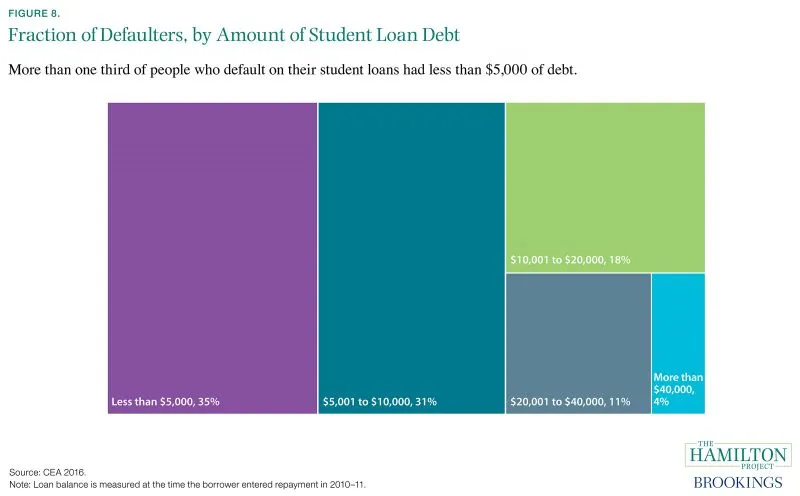
Fact 8: The vast majority of defaulters have less than $10,000 in student loan debt.
Figure 8 describes the distribution of the amount of debt on which students who entered repayment in 2011 defaulted on their debt. Defaulting on federal student loans has consequences for borrowers beyond affecting credit scores. There are direct financial consequences to default such as wage garnishment and offsets of tax refunds and Social Security payments. Among those who defaulted on their student loans, two thirds defaulted on less than $10,000.
Those who borrow small amounts of money are less likely to have finished their degree, regardless of what type of institution they attended (CEA 2016). Defaulters are also more likely to have attended a for-profit institution relative to those who do not default. Almost half of students who enrolled in a for-profit institution in the fall of 2009 had defaulted on their loans five years later, compared to about forty percent of students who were enrolled in two-year colleges and about one quarter of students enrolled in non-selective four-year colleges (Looney and Yannelis 2015).
In order to improve repayment outcomes for students, institutions should have a stake in students’ success. A Hamilton Project proposal by Tiffany Chou, Adam Looney, and Tara Watson suggests a policy for risk-sharing between institutions and students to improve loan outcomes for students and protect taxpayer investments. This proposal would require institutions of higher education to partially reimburse taxpayers when their students’ loan repayment rates fall below a minimum threshold.
Authors


The Brookings Institution is committed to quality, independence, and impact.
We are supported by a diverse array of funders. In line with our values and policies, each Brookings publication represents the sole views of its author(s).