Content from the Brookings Institution India Center is now archived. After seven years of an impactful partnership, as of September 11, 2020, Brookings India is now the Centre for Social and Economic Progress, an independent public policy institution based in India.
Big data provides both companies and governments the ability to differentiate sharply and productively between customers and beneficiaries of welfare programmes. Used effectively, organisations delivering products and services can leverage large databases about customers/beneficiaries to combine economies of scale with the benefits of precision targeting. Further, since data about the target group could be generated with virtually every action of theirs, the system creates the capacity to observe changes in incomes and spending patterns which, in turn, facilitates the adaptation of targets to evolving needs and preferences.
This might sound like an Orwellian nightmare – or fantasy, depending on one’s perspective – but, from an objective, technological standpoint, this is capacity is well within grasp. It is up to government, business and civil society to put a framework in place that respects boundaries. But, once that is done, imaginative use of data can help achieve huge increases in efficiency.
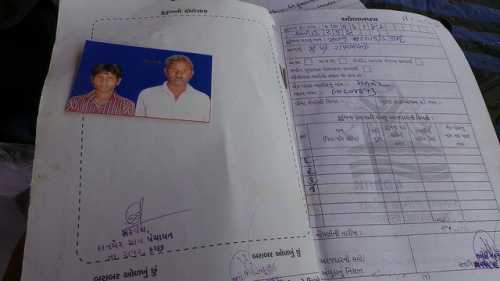
Here, I want to look at it from the viewpoint of welfare and other public programmes. The recent publication of the socio-economic component of the Socio-Economic and Caste Census (SECC) done in 2011 provides a platform to move the entire delivery system to a completely new level, which combines sensitivity to local conditions and requirements, programmes that match the requirements of particular regions and social groups and, most importantly, a framework to track and monitor impact.
Independently of the value of the SECC in this context, the trend towards devolution has been significantly strengthened by the recommendations of the Fourteenth Finance Commission. Along with the larger transfer of resources from the national revenue kitty, there is also a parallel movement to reduce the number of centrally sponsored schemes. While we wait to see how meaningful this process will really be, the underlying driver for this re-structuring is a general disenchantment with centralisation and aggregation. Of course, there is no guarantee that things will improve as a result, but it’s time we tried a new approach and created a framework that will increase its chances of success.
The SECC is an integral part of any such framework. Previously, anti-poverty programmes were essentially designed on the basis of sample surveys, which, in recent rounds, covered about 150000 households nationally. While this number provided reasonable inferences at the national level, their reliability obviously declined as we went down to state and, particularly, district levels. Further, while they provided information about consumption patterns and sources of livelihood, they did not delve into the asset ownership patterns of households – in effect, domestic balance sheets – which should play a significant role in programme design. As regards monitoring, it does not depend on the next census. When individual programmes are put in place, beneficiary groups can be monitored, using an Aadhar-linked data system to track appropriate parameters.
The SECC database allows the user to identify the livelihood and asset ownership patterns of individual households. Effectively, it is a matrix with 249 million rows, each representing a household. The rural subset of this counts 179 million households. This subset currently measures 29 indicators, which fall into three broad categories. The first addresses sources of livelihood – whether the household is gets its income from manual labour or whether one of its members has a regular job in the private or public sectors. There is even a category of households living mainly on alms – about 668000 in rural India.
The second category of indicators address land ownership and the characteristics of the land owned – whether it is irrigated or unirrigated, for example, and whether they own any irrigation equipment. Data on possession of kisan credit cards and the limits on these allow an assessment of linkages between households and the organised financial sector. The third category of parameters reflects ownership of other assets and durable goods – vehicles, whether 2 or 4 wheeled, motorised boats, refrigerators and, importantly, mobile and fixed line phones. While the detailed data are still being uploaded – when I checked, data from 280 out of 641 districts had been published – analysis of all kinds of correlations at varying levels of aggregation is now possible.
Some interesting contrasts emerge from even a cursory look at the state-level data. The all-India proportion of landless rural households is 38 per cent. One might expect to see similar magnitudes of this parameter across “similar” states, but this turns out not to be. Bihar has 54 per cent of its rural households landless, while UP has a much lower 31 per cent. Tamil Nadu has the highest proportion in the country, 56 per cent, while neighbouring Karnataka has only 22 per cent. Is this geography, or water, or some combination of institutions and policies? At the very least, this wide variation across states that are presumed similar should strengthen the case for much more differentiated approaches. The SECC database will allow state governments to delve into intra-state variations as well and, hopefully, design differentiated approaches that are substantial.
Looking at the spread of irrigation, among the larger states, Tamil Nadu comes in rather low with only 12 per cent of rural households owning irrigated land. Punjab, a relatively widely irrigated state, shows 19 per cent of households owning irrigated land, while Rajasthan shows 33 per cent. Gujarat is relatively high on this scale with 29 per cent, with UP at the top of the heap with 50 per cent. This metric, of course, does not give us a sense of the distribution of land holding. The complex links between holding patterns, irrigation, landlessness and livelihoods can be analysed rigorously by combining this database with others.
As regards mobile phone penetration, as might be expected, the numbers across the board are quite high. UP once again tops the list with over 87 per cent of households owning a mobile. Bihar is also above 80 per cent on this scale, but Odisha, another state with a significant outward migration of workers, to my surprise, comes in at around 34 per cent. Demand or supply? What does this mean for the Jan Dhan-Aadhar-Mobile framework for welfare delivery that the government is visualising?
As a first step in using this invaluable information for more effective service delivery, a very rich research agenda can be designed around the SECC in combination with other databases. A collaborative effort between government and the research community would be useful in framing the right questions.
This article first appeared in the Business Standard on July 21, 2015. The views are of the author(s).
Related Content
Related Books


Author
The Brookings Institution is committed to quality, independence, and impact.
We are supported by a diverse array of funders. In line with our values and policies, each Brookings publication represents the sole views of its author(s).

Commentary
Op-edProfiling and targeting
Business Standard
July 21, 2015