Last month the Congressional Budget Office published new estimates of the distribution of federal tax burdens. CBO analysts assembled updated information on Americans’ incomes to calculate household tax burdens between 1979 and 2010. They also predicted 2013 tax burdens based on projections of income combined with a careful reading of current tax law.
Some crucial findings of the new study may come as a surprise, especially to people who believe incomes of the poor and middle class have stagnated since the turn of the century while incomes at the top have soared. The CBO’s latest numbers show the opposite is true. Since 2000 pre-tax and after-tax incomes have improved among Americans in the bottom 90% of the income distribution. Among Americans in the top 1% of the distribution, real incomes sank (see Chart 1).
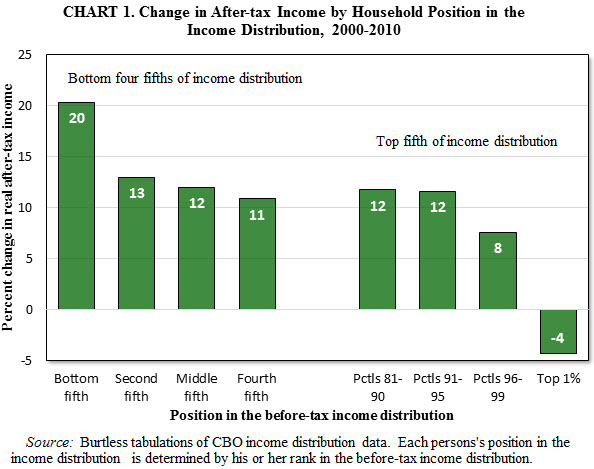
To be sure, the pre- and post-tax incomes of the top 1% improved in 2010 compared with 2009 while incomes in the bottom 90% of households remained essentially flat. Thus, almost all the net income gains in 2010 went to people at the very top. 2010 was the first year of the current recovery, and a disproportionate share of income gain in the early recovery was concentrated on the well-to-do. Income reports published by the IRS suggest this trend continued in 2011 and 2012, when the most affluent taxpayers continued to enjoy big income gains. The flip side is that Americans at the top of the distribution also saw the biggest percentage losses in their incomes during the Great Recession. CBO’s new numbers show that households in the top income percentile saw their before- and after-tax incomes shrink more than one-third between 2007 and 2009. Middle-income Americans experienced pre-tax income losses of 4.5% and after-tax income losses of just 1.4%. In the bottom one-fifth of U.S. households, after-tax incomes actually edged up during the recession.
The market incomes of Americans up and down the income distribution were badly hurt by the Great Recession. (Market income consists of wages and other labor compensation, business income of the self-employed, interest, dividends, capital gains, rent payments to individuals, and private pension payments.) Many households are a long way from recovering the market income losses they suffered in the recession. As it happens, households at the top of the income distribution are among families in this situation. Even accounting for the robust pre-tax gains they enjoyed in 2010-2012, IRS data suggest the top 1% of households had lower pre-tax incomes in 2012 than they did in 2007… or in 2000.
The tax system and government transfers shelter American households from part of the market income losses they suffer in a recession. Unemployment benefits replace some of the wages lost as a result of a layoff. Social Security, Medicaid, and Medicare replace part of the compensation lost by older and disabled workers when they are forced to leave the work force in a weak job market. The progressive income tax reduces households’ tax liabilities more than proportionately when Americans experience a drop in their wages or business income. The stimulus measures adopted in the Great Recession boosted the income protection provided by the government. In percentage terms, government protection against recession-fueled income losses was much more effective in 2008-2010 for low- and moderate-income families than it was for those in the top 1%.
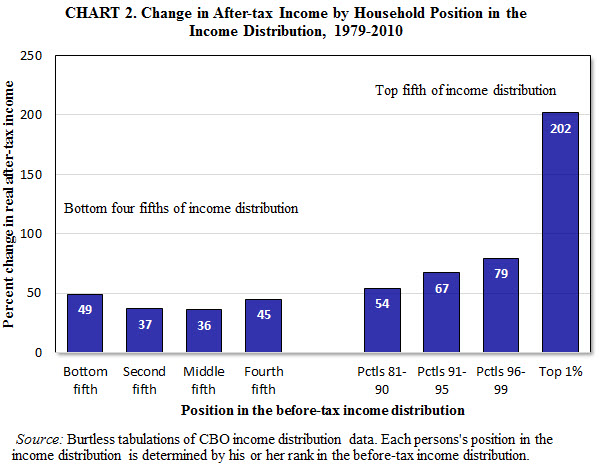
Over longer time horizons and measured over full business cycles the latest CBO numbers confirm that the income gains of the top 1% have been considerably faster than those enjoyed by middle-income Americans. For example, between 1979 and 2010 the after-tax real incomes of the top 1% tripled. Households in the middle three-fifths of the income distribution saw their after-tax incomes grow only about 40% (see Chart 2). What the CBO statistics do not show, however, is that middle- and low-income families have failed to share in the nation’s long-term prosperity. Over the past one-, two-, and three-decade periods, both middle class and poor households have experienced noticeable gains in living standards. Their gains are slower than those experienced by middle-income families in the earlier post-war era, but the gains are well above zero.
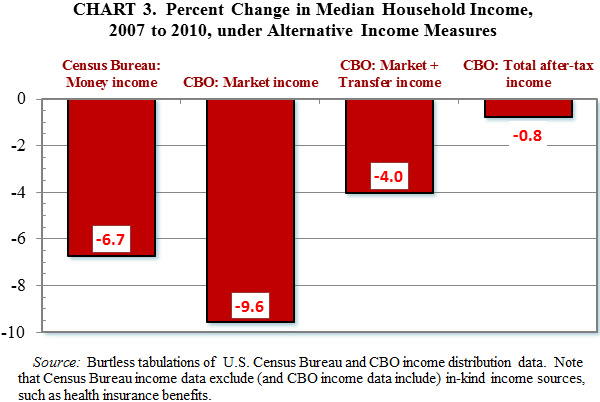
One reason that many observers miss these income gains is that the nation’s most widely cited income statistics do not show them. A commonly used indicator of middle class income is the Census Bureau’s estimate of median household money income. Measured in constant dollars, median household income reached a peak in 1999 and fell 9% in the years thereafter. The main problem with this income measure is that it only reflects households’ before-tax cash incomes. It fails to account for changing tax burdens and the impact of income sources that do not take the form of cash. This means, for example, that tax cuts in 2001-2003 and 2008-2012 are missed in the Census statistics. Even worse, the Census Bureau measure ignores income received as in-kind benefits and health insurance coverage from employers and the government. By ignoring in-kind benefits as well as sizeable tax cuts in the recession, the Census Bureau’s money income measure seriously overstated the income losses that middle-income families suffered in the recession. Under the CBO’s most comprehensive measure of income—total after-tax and after-transfer income—the median household income fell less than 1% between 2007 and 2010. Under the Census Bureau money income definition, median household income fell almost 7% (see Chart 3).
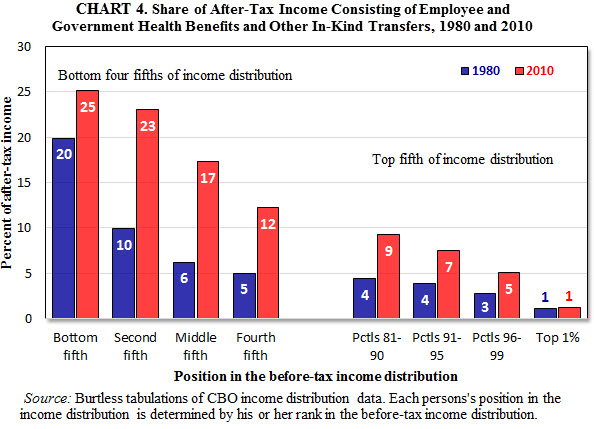
The new CBO income statistics show the growing importance of these items. In 1980, in-kind benefits and employer and government spending on health insurance accounted for just 6% of the after-tax incomes of households in the middle one-fifth of the distribution. By 2010 these in-kind income sources represented 17% of middle class households’ after-tax income (see Chart 4). The income items missed by the Census Bureau are increasing faster than the income items included in its money income measure.
The broadest and most accurate measures of household income are published by the CBO. CBO’s newest estimates confirm the long-term trend toward greater inequality, driven mainly by turbo-charged gains in market income at the very top of the distribution. The market incomes of the top 1% are extraordinarily cyclical, however. They soar in economic expansions and plunge in recessions. Income changes since 2007 fit this pattern. What many observers miss, however, is the success of the nation’s tax and transfer systems in protecting low- and middle-income Americans against the full effects of a depressed economy. As a result of these programs, the spendable incomes of poor and middle class families have been better insulated against recession-driven losses than the incomes of Americans in the top 1%. As the CBO statistics demonstrate, incomes in the middle and at the bottom of the distribution have fared better since 2000 than incomes at the very top.
The Brookings Institution is committed to quality, independence, and impact.
We are supported by a diverse array of funders. In line with our values and policies, each Brookings publication represents the sole views of its author(s).


Commentary
Op-edIncome Growth and Income Inequality: The Facts May Surprise You
January 6, 2014