Last week the Census Bureau published estimates of household income, the poverty rate, and health insurance coverage in 2014. The new statistics appear to confirm some of the gloomiest assessments of the current recovery. The Los Angeles Times titled its story “U.S. Poverty Rate and Incomes Remained Stagnant in 2014.” The headline accurately summarized the topline numbers reported by the Census Bureau. The question is, can the gloomy numbers be correct? They are sharply at odds with other, more credible indicators of economic progress. My hunch is the latest Census numbers are wrong and other indicators more likely to be correct.
The latest Census reports contain nuggets of good news. For example, health insurance coverage improved, especially among young and middle-aged adults. The number of Americans who lack health coverage fell 8.8 million last year, or about 3 percent of the population. The number of workers in full-time, year-round jobs increased 2.8 million, the second straight year of robust gains in full-time employment. The nation’s biggest household survey, the American Community Survey, showed the poverty rate ticked down modestly in 2014 compared with 2013.
The other headline numbers were less rosy. The nation’s main source of historical information about the level and distribution of family incomes is the Census Bureau’s Current Population Survey (CPS). That survey showed a small increase in the number of Americans officially classified as poor and an unchanged poverty rate in 2014. The share of the population in poverty remains more than 2 percentage points above its level before the Great Recession. The official poverty rate has dropped only about a half percentage point beneath its peak level in the recession.
According to Census tabulations, real median household income dropped 1.5% last year. It was the sixth year out of the last 7 in which median income fell. Revisions in the way the Census interviewers ask income questions make it hard to compare 2014 estimates with income estimates from 2012 and earlier years. Measured on a comparable basis, it appears that median income adjusted to reflect consumer price change has shrunk more than 9% since 2007 and more than 10% since 1999. If we accept these estimates, middle-income Americans have about one-tenth less income than they had in the late 1990s. Many politicians and opinion writers accept the estimates without question.
The new Census estimates are surprising for a couple of reasons. First, the economy grew reasonably well in 2014. GDP increased 2.4%, real consumption per person rose 1.9%, and the unemployment rate fell 1.2 percentage points. All these indicators suggest middle-income Americans should have enjoyed comfortable income gains. The personal income statistics published by the Commerce Department also show healthy gains in 2014. Real personal disposable income per person increased 2.0%. If we apply the same consumer price index used by the Census Bureau, the national income accounts suggest that real pretax cash income per person increased 2.1%. These numbers present a very different picture of income growth compared with the bleak portrait in the latest Census report.
In theory both sets of numbers could be correct. Median income might have fallen even as average income increased because income disparities widened. Families in the top tail of the distribution may have obtained more than 100% of the income gains available to be shared among U.S. households, leaving families in the middle and at the bottom with shrunken incomes. Last week’s Census Bureau report contains no evidence to support this theory, however. In fact, the Census tabulations show that average incomes in the top 5% of the income distribution fell faster than incomes in the middle and at the bottom of the distribution. The explanation for the shortfall of income growth in the household survey compared with the national income statistics must be the growing discrepancy between the amount of income reported by households in surveys and the amount recorded in other sources, such as tax reports and Social Security payment files. These administrative data files provide the main source of information for compiling the national income accounts.
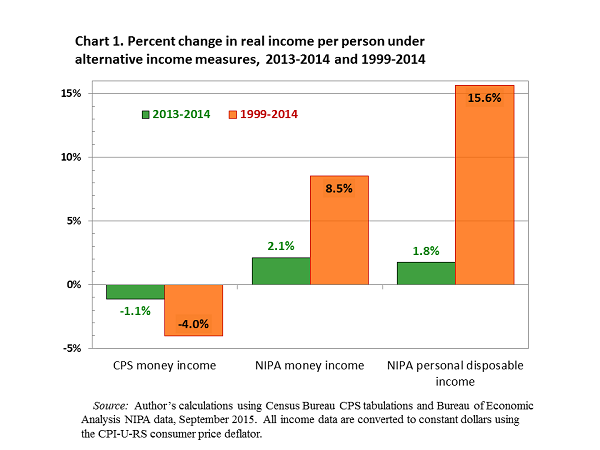
According to the Census Bureau’s CPS survey, the total money income received by Americans, adjusted for price inflation, fell 1.1% per person in 2014 compared with 2013 (see green bars in Chart 1). In contrast, the national income and product account statistics show that money income per person, using the same consumer price index, increased 2.1%. The CPS has shown slower money income gains than the national accounts in 10 of the past 15 years. Cumulatively, the difference between the two income series is large. Since 1999 the Census Bureau’s tabulations of CPS interview responses imply that real income per person has fallen 4.0% (see orange bars in Chart 1). The Commerce Department’s estimates of per capita money income growth, adjusted for price inflation, suggest that incomes have increased 8.5%. If we use a broader measure of consumer income—personal disposable income—and apply the same price deflator, average incomes have increased 15.6% since 1999 according to the national accounts data.
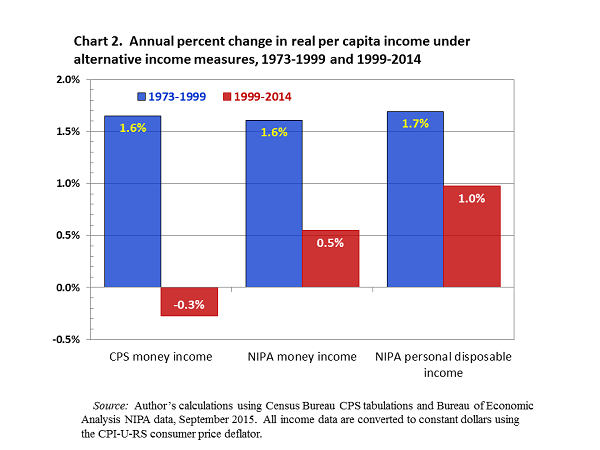
The big gaps between CPS-based and national-accounts-based estimates of income growth are comparatively recent. Chart 2 shows estimated annual rates of change in income per person during two periods, 1973 to 1999 and 1999 to 2014. Notice that both the CPS-based and the national-accounts-based estimates indicate that real income per person increased by about 1.6% a year in the earlier period. Using all three measures income growth has slowed since 1999. However, there is a noticeable difference in the growth slowdown depending on which income measure is used. Using the money income definition—basically, pretax cash income before taxes—the falloff in growth has been greater. Disposable income includes noncash income items, such as employer- and government-provided health insurance, and subtracts direct government taxes, including income and payroll taxes. When those items are included in the income definition, income growth since 1999 has been noticeably faster. The source of income information also makes a big difference. Money income reported in the CPS has grown more slowly than consumer prices, so real income has fallen an average of 0.3% a year since 1999. While the growth of money income in the national income and product accounts has slowed dramatically, it has increased an average of 0.5% a year since 1999.
Income disparities have certainly increased over the past 40 years, producing smaller income gains for low- and middle-income Americans compared with those at the top. In addition, average income gains have slowed in the past 15 years compared with the previous 20. It is also the case, however, that income reporting on household surveys has deteriorated over time, reducing the fraction of income gains that are captured in the country’s oldest income survey. Middle class income gains have slowed since 2000, but it is doubtful they have turned negative over the period. I do not propose punishing the Census messenger for bringing us unwelcome news. But it makes sense to compare the messenger’s tidings with other, possibly more accurate evidence on the same subject.
Editor’s Note: This post originally appeared on Real Clear Markets.
Related Content


Related Books


Author

The Brookings Institution is committed to quality, independence, and impact.
We are supported by a diverse array of funders. In line with our values and policies, each Brookings publication represents the sole views of its author(s).


Commentary
Op-edAre middle class incomes shrinking? Census statistics tell a different story than national income statistics
September 22, 2015