Fiscal policy, including both automatic stabilizers and pandemic-related tax and spending legislation, played a significant role in cushioning the blows to the economy of COVID-19 in 2020 and 2021. The Hutchins Center Fiscal Impact Measure (FIM)—which measures how much federal, state, and local tax and spending policy adds to or subtracts from overall economic growth—shows that fiscal policy has boosted economic growth on average since the start of the pandemic, but will restrain growth going forward as the effects of the stimulus wane.
The FIM measures the direct impact of fiscal policy on the growth rate of GDP, but not on the level. In this post, we illustrate how fiscal policy has impacted the level of GDP over the course of the pandemic. While waning spending from pandemic-related fiscal policy is currently reducing the growth rate of GDP, as seen in a negative reading of the FIM, fiscal policy is still boosting the level of GDP. In other words, total output has been, and will be for some time, higher than it would have been without fiscal policy.
How has pandemic-era fiscal policy affected the level of GDP?
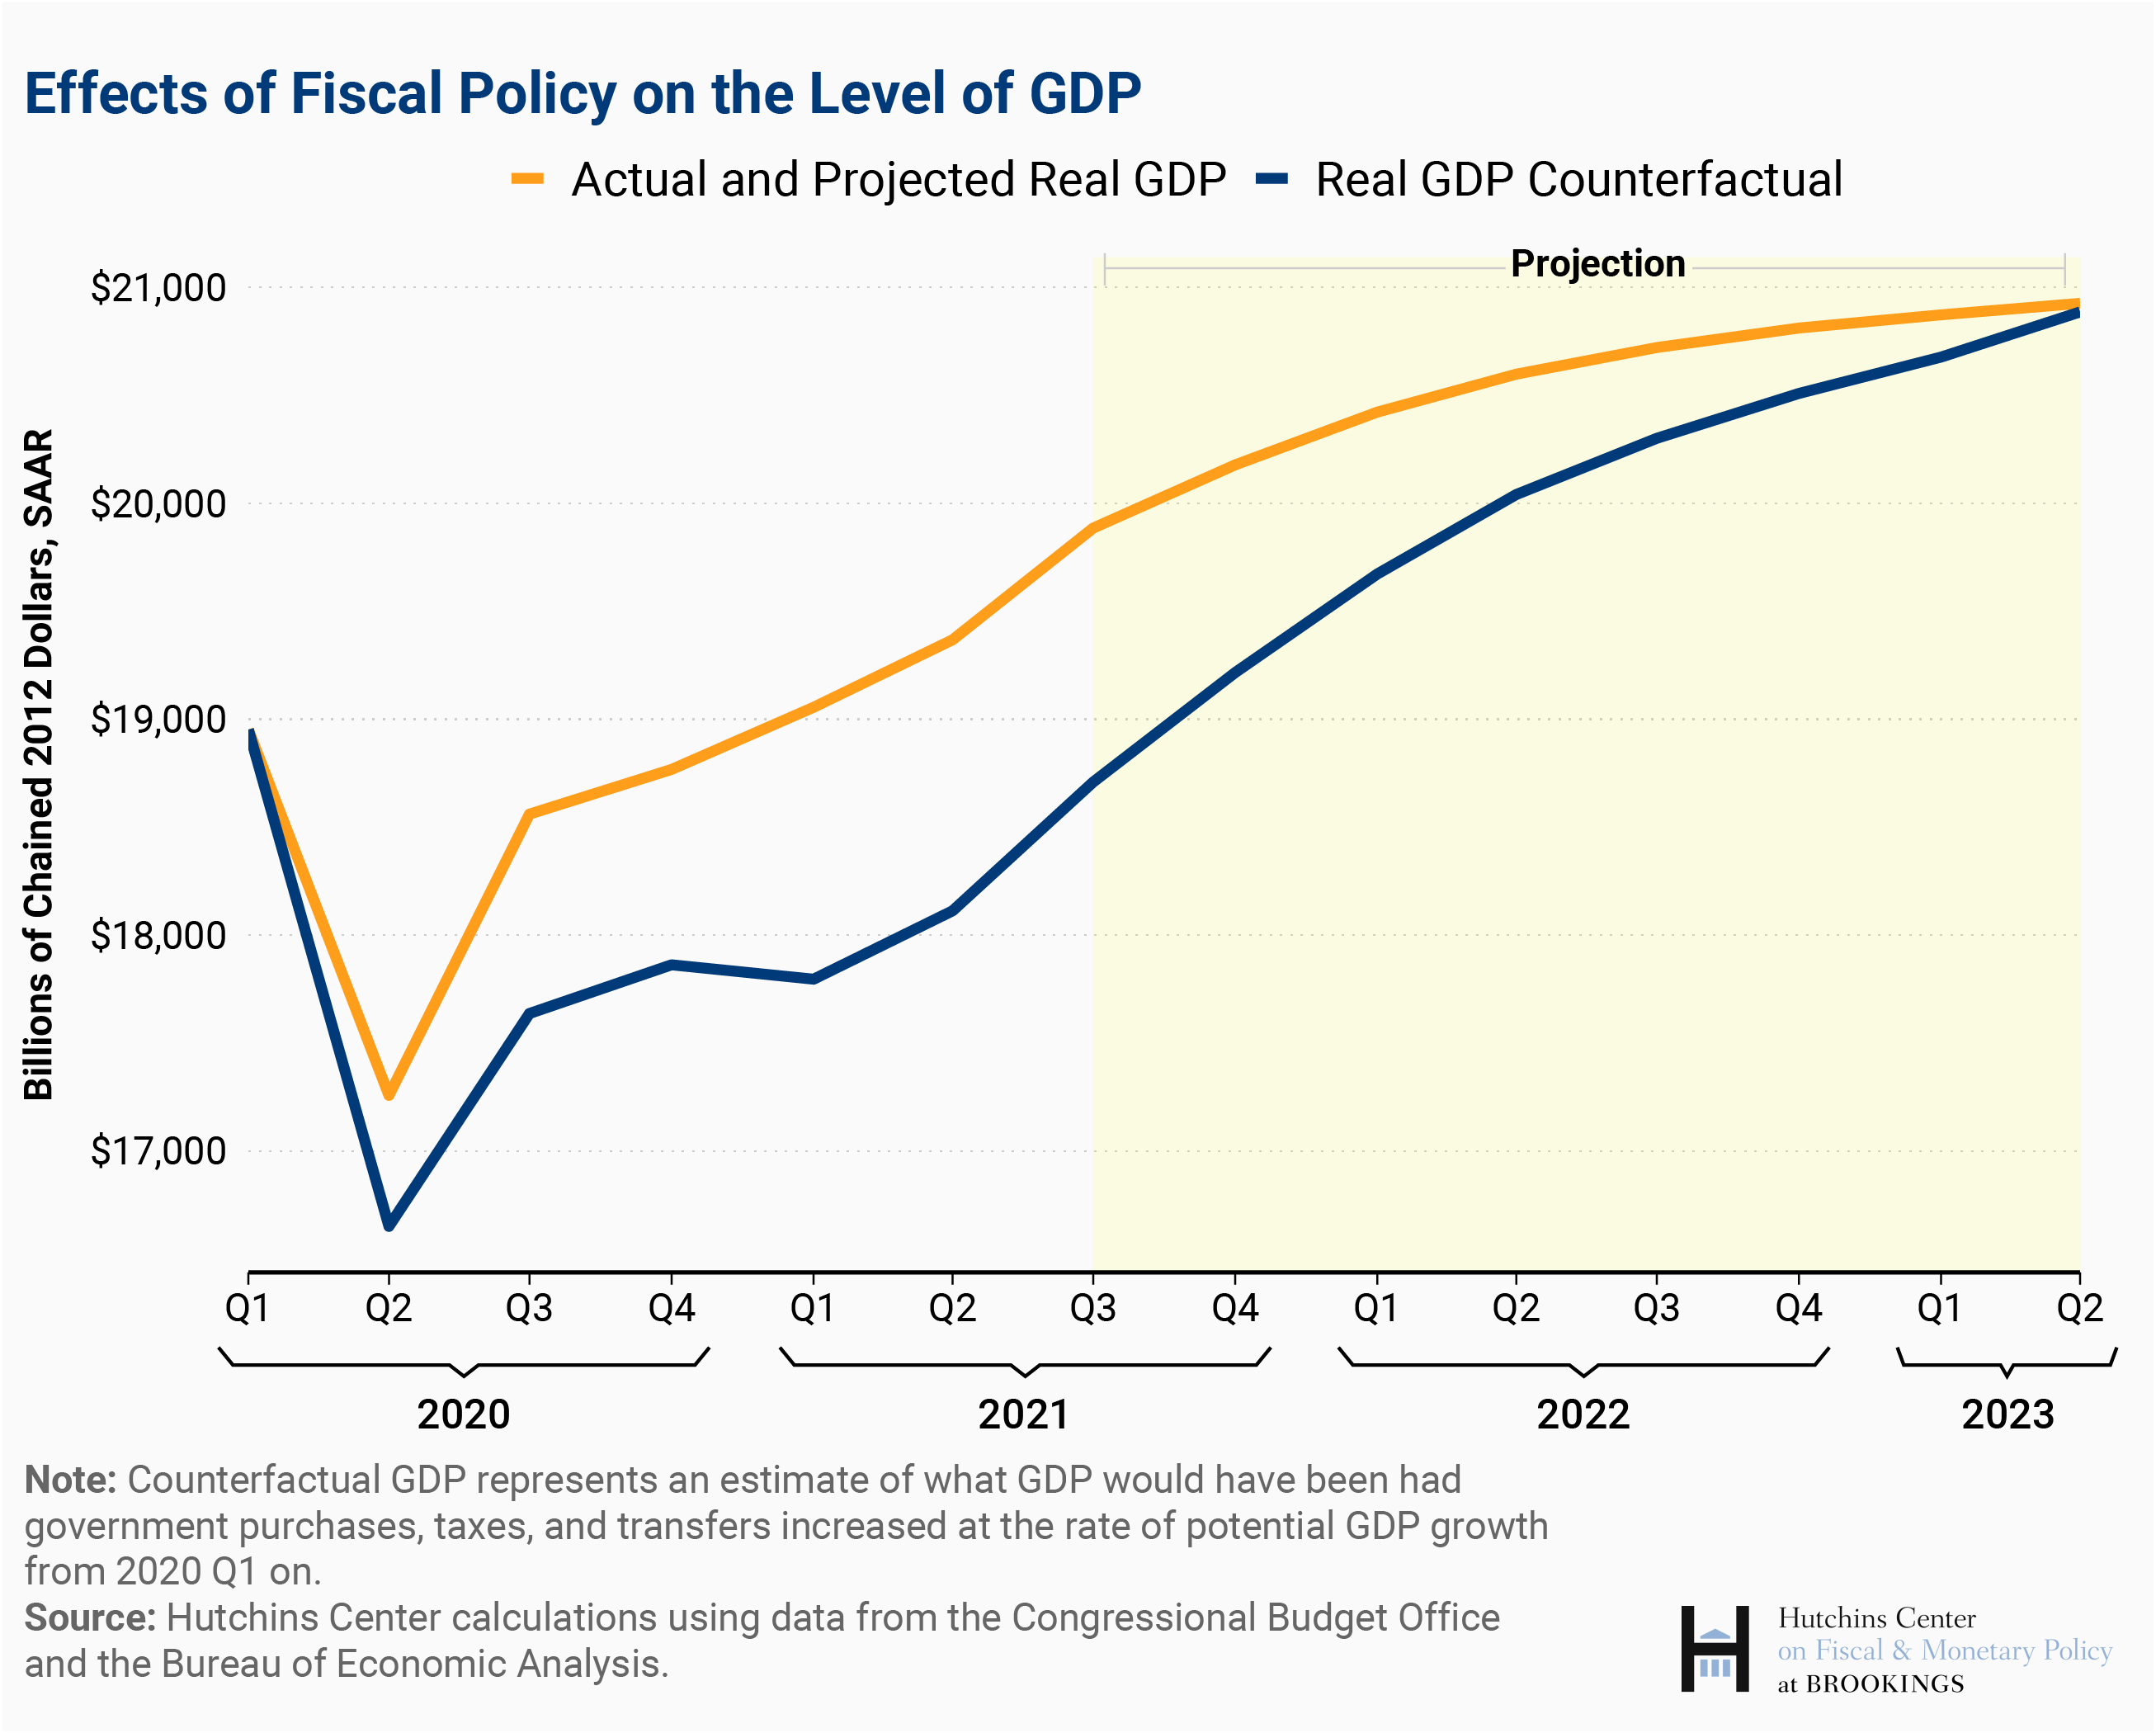
In the chart below, we show actual and projected GDP versus what GDP might have been had fiscal policy failed to respond to the pandemic’s shock to the economy. The top (orange) line represents actual GDP—using the latest Congressional Budget Office projections of GDP from the third quarter of 2021 on. The bottom (blue) line is a counterfactual that provides our estimate of the path GDP would have taken if not for the substantial fiscal stimulus. For this counterfactual, we assume that government purchases, taxes, and transfers all would have increased at the rate of potential GDP from the first quarter of 2020 on; in reality, purchases and transfers far exceeded this counterfactual fiscal policy. Our projections of future fiscal policy make the same assumptions about spending responses to fiscal policy as those underlying the FIM. Unlike the FIM, which includes only direct effects of fiscal policy, this analysis also includes multipliers.[1]
The distance between the two lines represents the effect of fiscal policy changes on economic activity. The chart shows, for example, the huge fiscal response in the spring of 2020 (which we estimate increased the level of real GDP by $607 billion in the second quarter of 2020, and about $900 billion in both the third and fourth quarters), and the big increase in the first quarter of 2021 representing the effects of legislation enacted in December 2020 and January 2021. As the money flowing from pandemic legislation slows and the economy recovers, reducing the automatic stabilizers, the boost to GDP from fiscal policy lessens. Assuming no additional legislation, we estimate that the real GDP will converge to its counterfactual level by early 2023. Of course, if Congress enacts new legislation—like the infrastructure or Build Back Better bills—that will boost actual GDP and the estimated effect of fiscal policy.
As noted above, the FIM estimates fiscal policy’s contribution to GDP growth rather than its level. Thus, when the effect of fiscal policy on the level of GDP gets smaller over time—as it does from the second quarter of 2021 on—fiscal policy is lowering GDP growth, and the FIM is negative.
How do the different components of fiscal policy affect the level of GDP?
The chart below decomposes the boost to GDP from fiscal policy (the distance between the two lines in the first chart) into its components.[2] These represent the effects on GDP from the changes in policy, which depend on how much and how quickly households, businesses, and state and local governments change their spending in response to changes in fiscal policy over time (the marginal propensities to consume). We assume different spending responses for different types of policy. For example, we assume that Paycheck Protection Program (PPP) loans (in the subsidies category) have a much smaller and slower effect on private spending per dollar of government expenditure than do unemployment insurance benefits.
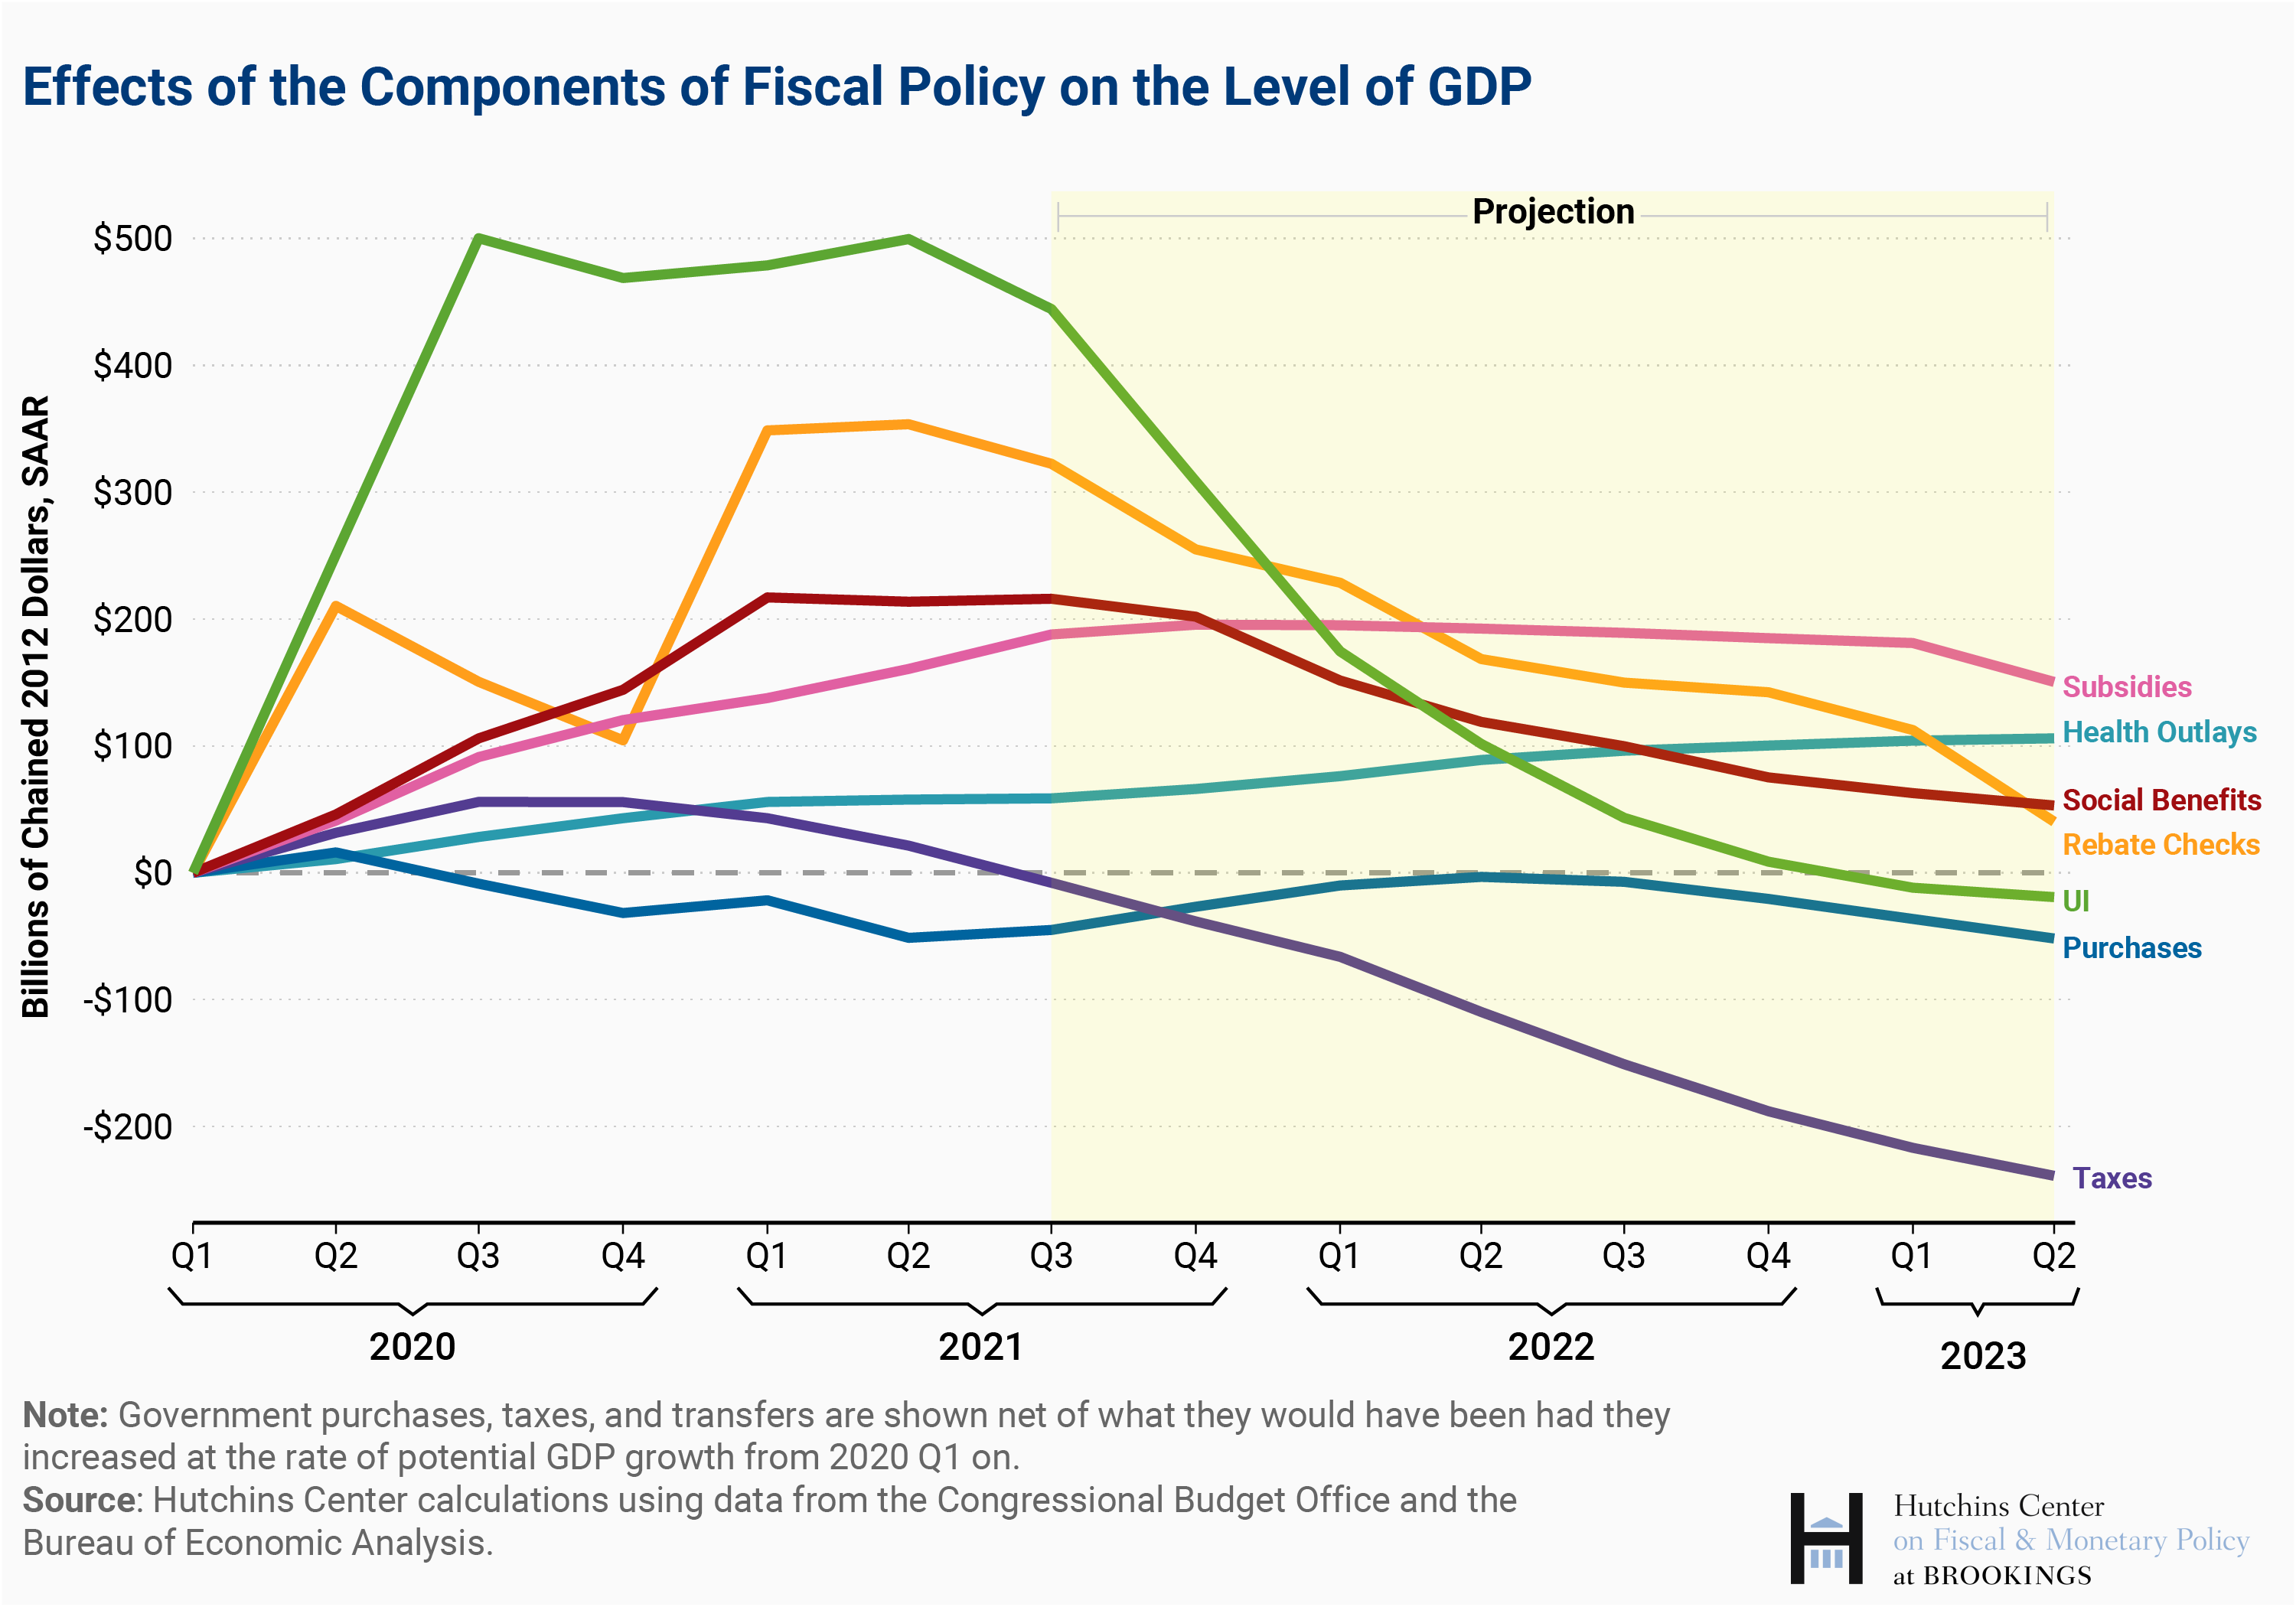
While the expansion of unemployment insurance and the three rounds of rebate checks have provided a considerable boost to GDP since the start of the pandemic, we expect their impact to diminish going forward as consumer spending from rebate checks and the now-expired expanded unemployment benefits wane. Other social benefits, which include programs like SNAP and the Child Tax Credit, are projected to follow a similar pattern.
Subsidies to businesses (a category that includes the PPP loans) increased more slowly but provide a steady stream of spending going forward. Although federal purchases and grants to state and local governments rose in response to the pandemic, state and local spending has been very weak, causing total purchases to be a drag on the level of GDP. We project that real government purchases will be roughly neutral, on average, during the projection period. Although we expect state and local governments to increase their spending out of the grants provided in the American Rescue Plan, federal purchases are projected to decline. Health outlays for Medicaid and Medicare have grown just a bit faster than potential while taxes have grown more slowly (boosting GDP a bit), although we project that both will rise steadily into 2023.
How do the components of fiscal policy impact GDP growth as measured by the FIM?
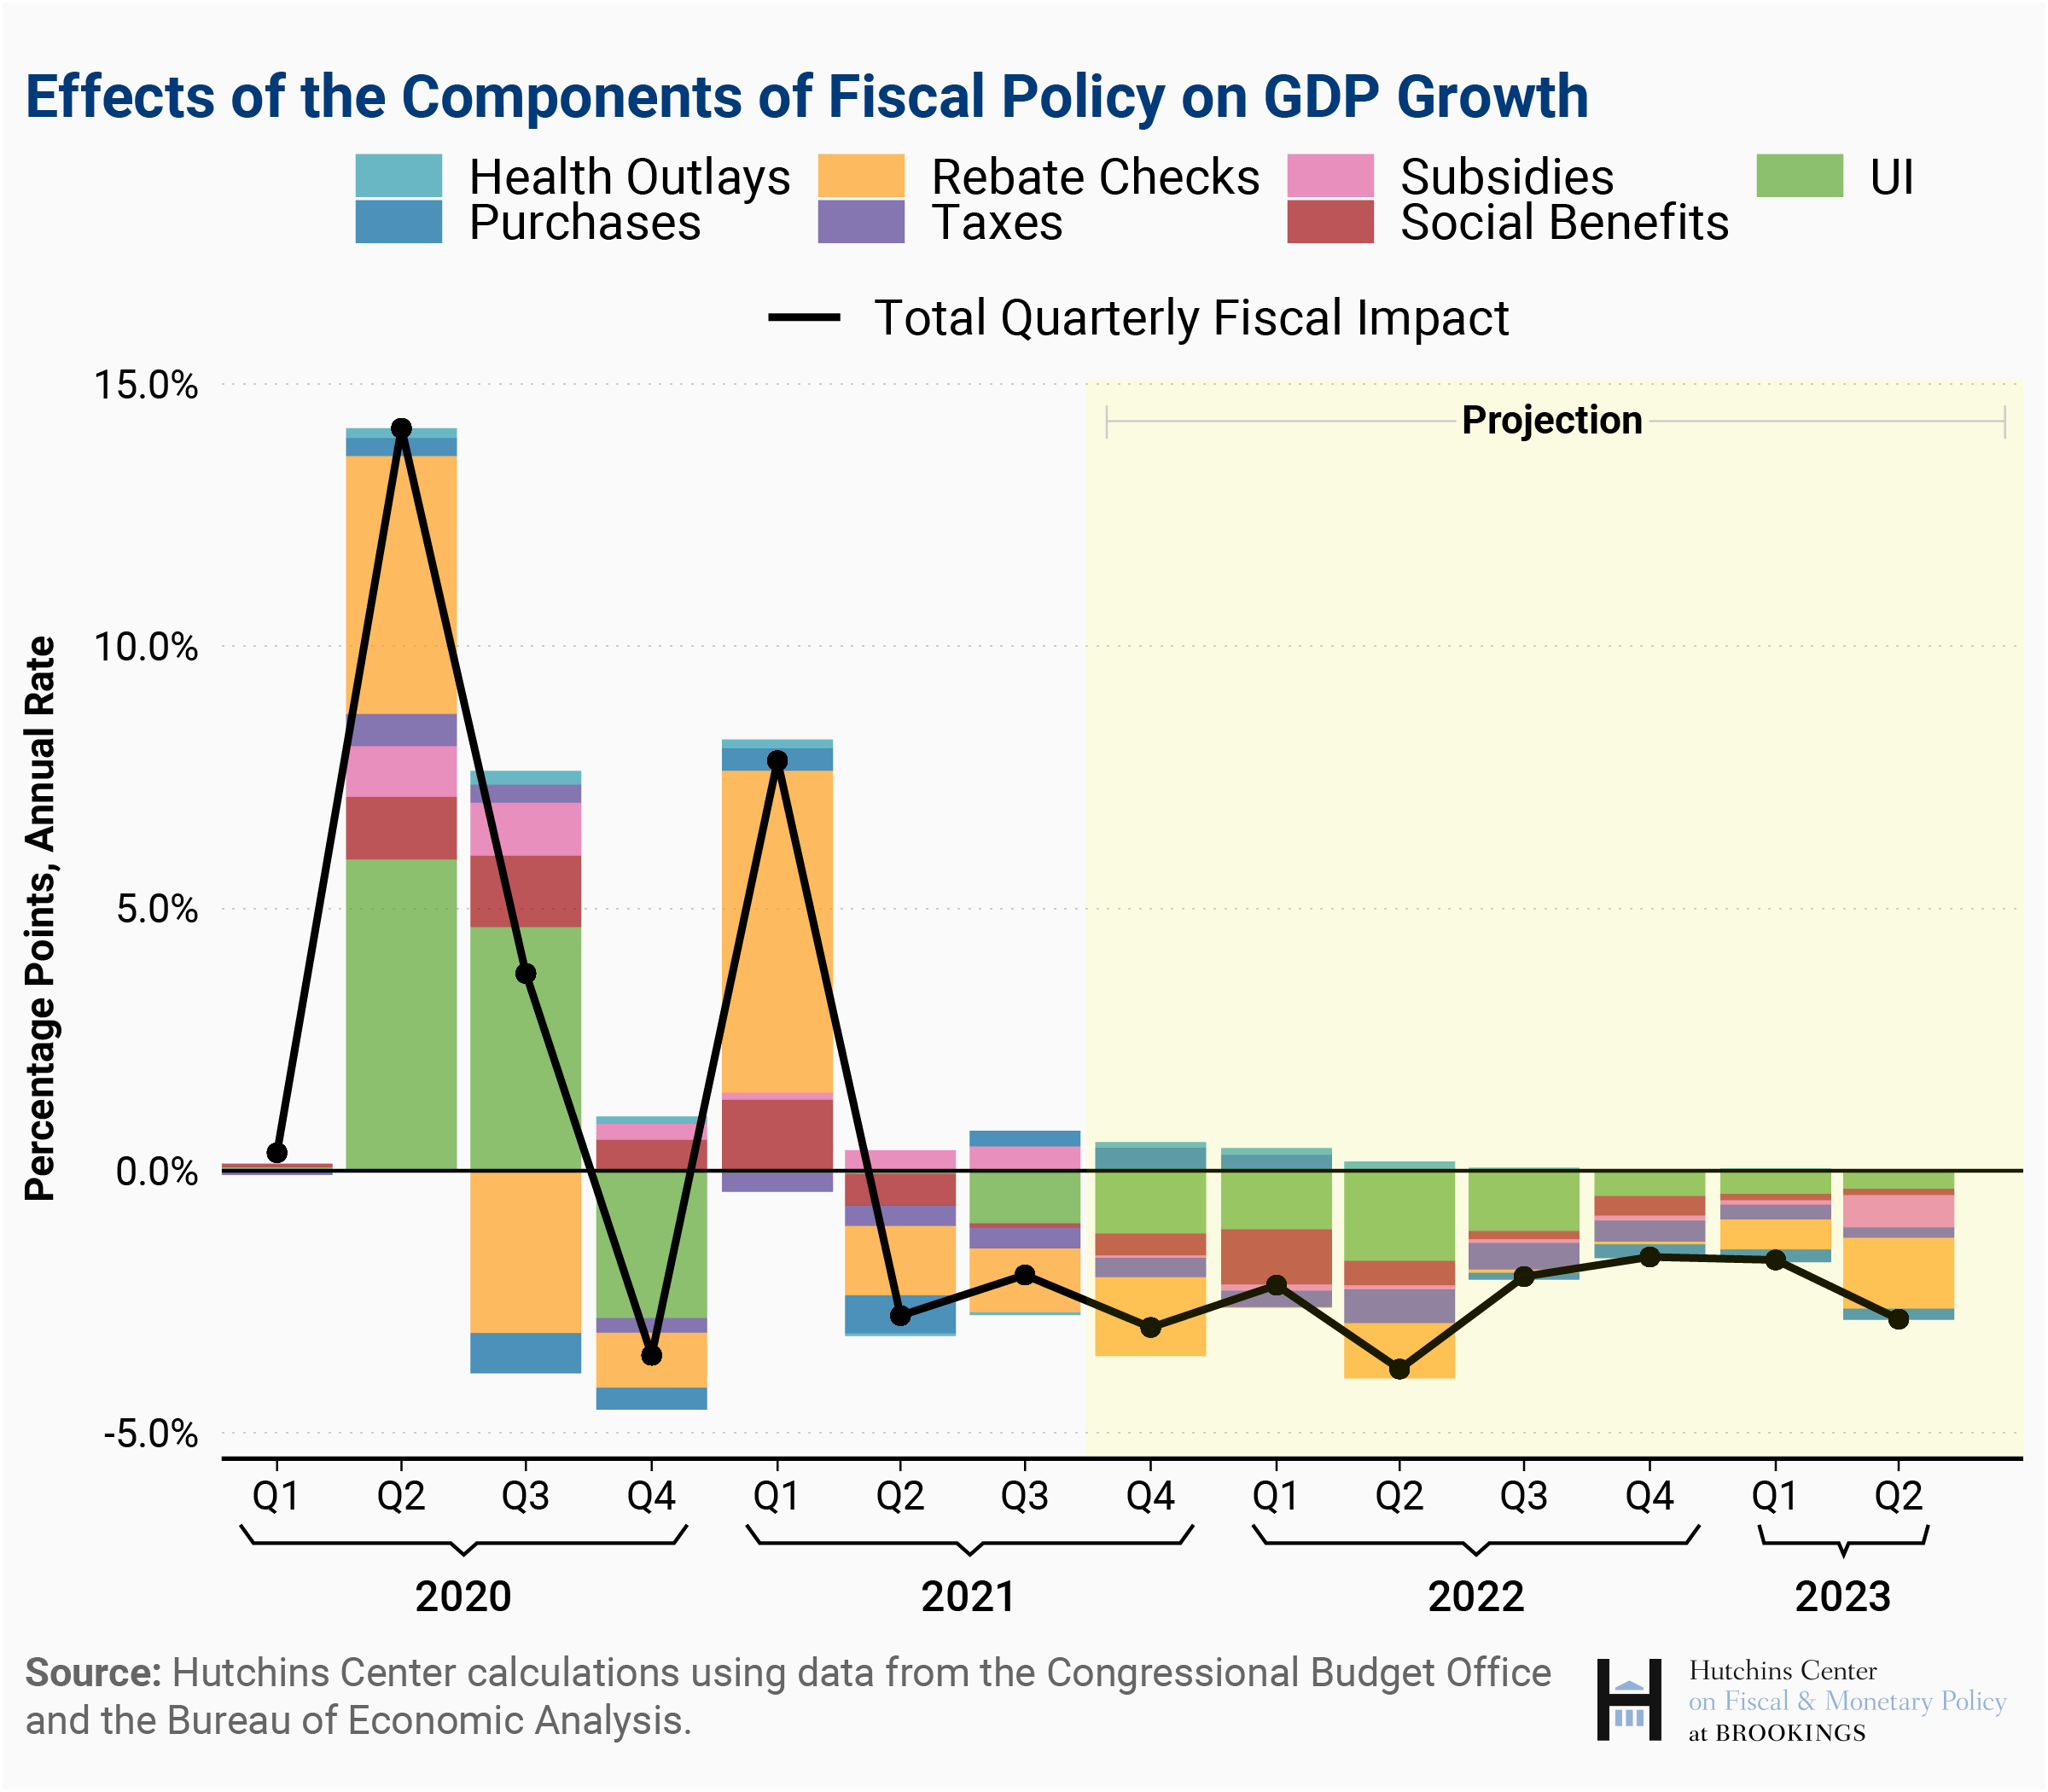
The counterfactual levels of fiscal policy used in the charts above assume taxes, purchases, and transfers grow at the rate of potential GDP from the beginning of 2020 onward. They show what would have happened to GDP had fiscal policy not expanded at all in response to the COVID-19 recession. The FIM, on the other hand, compares actual GDP in a quarter to a counterfactual in which the taxes, transfers, and spending from each previous quarter had grown with potential. And, as noted above, the FIM only measures the direct effects of fiscal policy and includes no multipliers. Still, the patterns in the FIM and those depicted above are very similar.
The chart below shows the headline FIM, broken down into the different components of fiscal policy. The largest boost to GDP growth in the early stages of the pandemic came from the large increases in spending on unemployment insurance and rebate checks. As the impetus from these programs lessens over time, these categories of spending become a negative for GDP growth.
[1] The concept of fiscal multipliers is explained in this related analysis: https://www.brookings.edu/blog/up-front/2021/01/28/the-macroeconomic-implications-of-bidens-1-9-trillion-fiscal-package/. We use the same multipliers as in that analysis.
[2] Purchases are federal, state, and local government spending on goods and services, including employee compensation. Subsidies are payments by the government to private businesses and state-owned enterprises (like airports).
The Brookings Institution is financed through the support of a diverse array of foundations, corporations, governments, individuals, as well as an endowment. A list of donors can be found in our annual reports published online here. The findings, interpretations, and conclusions in this report are solely those of its author(s) and are not influenced by any donation.
Related Content


Authors


Commentary
How pandemic-era fiscal policy affects the level of GDP
October 19, 2021