This may seem like a strange time to talk about recessions. GDP growth is strong, and as of April 2019, the unemployment rate stood at 3.6 percent, its lowest level since 1969. We are also experiencing an unusually long economic expansion. The Great Recession officially ended in June of 2009, with continuous private-sector job growth resuming in March 2010. This has resulted in the longest uninterrupted streak of job growth in recorded U.S. economic history.
While other measures of labor market health are not quite as sunny and averages do not always reflect the diverse labor market experiences of individuals or regions, the overall picture is one of a strong labor market. Yet, history tells us that good times never last, and both international tensions and various financial market indicators have recently caused some to worry. Inevitably another downturn will arrive, the consequences of which will be destructive for workers, firms, and governments. The length of this expansion raises urgent questions: when will it end, and will we see the next recession coming? The most direct approaches to identifying recessions—waiting for the National Bureau of Economic Research (NBER) to announce a recession or waiting for GDP to decline over two consecutive quarters—are appropriate for historical analysis but are too slow to be useful for policy. For example, the NBER announced the Great Recession in December 2008, a full year after the recession had already started—far too late to initiate a timely monetary or fiscal policy response. While proper planning and a timely response can mitigate the damage, these require real-time data measures that can accurately identify recessions. We believe that the unemployment rate is the most important such measure: rapid increases in it, regardless of its level, help us to quickly observe economic downturns. Of course, changes in the national unemployment rate do not tell us everything we might want to know about the health of labor markets. In particular, they do not capture the extent to which workers have left the labor force or are under-employed, both of which are important for understanding the degree of labor market slack. But increases in the unemployment rate can tell us about rapid deterioration of the labor market in close to real time. In fact, as economist Claudia Sahm writes in a new Hamilton Project at Brookings and Washington Center for Equitable Growth book, if the unemployment rate (in the form of its three-month average) is at least 0.50 percentage points above its minimum from the previous 12 months, then the economy is already in a recession. (The use of the three-month moving average of the unemployment rate smooths out small jumps or dips that can be particularly misleading when using real-time data that policymakers have in the moment.) Sahm proposes using this indicator to trigger stimulus payments to individuals when the economy is in a recession. This approach is appropriate because, as the book discusses in detail and figure 1 below shows, the indicator has both correctly signaled a recession 4–5 months following the beginning of the recession and has virtually never called a recession incorrectly since 1970. 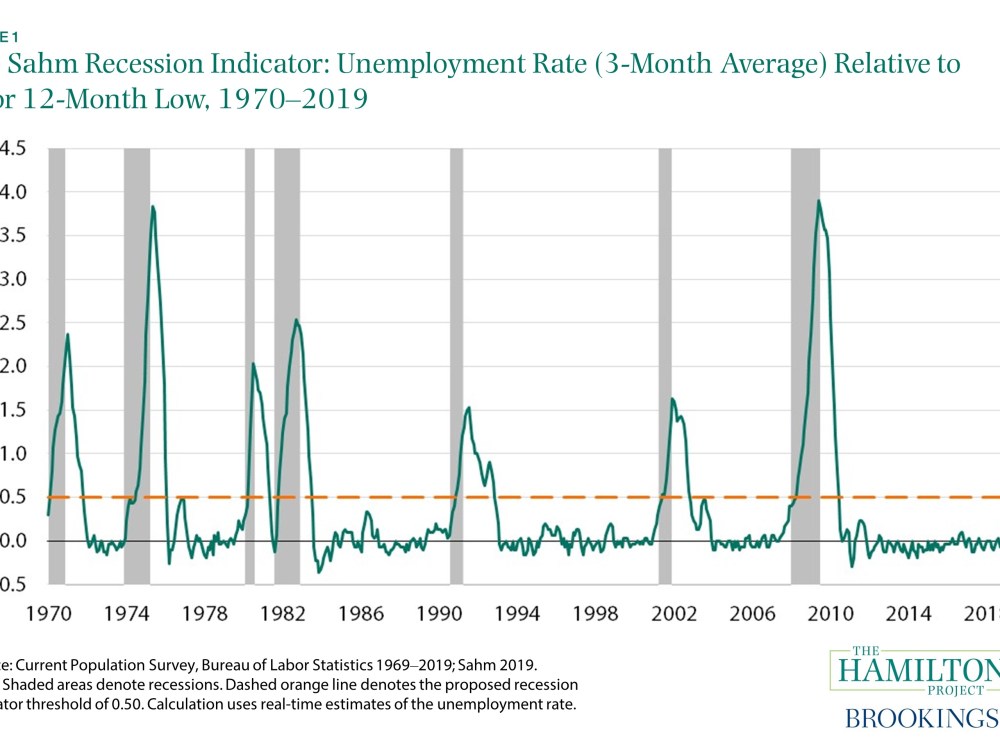 A rapid increase—even if relatively small—in the unemployment rate has been an accurate indication that a recession is underway. For example, the unemployment rate in November 2000 was reported at 4.0 percent. By June of 2001, it was 4.5 percent. While 4.0 or even 4.5 percent are low unemployment rates by historical standards, a recession had in fact begun in March of 2001, and the unemployment rate continued to rise rapidly. The Sahm indicator called this recession at the beginning of July when the unemployment data for June were released. Rapid increases are informative regardless of the level of the unemployment rate. Having an unemployment rate of 6 or even 7 percent does not necessarily mean the economy is in a recession; often when the unemployment rate is 6 or 7 percent, the economy is growing quickly in the aftermath of a recession. In addition to identifying a recession that has already started, one may also want to know how likely it is that a recession is coming. Although predicting recessions is a notoriously difficult enterprise, historical experience may be informative. New analysis in table 1 below shows the experience of the likelihood of a recession from 1970 onward at various values of the Sahm recession indicator. (We exclude months between the NBER announcement of a recession and the announcement of resumed growth; in those instances, it is already assumed the economy is in a recession.)

Consider the following illustrative examples from table 1:
- The first row shows that when the unemployment rate is below its previous 12-month low, there is virtually no chance a recession has started, and the odds of one in the next 12 months are quite low (10 percent), but even when the unemployment rate has not been rising, the odds of a recession within two years is still reasonably high (25 percent).
- The row labeled “0 to 0.09” shows that if the unemployment rate is 0.00 to 0.09 above its recent low that the odds of a recession now or soon are still vanishingly small, but by 12 months out, a recession has occurred more frequently (20 percent of the time). The row labeled “0.10 to 0.19” illustrates that if the unemployment rate is 0.10 to 0.19 percentage points above its recent minimum, then it is still almost certain that a recession has not yet begun, but the odds of a recession within 3 or 6 months are roughly the same as the baseline probability of a recession at any unemployment rate.
- The row labeled “0.20 to 0.29” shows that if the unemployment rate is between 0.20 and 0.29 percentage points above the previous 12-month minimum, the U.S. economy has been in recession about 11 percent of the time. Further, the likelihood of entering a recession increases the farther out we look. For values of the Sahm indicator between 0.20 and 0.29, the economy has entered recession within one year about 39 percent of the time. By two years out, rows two through five all show that the economy has entered a recession about 40 percent of the time, highlighting the fact that recessions happen with reasonable frequency and current conditions are not especially helpful predicting out to two years.
- The row labeled “Greater than or equal to 0.50” shows that when the unemployment rate has increased by at least half a percentage point above its minimum in the prior 12 months, the economy is effectively always in a recession. On one occasion—November 1976—a jump in the unemployment rate shortly after the end of the 1973–75 recession led to a single month of a 0.50 percentage point elevation above the 12-month minimum. (This would not have triggered payments incorrectly under Sahm’s proposal, as it occurred shortly after a deep recession and stimulus payments would still have been ongoing.)
- The bottom row shows the overall odds of a recession regardless of the unemployment rate. Outside of the months between when NBER has announced a peak and trough, the U.S. economy has been in a recession in 12 percent of months since 1970, and the odds of being in a recession or having one begin within 24 months is over one third. (Including all months, the probability of a recession in any given month is not very different: the U.S. economy has been in recession 15 percent of the time.)
Beyond demonstrating the usefulness of this simple and straightforward indicator, the table also helps show how worried about recession one should be as the unemployment rate rises. At 0.10 to 0.19 on the Sahm indicator, we should feel neither more nor less safe from recession in the next three months than if we had not examined the unemployment rate at all. Once the indicator is 0.20 or more, though, the odds of a recession within 3 months jump above twice their normal level. And once the gap is over 0.40 the odds of a recession at any horizon surpass 50 percent. But while a gradually rising unemployment rate is worrisome, recessions have typically not occurred in the past until the Sahm indicator reaches about 0.40 or 0.50 percentage points. It may be surprising that a small uptick in the unemployment rate conveys so much information about the likelihood of a recession regardless of the current level of the unemployment rate, but since 1970, a mere 0.50-percentage-point increase has effectively always indicated that a recession has already started. By contrast, the level of the unemployment rate is much less useful. By the time the national unemployment rate has risen to an alarmingly high level, the economy is generally already in a recession. This is especially relevant at a moment like today when the unemployment rate is very low. As of April 2019, when the unemployment rate dropped to 3.6 percent, the 3-month moving average of the unemployment rate was at its lowest rate of the previous 12 months—in other words, the Sahm indicator was 0.00. This suggests there is essentially no chance the U.S. economy is currently in a recession. (This rule has worked for the past 50 years, but that is of course no guarantee that it will work perfectly going forward.) It is worth noting that there are other indicators one can use to track the approach of recessions. For example, shifts in risk spreads, yield curve inversions, and other financial market data can provide useful information, but they generally signal recessions long in advance with uncertain timing and frequent false positives. Other measures, like that maintained by Jeremy Piger—based on non-farm payroll employment, industrial production, real personal income, and trade sales data—can also help assess whether the economy is in recession, as can interest rate- and unemployment-based measures created by David Miller. When identifying recessions over the last five decades, the Sahm recession indicator performs well both in terms of timeliness and accuracy against major alternatives. The simplicity of the rule—which does not rely on complex econometric techniques—makes it transparent and perhaps easier to integrate into policy as a trigger for automatic stabilizers. As a signal of economic downturns, changes in the unemployment rate are timely and informative.
The authors thank Jeremy Piger and Claudia Sahm for helpful comments; the authors are also grateful to Jimmy O’Donnell for excellent research assistance.
Related Content

Authors


Commentary
How will we know when a recession is coming?
June 6, 2019