In today’s discussions about global development often insufficient attention is paid to what we can learn from the data. What we can observe about trends over time, differences across countries, and relationships between various dimensions of development, such as how corruption impacts growth, is critical in helping us find solutions to some of today’s most pressing development challenges.
Anyone committed to evidence-based policy analysis needs to have access to data in an easy-to-manage form. Public access empowers students, experts, civil society advocates, and champions of reform within government who monitor development progress and promote further change.
It is in this spirit that we are launching the Development, Aid and Governance Indicators (DAGI), an interactive platform and databank that features indicators developed by scholars from the Brookings Global Economy and Development program. Some of these indicators on aid quality and governance have been developed in collaboration with partners (the Center for Global Development and The World Bank, respectively).
Our new interactive platform includes data on the following indicators:
- Country Programmable Assistance (CPA), which measures the amount of foreign aid available to developing countries to implement projects and programs that contribute to long-term development;
- Quality of Official Development Assistance (QuODA, produced with Center for Global Development), which assesses four dimensions of aid quality for each DAC donor country;
- Vulnerability of Aid Indexes (VAI), which measure the risk that each dollar of development aid disbursed ends up in corrupt or misgoverned recipient countries;
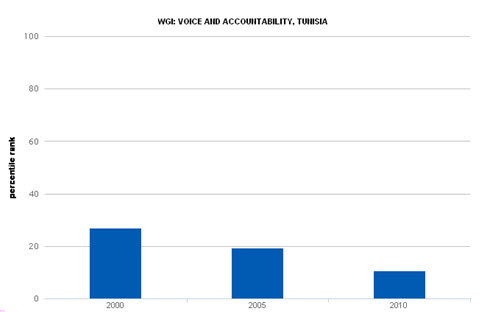
- Worldwide Governance Indicators (WGI, produced with the World Bank), which assess the quality of governance in economies on six dimensions of governance;
- Middle Class measures, which provide historical estimates and forecasts of the number of people living in the middle class, and the consumption expenditure of this group
- Poverty measures, which provide historical estimates and forecasts of the number of people living below a poverty line of $2 and $5 a day.
A number of commonly used and readily-available development variables— such as GDP per capita, maternal mortality ratios and primary school enrollment rates— have also been selected to increase the scope for analysis and to highlight the links between the indicators above and conventional development variables.
An important aim of this tool is to allow users to see and show, in interesting, powerful and graphic ways, how development indicators interact with each other, differ across countries, and change over time. Here are some examples of what can be done with this new interactive database:
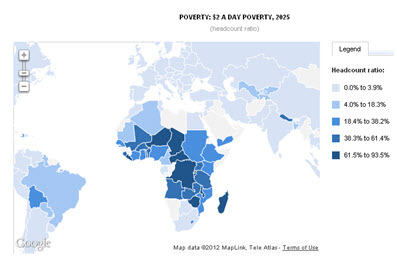
You may be interested in seeing where the world’s poor might reside in 2025. In our baseline scenario we find that high growth and demographic change in dynamic middle income countries will help them make significant progress against poverty in the coming years. However, as we see in the world map, in fragile countries, concentrated mostly in Africa, poverty will remain a critical challenge. Consequently, the global poverty problem might increasingly become an Africa problem by 2025. This growing concentration of poverty in fragile developing countries will undoubtedly have important consequences for issues like foreign aid.
You may have been surprised by the upheavals in Tunisia, Egypt, Libya, Syria and elsewhere in the Middle East. Perhaps we would all have been less taken aback had we paid closer attention to the extremely low and deteriorating quality of governance in many countries in the region. The Worldwide Governance Indicators show that on the eve of the Arab Spring there was a growing democratic governance deficit in the countries where protests emerged. The column chart shows just how quickly democratic accountability and citizen voice deteriorated from already low levels in Tunisia between 2000 and 2010. If we look closely at other countries experiencing unrest, such as Egypt, Libya, Syria and Yemen, we observe the same trend over the past decade. It was in large measure this growing democratic governance deficit that spurred unrest in the Middle East.
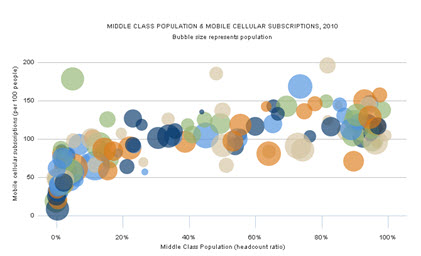
If you are interested about the increasingly important role of mobile technology and social media in global events, aspects of this can be explored in our interactive databank. We often consider mobile technology and social media as resources in countries with a well-developed middle class. Yet, we saw the power of these tools during the Arab Spring in countries with relatively small middle-class populations, such as Egypt, Syria and Yemen. As we see from the graph, mobile technologies have also penetrated countries where the middle class is just now developing. We can probably therefore expect these types of technologies to play an important role in future events in developed and developing countries alike.
These examples are just a small sampling of the many questions that can be analyzed using new indicators available through the DAGI interactive platform and databank. Which donors allocate the greatest share of aid as country programmable assistance? How effective is the aid disbursed by the largest donors, and how vulnerable is it to corruption and misgovernance in recipient countries? Can significant changes in governance happen in the short term? Which countries are expected to experience the sharpest declines in poverty and greatest increases in the middle class in coming years? This new empirical tool enables any student, scholar, policymaker and advocate to ask these types of questions and explore possible answers by using the data. After all, as Lord Kelvin once said, “if you cannot measure it, you cannot improve it.”


Commentary
Development, Aid and Governance: Connecting the Empirical Dots
July 17, 2012