Election watchers will turn toward Ohio next week, when the 2016 Republican National Convention commences in Cleveland.
While there is no shortage of national (and global) political intrigue surrounding Donald Trump’s presumed nomination, there is also an important local aspect to the proceedings. The Republic National Committee is bringing its convention to Ohio partly in hopes of gaining an edge in America’s quintessential bellwether state, which has provided an electoral majority to every presidential victor since 1964. Ohio’s voters, in turn, will view the issues discussed at the convention, and in the general election to follow (both the presidential contest and a tight Senate race), against the backdrop of their own economic experience.
Ohio’s metropolitan economy
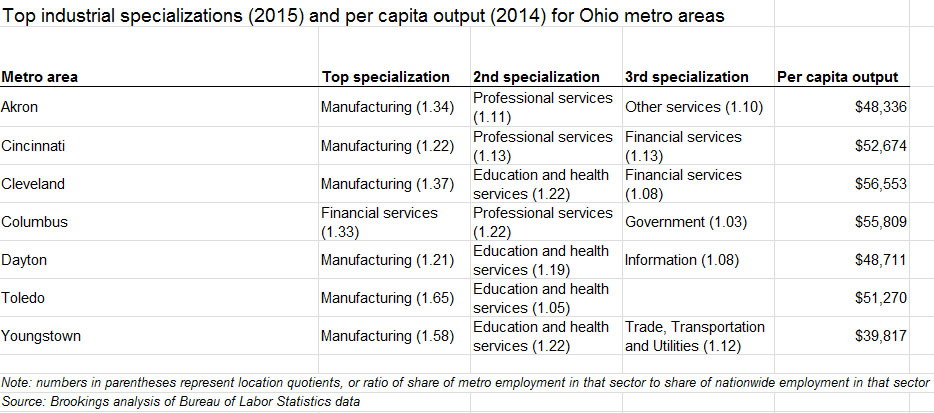
The economic perspectives of Buckeye State voters are perhaps best understood through the prism of Ohio’s major metropolitan areas, the distinctive regional economies that make up most of the state’s economy. Seven large metro areas—Akron, Cincinnati, Cleveland, Columbus, Dayton, Toledo, and Youngstown—account for 71 percent of Ohio’s population and 79 percent of its GDP, making it a more “metropolitan” state than most. These metro economies have some common features; for instance, all but Columbus have above-average shares of manufacturing workers. But they also have different specializations, from finance and professional services in Cincinnati and Columbus, to education and health care in Cleveland, to trade and transportation in Youngstown.
Short-term gain, long-term pain
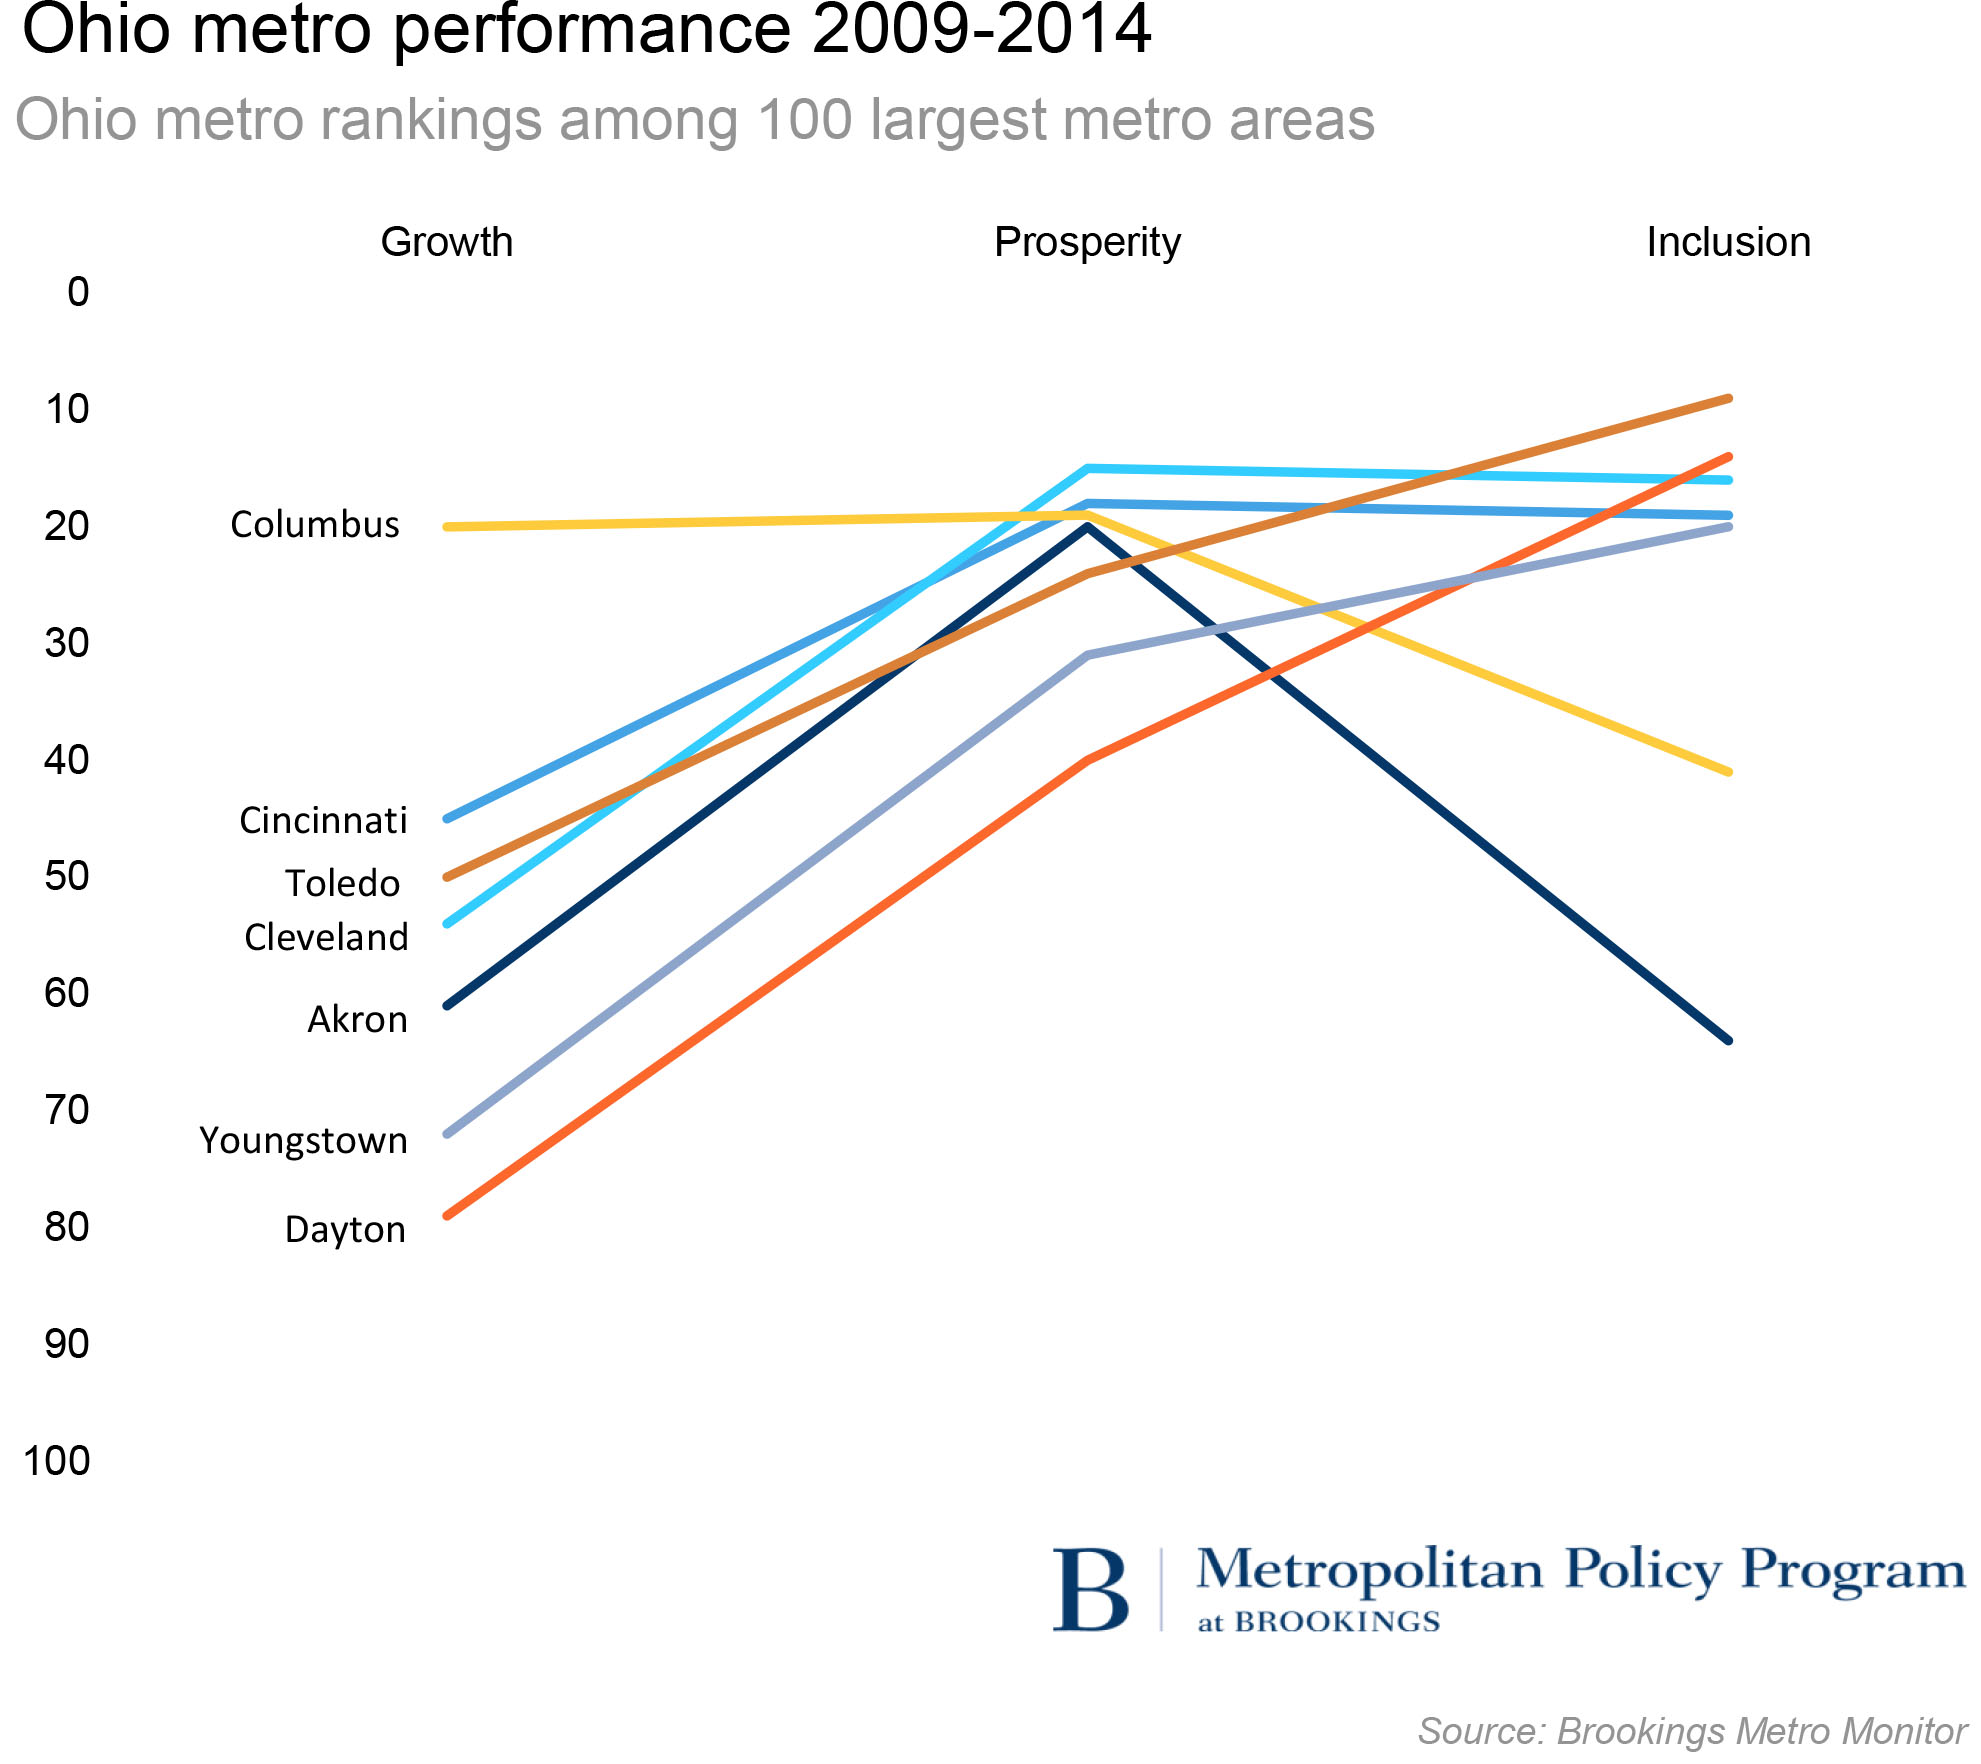
How voters from these different regions perceive their economic well-being during the 2016 contest may depend on how long a view they take. If they ask the question, “Am I better off than when President Obama took office?” residents of most Ohio metro areas would answer in the affirmative. According to the Brookings Metro Monitor, most of these metro areas ranked in the bottom half of national peers on overall economic growth from 2009 to 2014, but all outperformed those peers on measures of productivity and standard of living (prosperity), and five of the seven ranked among the top 20 on measures of increased employment rates and wages, and declining poverty (inclusion). In terms of prosperity and inclusion, Greater Cleveland posted the consistently strongest performance.
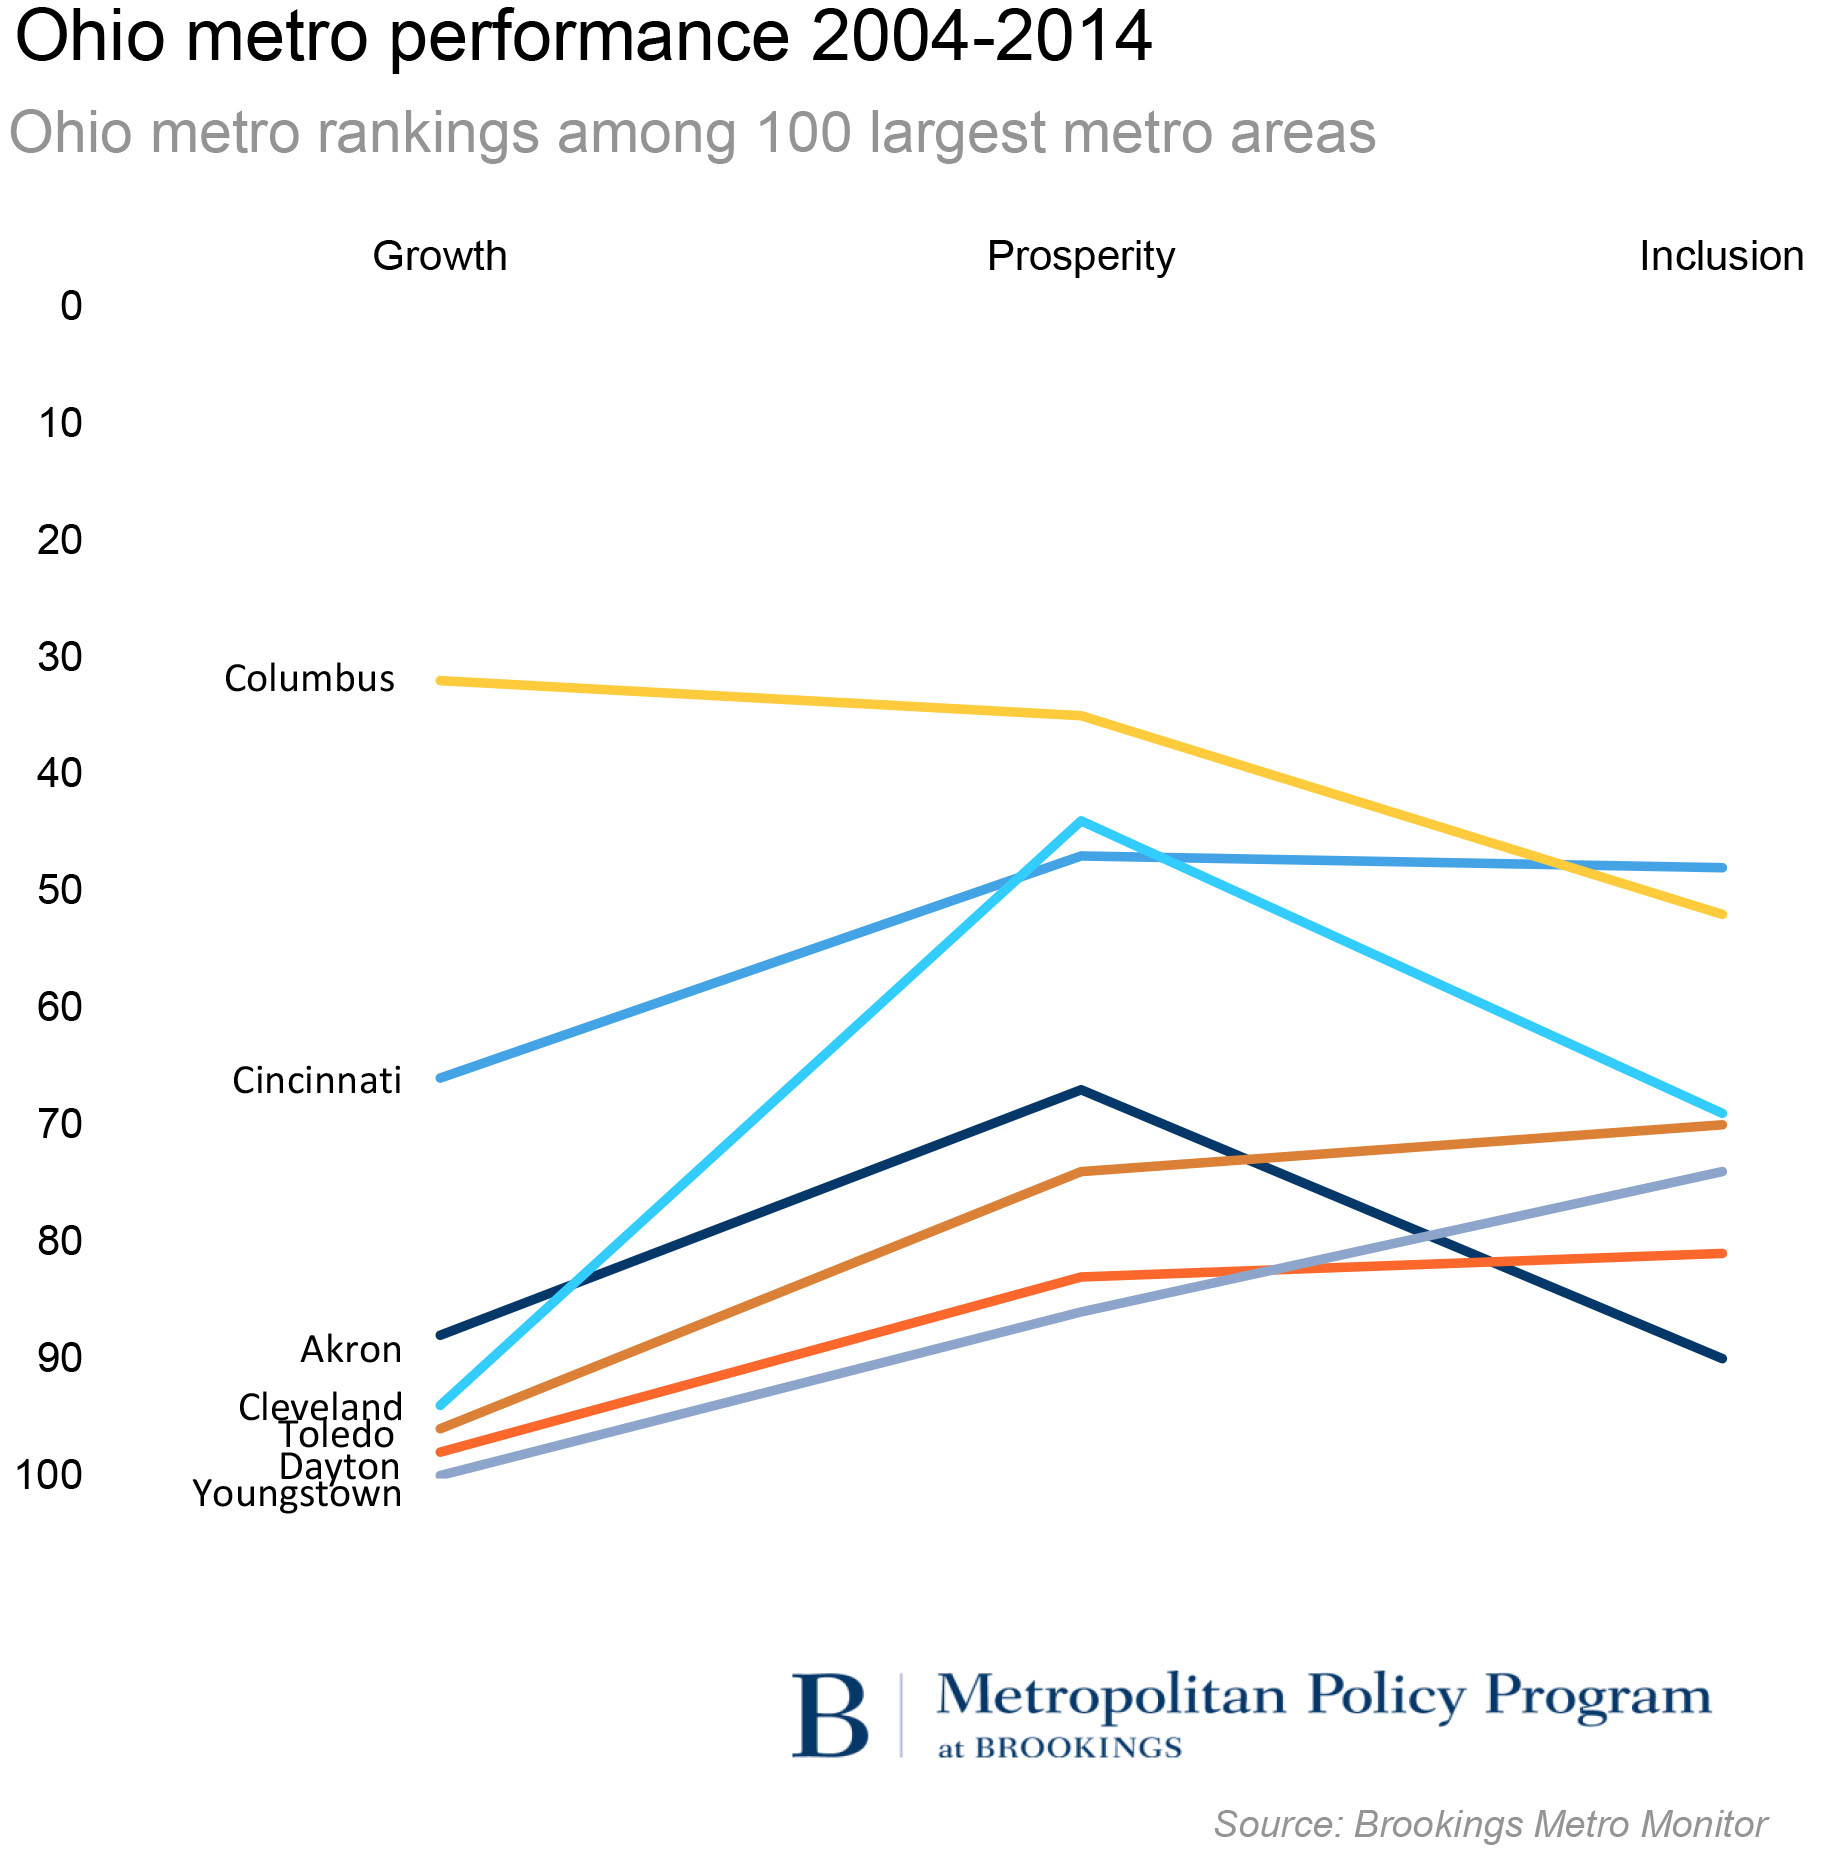
This economic assessment changes, however, across a longer time frame. Looking back to the early 2000s, most Ohio metro areas have far underperformed others across all three dimensions of growth, prosperity, and inclusion. Cincinnati and Columbus managed middling performance in most areas, but the other five metro areas ranked among the slowest growing regional economies in the country, with mostly declining employment rates and wages, and rising poverty.
These different perspectives on economic conditions in Ohio’s metro areas largely mirror manufacturing’s trajectory. The state’s manufacturing-dependent regions all shed jobs in that sector steadily through the 2000s, and then rapidly during the economic crisis of 2008-2009. While manufacturing employment rebounded in the wake of that crisis, particularly in the auto sector, it is still well below its levels from a decade ago—anywhere from 17 percent to 28 percent—in Akron, Cleveland, Dayton, and Youngstown.
Growing racial disparities
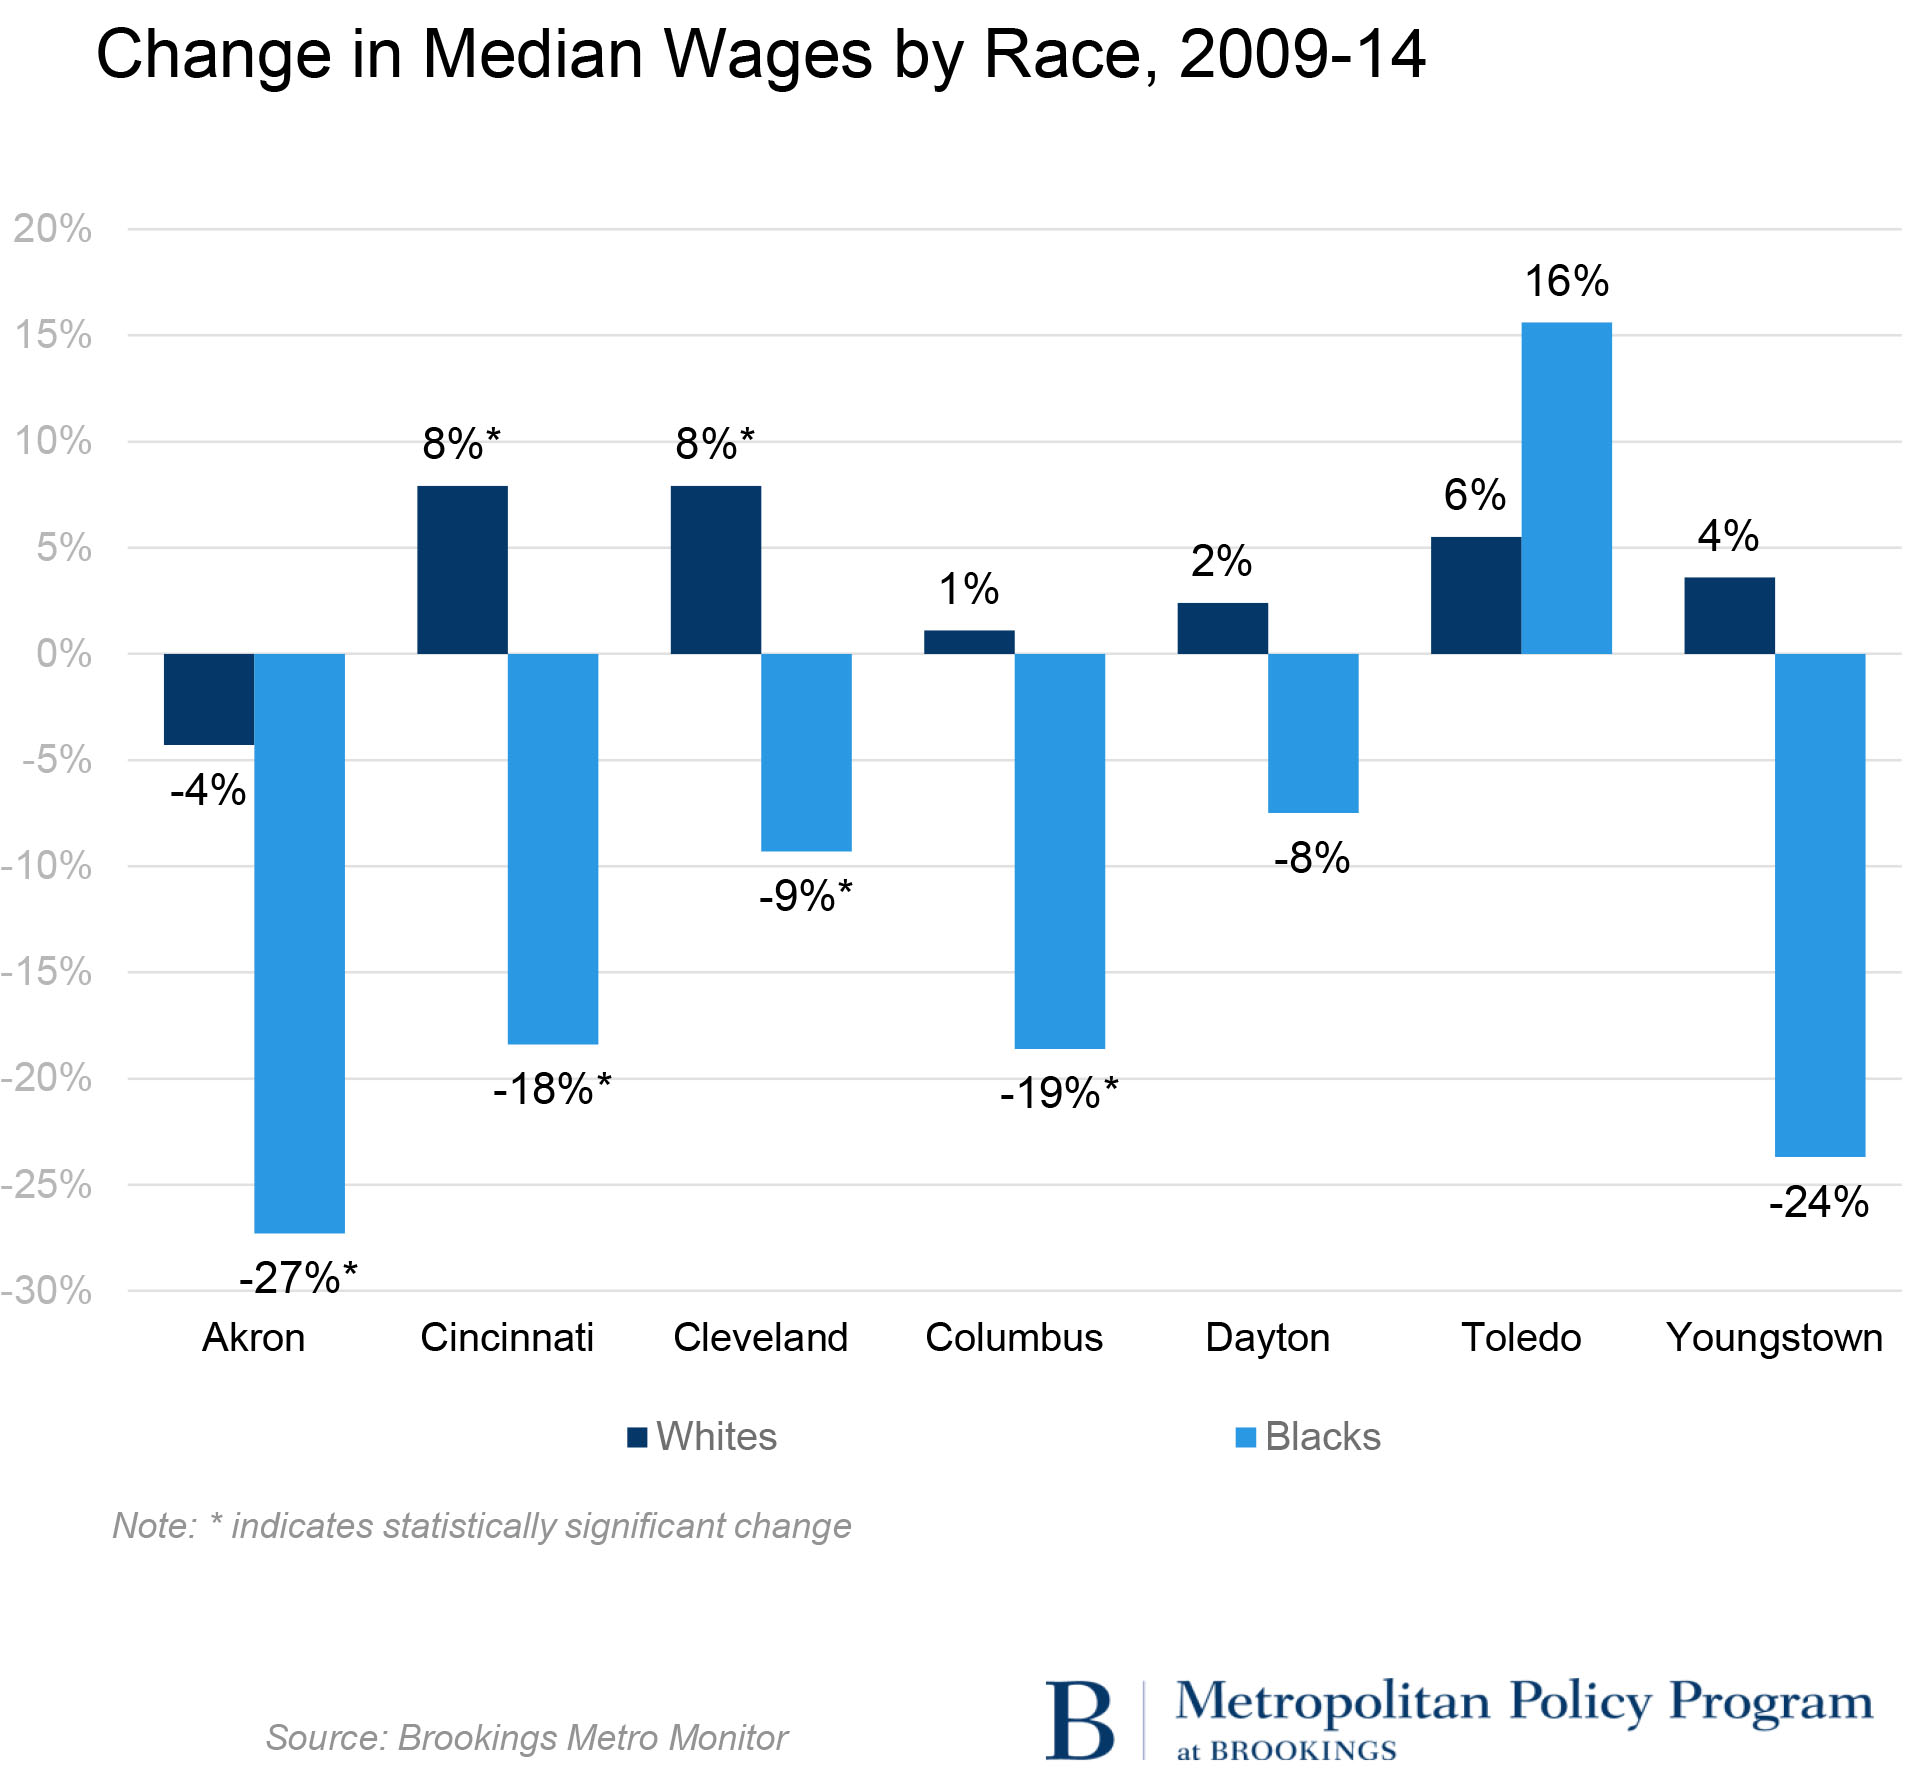
And although Ohio’s metro areas have generally posted rising employment rates and wages over the recovery, in most regions those gains have accrued disproportionately to white residents. Six of the seven metro areas (Toledo excepted) ranked in the bottom fifth of metro areas on changes in economic inclusion from 2009 to 2014. In those regions, median wages typically fell for nonwhite (largely African American) workers, rose for whites, or both. Nonwhites also bore the brunt of increasing poverty and falling wages and employment in most Ohio metro areas stretching back to 1999. Again, the loss of manufacturing jobs, particularly those that employed workers with lower levels of formal education, affected those groups disproportionately.
Worrisome recent job trends
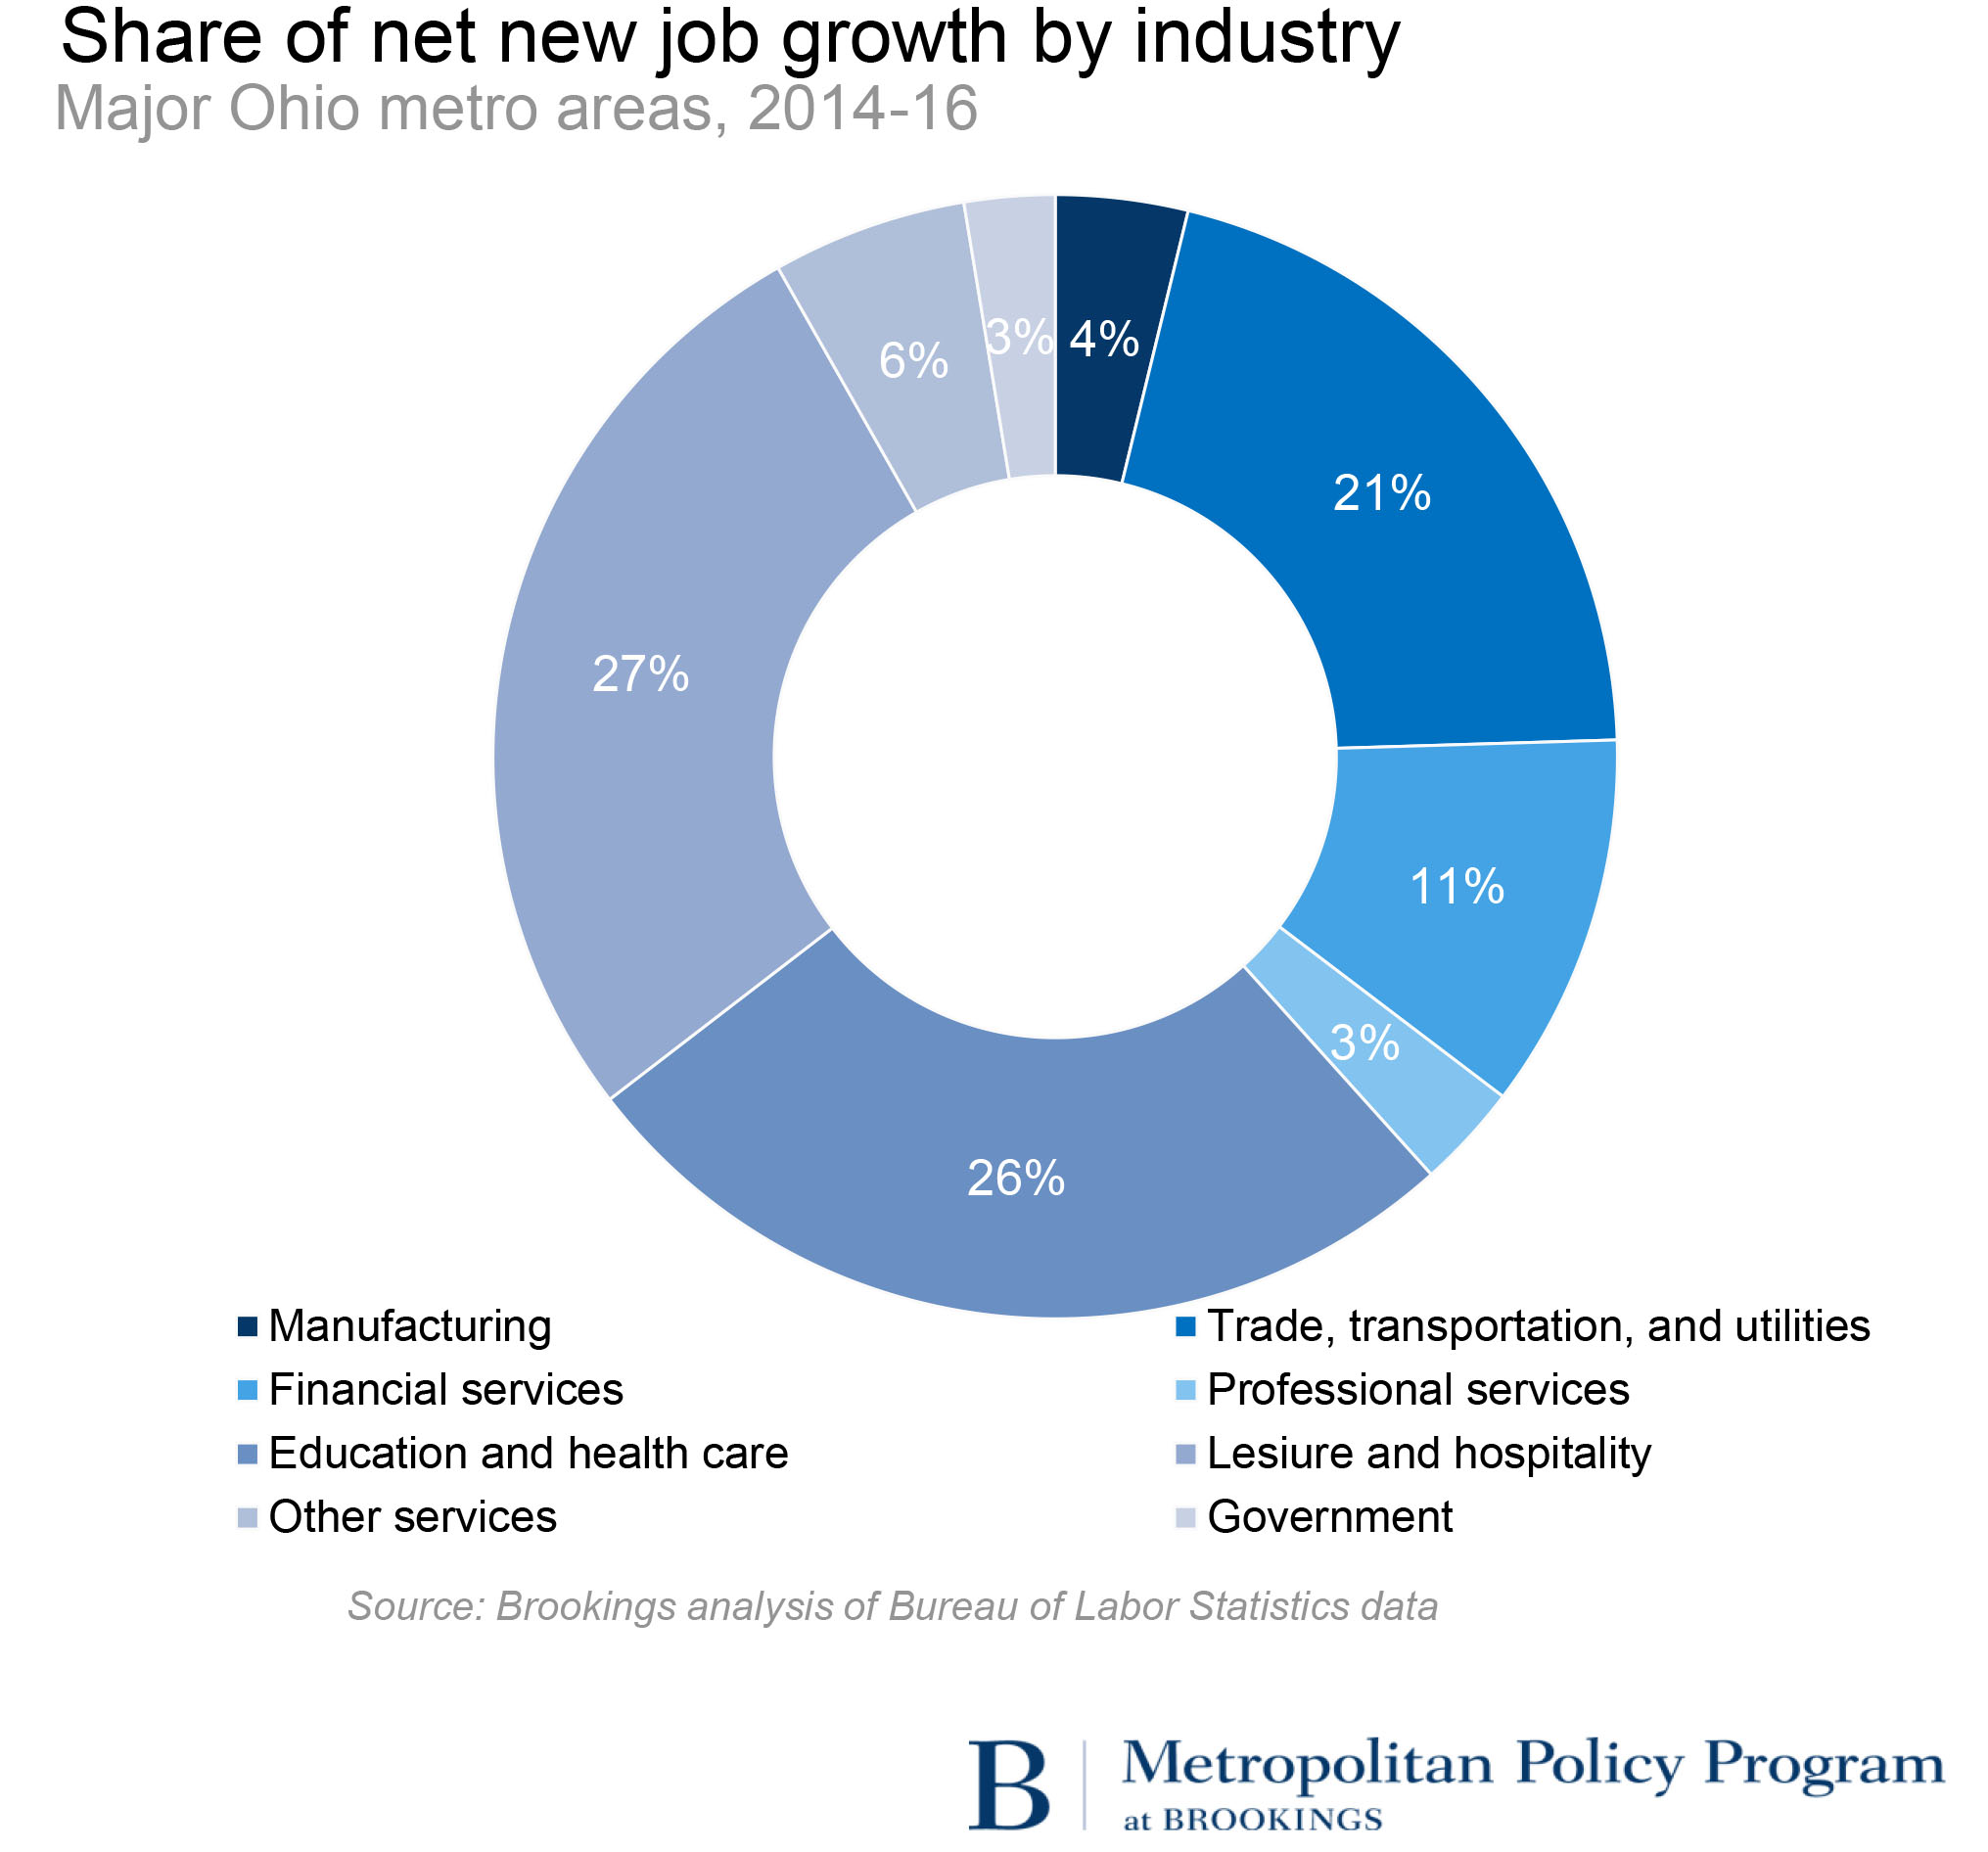
Finally, very recent employment trends in Ohio metro areas raise additional uncertainty about the regions’ economic direction. Of the net new jobs added in major economic sectors from 2014 to 2016 across the seven metro areas, the strongest growth came in leisure and hospitality, traditionally a low-paying industry. Growth was also robust in trade, transportation, and utilities, a sector in which lower-paying retail jobs also tend to dominate. Columbus posted relatively balanced employment growth across sectors, but Cleveland shed jobs in manufacturing and professional services, even as it posted large employment gains in education and health care and hospitality.
Where Ohioans ultimately stand on election-year issues like trade, immigration, taxes, and education may thus depend on where they sit, both geographically and demographically. Despite these differences, the important yet precarious advantages that Ohio regions still share in advanced manufacturing suggests an opening for candidates to present an affirmative vision for how Washington can support America’s industrial success—through investment in research, training, and infrastructure—in a competitive global economy. Next week’s proceedings may offer some clues as to whether at least one major party will compete for Ohio’s metro voters in that way.
Related Content


The Brookings Institution is committed to quality, independence, and impact.
We are supported by a diverse array of funders. In line with our values and policies, each Brookings publication represents the sole views of its author(s).


Commentary
Ohio’s metro economies: A 2016 election profile
July 13, 2016