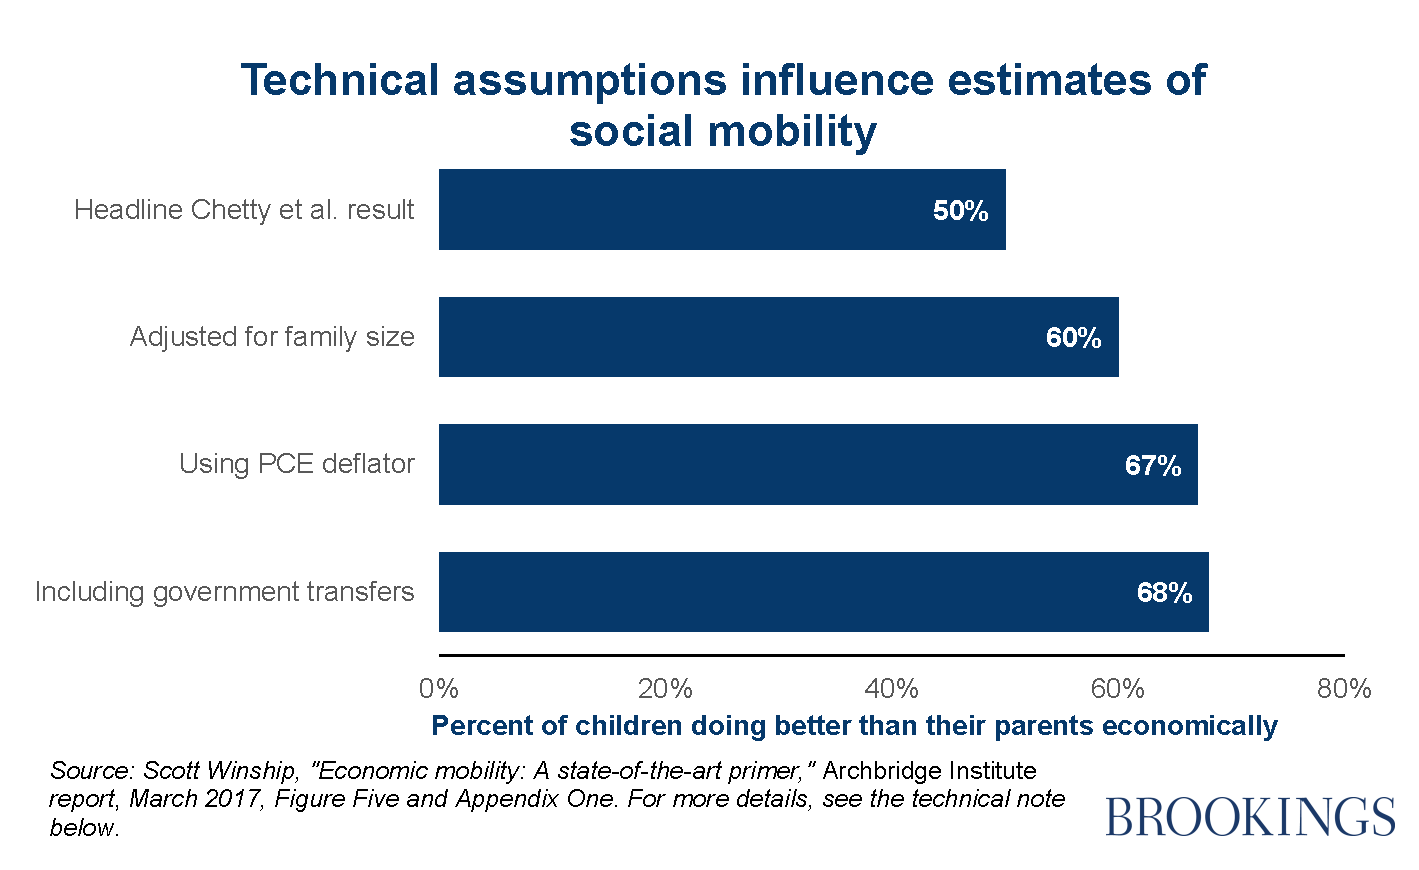
Most of us hope, perhaps even assume, that our children will have a better standard of living than we do. So the “Chetty-bomb” finding from December that only 50% of Americans born in the early 1980s are better off than their parents got plenty of attention.
Given the quality of the research team – Raj Chetty, David Grusky, Maximilian Hell, Nathaniel Hendren, Robert Manduca, and Jimmy Narang – and of the rich tax data they used for the analysis, it is no surprise that the paper prompted multiple headlines about the death of the American dream.
But the paper is not the final word. Academic arguments over the true level of absolute mobility have been raging for years and continue to do so. See for example this new working paper by Jonathan Davis and Bhashkar Mazumder. In an earlier piece of our own, cited by Chetty et al., we showed that even small changes in methodology can produce big changes in results.
A salvo has just been fired by Scott Winship, formerly of Brookings and the Manhattan Institute and now leading a project on social capital and mobility for the Congressional Joint Economic Committee. (The paper, published by the new Archbridge Institute, is also the most comprehensive overview of recent work in intergenerational mobility).
Change 1: Adjust for family size
Winship starts with the headline Chetty finding of 50%, but then applies an adjustment for family size. This boosts the rate to 60%. As he explains: “With smaller contemporary families, the same amount of money goes further than in the past, so absolute mobility is understated if incomes are not adjusted for the smaller number of mouths to feed.”
Change 2: Use a different deflator
For the next two changes, Winship replicates Chetty et al.’s findings using a different dataset, the Panel Survey of Income Dynamics (PSID), since he does not have access to the tax data used by Chetty’s team. (The good news is that results from the two, under the same assumptions, line up very well: under the same assumptions, he gets a result of 64% compared to a 62% result from the Chetty data). He then applies the Personal Consumption Expenditures (PCE) deflator, rather than the CPI-U-RS used by Chetty. Winship argues that the PCE provides a better measure of cost of living, since it takes account of “upper-level substitution”, i.e. switching consumption from apples to oranges, coffee to tea, or beef to pork when the relative prices of the two change. This pulls the result up to 67%.
Change 3: Include income from government transfers
Related Content


Last, Winship adds the income from government transfers, including safety net benefits like those from Temporary Assistance for Needy Families and benefits like unemployment insurance (UI). This nudges the overall rate up to 68%. The fact that adding transfer makes such a small difference is likely good news, since it suggests (consistent with other research) that the poor largely surpass their parents’ income even before any transfers. Importantly, Winship does not include non-cash government transfers and employer benefits, meaning that his estimates may even understate mobility.
There are other factors that could be taken into account here, not least the Great Recession. The economic crisis obviously had a dramatic downward impact on incomes and therefore absolute mobility rates for those turning 30 since 2007, who are the most recent cohorts studied by Chetty. For the earlier cohort born in the mid-1970s and so aged 30-year-olds between 2005 and 2007, just before the recession hit, Winship estimates absolute mobility rates of over 70%.
The mobility debate: It’s not over yet
Winship’s conclusion:
“Improving the income measures in Chetty paper would show that roughly two-thirds of today’s adults are better off than their parents were at the same age. Prior to the Great Recession, around three in four 30-year-olds were better off.”
To be clear: Winship thinks the downward trend in mobility rates shown by Chetty is right. He simply thinks that mobility levels remain relatively high. There’s plenty more in his paper too, including an analysis of absolute mobility rates by income level, coefficients of intergenerational elasticity, and income-rank associations. By contrast to his more upbeat assessment of absolute mobility, Winship produces lower estimates of relative mobility than most previous studies. Perhaps most interesting, he generates new mobility estimates from correlations of sibling incomes, which we will be writing about soon.
Many of the empirical points made by Winship were anticipated and discussed by Chetty and his team, who have done more to deepen our empirical understanding of opportunity in America than any other research group. But as they would be the first to say, there is no holy scripture in social science. No finding, however robust, can be read as gospel. The debate goes on.
Technical note: The bar labeled “headline Chetty et al. result” shows the most commonly reported figure from the 2016 Chetty et al. paper on absolute mobility. The second bar uses a family size adjustment by dividing income by the square root of family size. The next two bars are constructed from Winship’s replication of Chetty et al.’s methodology using the PSID data set. (Given data limits, Winship then is forced to analyze a slightly different birth cohort (those born between 1980-1982 instead of those born in 1984) but he reconciles his numbers satisfactorily with Chetty’s data.
Authors

The Brookings Institution is committed to quality, independence, and impact.
We are supported by a diverse array of funders. In line with our values and policies, each Brookings publication represents the sole views of its author(s).


Commentary
How to lift the U.S. mobility rate from 50% to 68% in three simple steps
April 13, 2017