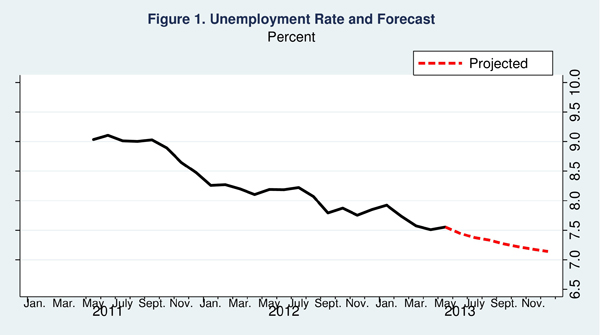
The unemployment numbers for May were slightly higher than expected as of last month’s forecast because of a blip in workers’ transition rate out of the labor force—although it is likely to be transitory. Going forward, the contour of the forecast is broadly unchanged compared to last month, but the anticipated decline in unemployment is not as strong, in part because of disappointing news on the job openings front.
This post discusses my monthly update of the Barnichon-Nekarda model. For an introduction to the basic concepts used in this post, read my introductory post (Full details are available here.)
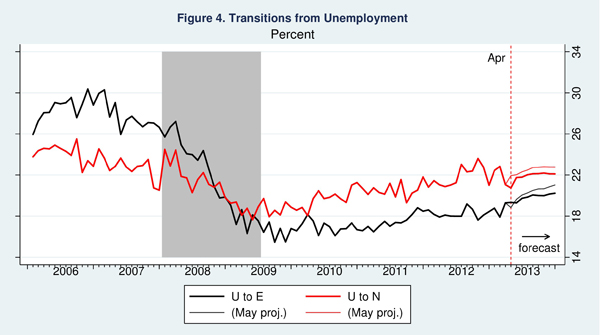
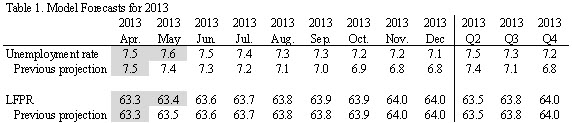
In April, the unemployment rate increased to 7.55% (rounded to 7.6%), higher than the model’s forecast (7.44%, rounded to 7.4%, see Table 1). Each month, the labor market is characterized by large flows of workers transiting between employment, unemployment or out-of-the-labor-force (see my introductory post for a refresher on the worker flow view of labor market). In particular, each month, a fraction of the unemployed stop searching for a job and leave the labor force—possibly because of discouragement in finding a job (the U-N transitions, Figure 4). Last month, that fraction was smaller than anticipated (perhaps because of less discouragement), which caused both the unemployment rate and participation rate to increase. However, the model sees this as a transitory blip that will revert itself next month, and the contour of the forecast is not affected by this change.
Going forward, the model anticipates a labor market recovery, albeit at a slower pace than previously thought: the jobless rate is now projected to reach 7.1% by December 2013, a somewhat higher level than the 6.8% expected as of last forecast (Figure 1).
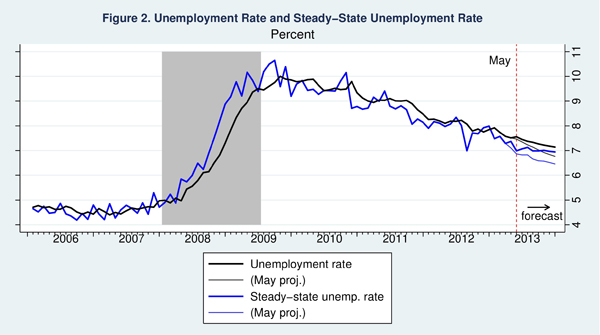
The intuition for this forecast is easily understood by looking at the projected behavior of the “steady-state” unemployment rate. The steady-state unemployment rate—the rate of unemployment implied by the underlying labor force flows, represented by the blue line in figure 2—stands currently at 7%. Our research shows that the actual unemployment rate converges toward this steady state. With a steady-state unemployment rate at a significantly lower level than the actual rate (7 versus 7.6, a 0.6 percentage point difference), this “steady-state convergence dynamic” is strongly pushing the unemployment rate down, implying a fast decline in unemployment going forward. However, the model anticipates the steady-state unemployment rate (SSUR) to hover around 7% over the next 6 months, in contrast to last month’s more upbeat forecast that anticipated a strong decline in the SSUR (figure 2). The steady-state convergence dynamic will thus become weaker as the unemployment rate converges to 7 percent, implying a decelerating rate of decline until the end of the year.
To forecast the behavior of steady-state unemployment (and hence of the actual unemployment rate), the model propagates forward its best estimate for how the flows between employment, unemployment and out-of-the labor force will evolve over time. With disappointing news on the job openings front (job openings actually declined in May), the model now anticipates a slower increase in workers’ job finding rate over the next several months (UE, figure 4) and thus a slower decline in the steady-state unemployment rate.
To read more about the underlying model and the evidence that it outperforms other unemployment rate forecasts, see Barnichon and Nekarda (2012).


Commentary
Lower Unemployment Projected for June, but Future Jobs Recovery Will Be Slower
July 3, 2013