The American states have been called “laboratories of democracy,” because they have a fair degree of autonomy and are able to do things differently from one other. Often the states lead the way for the federal government, as they have on issues such as legalized marijuana and gay marriage. While the lack of a uniform policy can be frustrating at times, the advantage of the federal system is that states can learn from one another, and so can the federal government. But they cannot do so unless they can determine which state experiments are succeeding and which are not. This is even more important when getting it right is a matter of life and death, as it is with the management of the COVID-19 pandemic.
The distribution of effective vaccines offers the best hope for halting the pandemic, reopening the economy, and restoring normal social life. Which states seem to be doing the best job of doing this, and how can we know?
In this blog we’ll look at several metrics on which to compare states. Table 1 compares state performance along two dimensions—the percentage of state residents who have received at least one vaccination and the percentage who have received both, as of February 15. They are ranked from 1 to 51 (including the District of Columbia) based on the share of state residents with at least one shot.
Table 1: Aggregate performance
| State | Percentage receiving at least one shot | Percentage receiving both shots |
| 1.Alaska | 18.2 | 8.9 |
| 2. Connecticut | 14.7 | 6.5 |
| 3. New Mexico | 14.6 | 6.9 |
| 4. West Virginia | 14.2 | 8.3 |
| 5. North Dakota | 13.7 | 6.6 |
| 6. Massachusetts | 13.2 | 4.4 |
| 7. South Dakota | 13.2 | 6.2 |
| 8. Wisconsin | 13.1 | 4.6 |
| 9. Maine | 13.0 | 4.9 |
| 10. Wyoming | 13.0 | 5.2 |
| 11. Montana | 12.8 | 5.0 |
| 12. Vermont | 12.8 | 6.2 |
| 13. Virginia | 12.6 | 4.6 |
| 14. Washington DC | 12.6 | 5.9 |
| 15. Colorado | 12.6 | 5.6 |
| 16. Arizona | 12.6 | 3.9 |
| 17. Delaware | 12.5 | 3.9 |
| 18. New Jersey | 12.4 | 4.9 |
| 19. Minnesota | 12.4 | 4.6 |
| 20. Oklahoma | 12.3 | 5.3 |
| 21. California | 12.4 | 4.0 |
| 22. Hawaii | 12.3 | 5.2 |
| 23. Illinois | 12.2 | 3.5 |
| 24. Washington | 12.0 | 4.3 |
| 25. Iowa | 12.0 | 3.9 |
| 26. Indiana | 11.9 | 4.8 |
| 27. Florida | 11.9 | 5.7 |
| 28. North Carolina | 11.8 | 5.2 |
| 29. Oregon | 11.8 | 5.0 |
| 30. Kentucky | 11.6 | 4.6 |
| 31. Michigan | 11.6 | 5.5 |
| 32. New Hampshire | 11.6 | 5.1 |
| 33. Pennsylvania | 11.5 | 4.0 |
| 34. Ohio | 11.5 | 4.4 |
| 35. Arkansas | 11.5 | 4.7 |
| 36. Louisiana | 11.5 | 5.6 |
| 37. Nevada | 11.3 | 3.8 |
| 38. New York | 11.2 | 5.1 |
| 39. Maryland | 11.0 | 4.4 |
| 40. Idaho | 10.9 | 4.0 |
| 41. South Carolina | 10.9 | 3.9 |
| 42. Nebraska | 10.7 | 5.0 |
| 43. Mississippi | 10.7 | 4.0 |
| 44. Texas | 106 | 4.3 |
| 45. Missouri | 10.5 | 4.2 |
| 46. Kansas | 10.4 | 3.9 |
| 47. Alabama | 10.3 | 3.4 |
| 48. Rhode Island | 10.2 | 4.9 |
| 49. Tennessee | 10.1 | 4.7 |
| 50. Georgia | 10.1 | 4.4 |
| 51. Utah | 10.1 | 3.9 |
| United States | 12.0 | 4.9 |
Sources: CDC data tracker as of 2/19/21 and authors’ calculations
Including the second measure—percentage of residents receiving both shots—enables us to test one of the several plausible hypotheses: some states may be doing worse on the first measure because they have given a higher priority to stockpiling doses for second shots. Table 1 challenges this hypothesis, however. Eight of the ten states doing the best on the first measure are also performing at or above the national average on the second, and 10 of the 13 doing the worst on the first measure are performing poorly on the second as well.
Going on to another important measure of state performance, we look at efficiency, defined as the percentage of doses each state receives from the federal government that have been delivered into people’s arms. The results of this measure are displayed in Table 2.
Table 2: Efficiency
| State | Vaccinations as a percentage of doses received |
| 1. New Mexico | 100 |
| 2. North Dakota | 96 |
| 3. West Virginia | 91 |
| 4. Montana | 91 |
| 5. Utah | 89 |
| 6. Virginia | 88 |
| 7. South Dakota | 87 |
| 8. New Jersey | 86 |
| 9. Arizona | 86 |
| 10. Oklahoma | 86 |
| 11. Louisiana | 86 |
| 12. Delaware | 85 |
| 13. North Carolina | 84 |
| 14. Washington | 84 |
| 15. Wisconsin | 84 |
| 16. Connecticut | 83 |
| 17. Wyoming | 83 |
| 18. South Carolina | 83 |
| 19. Idaho | 83 |
| 20. Texas | 82 |
| 21. Colorado | 82 |
| 22. Florida | 81 |
| 23. New York | 81 |
| 24. Oregon | 81 |
| 25. Missouri | 80 |
| 26. Minnesota | 80 |
| 27. Massachusetts | 80 |
| 28. Michigan | 79 |
| 29. Nevada | 79 |
| 30. Iowa | 78 |
| 31. Vermont | 78 |
| 32. Indiana | 77 |
| 33. Ohio | 77 |
| 34. Hawaii | 77 |
| 35. Kentucky | 76 |
| 36. Maine | 75 |
| 37. Illinois | 75 |
| 38. California | 74 |
| 39. Maryland | 74 |
| 40. Arkansas | 74 |
| 41. Alaska | 73 |
| 42. Pennsylvania | 73 |
| 43. Georgia | 73 |
| 44. Tennessee | 72 |
| 45. Kansas | 72 |
| 46. Nebraska | 71 |
| 47. Mississippi | 71 |
| 48. New Hampshire | 71 |
| 49. Rhode Island | 68 |
| 50. Washington DC | 67 |
| 51. Alabama | 65 |
| United States | 80 |
Source: CDC Tracker as of 2/19/21.
Comparing Tables 1 and 2 helps us determine whether states that have inoculated high percentages of their population have done so because of high efficiency in their vaccinations, or because for some reason they have received above-average shares of doses from the federal government. Of the 10 states that ranked at the top in their share of population receiving at least one dose, 8 are well above the national average for efficiency as well, and Maine and Alaska are below average.
Alaska is the principal outlier, and it’s not hard to see why. While the average state has received 22.3 doses per hundred population, Alaska has received 37.1. The state’s unusual topography and demography may help explain this anomaly.
Previous articles in this series have explored some tentative explanations for differences in performance among states. Another possibility is that there is a relationship between a state’s population and its performance. Of the 10 jurisdictions ranked at the top in vaccinations per capita, all but one—Massachusetts—have populations below the national mean state population (about 6.5 million) and below the median state (Kentucky, with 4.5 million) as well. Is there a small-state advantage, even though many of them are sparsely populated, with long driving times to even small population centers? If so, why?
One possibility is that high-performing states have more vaccination sites than other states—making it easier for people to reach the sites and increasing the chances that citizens feel more comfortable and more trusting at a local drug store or health center. In the graph below we researched the number of sites per state and then, to control for the size of the state we converted those numbers into the number of sites per 100,000 population.[1] We then plotted that number against the percentage of vaccine doses administered. Across the country, the average number of vaccine sites per 100,000 population is 6.18. Of the top ten states in terms of sites per capita, 3 are firmly in the middle of the states in performance—Iowa, Missouri and Minnesota have 28, 30 and 23 sites per 100,000 population. West Virginia, the state that has consistently out-performed other states in terms of vaccinations administered has 13.9 sites per 100,000 residents but Utah, also a high performer, administers vaccines through 47 pharmacies and 13 local health departments, which means it only has 1.87 sites per 100,000 population. The relationship between number of sites and vaccines administered does not seem to be robust.
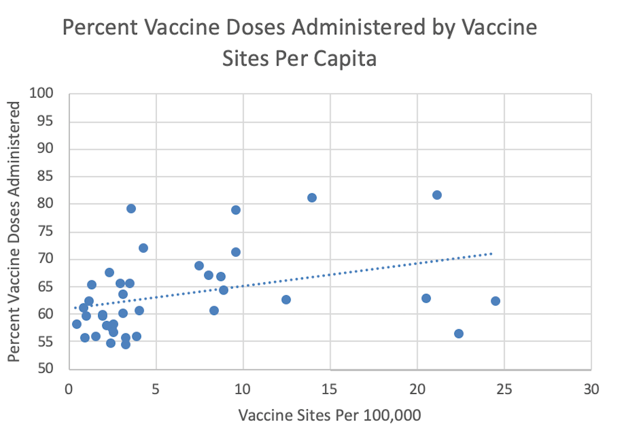
Sources: U.S. Census, State departments of health.
Finally, we have hypothesized in the past that in some places, vaccines may have been reserved for two groups which were high on the priority list—residents and workers in nursing homes—but which didn’t end up using them. Last year the CDC allotted doses based on the number of beds—not the number of patients in beds. As more and more information has come out it is clear that too many vaccines have been held on shelves by the pharmacy companies charged with delivering the vaccines.
While states were holding onto vaccines for nursing home residents, the number of these residents nationally plummeted in 2020. The following graph using data from the Centers for Medicare and Medicaid Services shows the number of vacancies in nursing homes by state. A quick glance shows that in a majority of states, 25% to 45% of nursing home beds are vacant. This shouldn’t surprise anyone; nursing homes have been the site of many heartbreaking COVID deaths—especially early in the pandemic. People who may have put their elderly in a nursing home in normal times are understandably reluctant to do so now. Some states have already begun to distribute doses reserved for nursing homes to the larger population of seniors.

Source: Centers for Medicare and Medicaid Services
But problems in nursing homes go beyond relying on the number of beds as a proxy for the number of residents. A recent CDC report found that workers in nursing homes “had a median vaccination rate of 37% for staff during the first month of the federal vaccination effort; by comparison, a median 77.8% of nursing home residents received the vaccine.” The low take-up rate among nursing home workers and other health care workers surprised officials. It has taken longer to get these groups vaccinated than anticipated, although public education programs appear to be helping.
Clearly, we need to dig deeper into the variation in performance of states. There are no simple explanations for why poor states like West Virginia which is not known for the quality of its health care should do so much better than rich states like Massachusetts—famous for the quality of its health care. Indeed, our research shows that there is no relationship between states’ median household incomes and their performance in COVID-19 vaccinations.

There’s a lot we don’t know at this point. It may be that these first three months of vaccines are suffering from the same technological failures that plagued the Obamacare rollout in 2013—when the websites built for people to sign up for health care were overwhelmed and crashed. In Massachusetts, the governor opened up vaccines to people 65 and older and the system crashed on the first morning. A national system that was outsourced to Deloitte for development has been plagued with problems and states have been developing their own systems, many of which have also had problems. (Deloitte officials cite complex and shifting state requirements as the principal cause of problems with their system.)
Newspapers and television and radio news around the country are replete with stories of frustrated citizens trying to navigate an impossible digital maze. Like the Obamacare websites these sites will eventually be fixed but in the meantime the pandemic rages on and the virus mutates.
Figuring out what works has never been more important and studying the states can help government at every level to deliver vaccines faster and save more lives.
[1] One caveat: we were only able to find data on number of vaccination sites for 39 out of the 51 (including the District of Columbia) jurisdictions. And some states are listing sites but don’t yet have enough vaccines for all the sites.
Related Content


Authors


Commentary
The COVID-19 vaccine: What can states learn from each other?
February 19, 2021