Recently, Congress has showed a renewed interest, and possibly even the political will, to put federal appropriations for the Individuals with Disabilities Education Act (IDEA) on a glidepath toward “full funding.” From its inception in 1974, IDEA authorized federal funding for up to 40% of average per-pupil spending nationwide to pay a portion of what it costs to provide special education services for students with disabilities. Yet, in the more than four decades since the law was originally enacted, federal funding has never reached this target. In a change of course, for FY2023, Congress approved a 20% increase in appropriations for IDEA and there are strong signals that Congress plans to steadily grow appropriations in coming years.
Still, amidst anticipation for increased federal funding for special education, another important consideration has largely been overlooked: The formula used to determine how IDEA funds are allocated to states. IDEA’s funding formula is one of the law’s most critical components. Since the law’s inception, Congress has attempted to allocate IDEA appropriations to states according to each state’s share of children needing special education services.
That said, there are concerns that IDEA’s existing formula falls short of meeting policymakers’ expectations. In our recent work, we evaluated whether IDEA’s existing formula equitably distributes federal funding for special education among states and what will happen if the current formula is used to distribute potential future increases in IDEA appropriations. What we found is concerning.
Disparities Among States in IDEA Funding
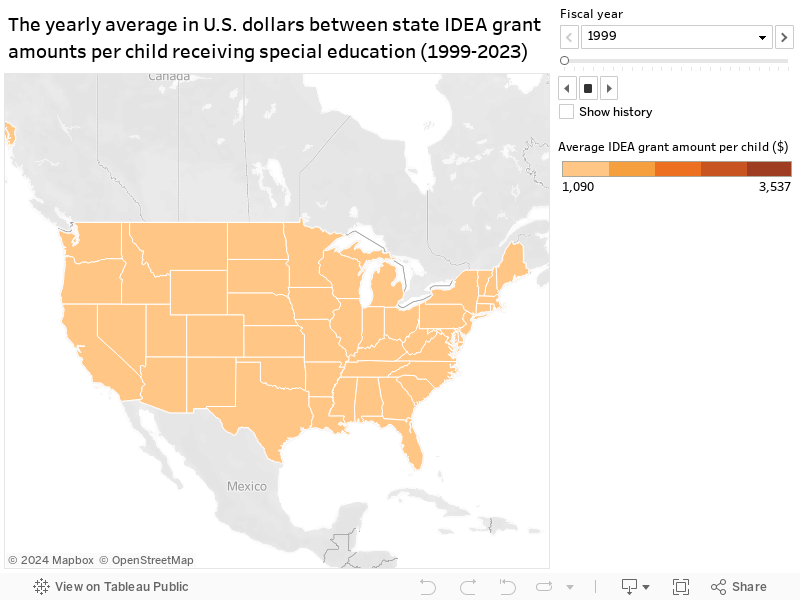
The existing formula generates substantial differences among states in the amount of federal funding available to pay for a child’s special education services, and these differences have grown over time. For FY2020, the difference in IDEA grant amounts between the states at the top and bottom of the distribution was about $1,442 per child; Wyoming received about $2,826 for each child receiving special education and Nevada received $1,384 per child (see Figure 1). To put this difference in context, for that year federal IDEA funding covered about 23% of the national average additional cost of educating a student with a disability in Wyoming, whereas federal dollars covered about 11% of additional spending in Nevada.
Disparities among states in IDEA funding are systematic. Contrary to policymakers’ original intent, states with larger shares of children eligible for special education receive, on average, fewer dollars per child than other states with less need (Figure 2). In addition, large states and states with more children experiencing poverty also receive fewer IDEA dollars per child. Put differently, states that likely need at least as much and perhaps even more funding to meet higher levels of student need than other states, on average get fewer federal special education dollars for each child who receives special education services.
Predictions for the Future
We simulated the potential impact of two policy proposals on the distribution of IDEA funding among states: (1) a 20% increase in appropriations for IDEA; and (2) full funding for IDEA. In both instances, we demonstrated how increased IDEA appropriations may affect federal grants to states.
Policy simulations show that increasing IDEA appropriations without modifying the current formula will perpetuate existing disparities in federal grant amounts to states. For the first simulation, the difference between states with the most and least funding grew to $1,805 per child ($3,537 in Vermont vs. $1,732 in Nevada). Moving to “full funding” further increases the difference between the states at the top and bottom of the distribution to $4,331 per child ($8,408 in Vermont vs. $4,076 in Nevada).
Allocating proposed increases to IDEA appropriations using the existing formula also preserves the distributional patterns that systematically advantage and disadvantage certain types of states (Figure 2). On average, states with the largest populations of children ages 3-21 will continue to receive fewer IDEA dollars per child. Similarly, states with larger shares of children experiencing poverty, children receiving special education, and non-White and Black children would on average receive smaller IDEA grants per child.

The Root of the Problem
Disparities among states in federal special education funding emerged after Congress changed IDEA’s funding formula at the law’s 1997 reauthorization. In FY1999, the year prior to when the formula change went into effect, the difference between the states at the top and bottom of the distribution was $155 per child eligible for special education; however, by FY2021 this gap widened to $1,511 per child (Figure 3).
 The updated formula – which remains current policy – is comprised of two parts: (1) a base funding amount equivalent to what each state received for FY1999; and (2) and a population-poverty calculation that allocates all new appropriations above the FY1999 base amount according to states’ relative child population and poverty counts for the prior academic year. After these calculations, a state’s allocation may be further adjusted to protect states from receiving significantly less funding than the previous year.
It is the complex interplay among these multiple calculations and adjustments that prevents the existing formula from effectively distributing IDEA appropriations among states according to contemporary and future differences in need.
The FY1999 base became a static fixed amount that states receive each year rather than an amount that is recalibrated annually according to cross-state differences in need. In the years immediately following the formula change, there weren’t significant federal IDEA appropriations beyond states’ FY1999 base funding amount (Figure 4). However, as time passed, by fixing this portion of states’ IDEA grants in perpetuity, the distribution of federal dollars among states became increasingly disconnected from changes to states’ special education child count.
 Beyond this, in the most recent decade, increasingly larger shares of IDEA appropriations were allocated to states based on the formula’s population-poverty calculation. However, our findings show that contrary to Congress’ intent the formula’s population-poverty calculation is a poor proxy for number of children needing special education services in a state, and instead the calculation disadvantages states with larger shares of students receiving special education. Accordingly, as Congress increased special education funding over time, the distribution of federal special education dollars has become more inequitable with respect to cross-state differences in need.
Finally, the formula’s adjustments that hold states “harmless” from substantial reductions in IDEA funding further undermine the population-poverty calculations’ capacity to effectively adjust for changes in states’ student population counts over time. Instead, the formula protects small states and states with declining student populations from possible reductions in IDEA dollars, and in doing so, prevents IDEA funding from being shifted to states with growing and increasingly diverse student populations.
More Money Is Not Enough
Policy proposals that would significantly increase federal funding for special education – including efforts to “fully fund” IDEA – bring a new sense of urgency to reconsidering the formula used to allocate IDEA appropriations. Simply adding dollars to existing IDEA appropriations without modifying the current formula works against IDEA’s promise to equalize educational opportunities for students with disabilities. Our research shows that states and the students receiving special education in those states have not equally benefited from federal appropriations for IDEA. Moving forward, achieving goals for equitably allocating IDEA funding will require changes to the formula used to calculate states’ grant allocations.
Related Content


Authors


The Brookings Institution is committed to quality, independence, and impact.
We are supported by a diverse array of funders. In line with our values and policies, each Brookings publication represents the sole views of its author(s).