This post updates with year-end 2021 data the External Wealth of Nations database [Excel download], which assembles data on external claims and liabilities of economies around the world. The database is described in more detail in a series of papers (Lane and Milesi-Ferretti 2001, 2007, 2018), and in a companion post. The data are annual for the period 1970-2021 and cover 212 countries and territories, plus the euro area and the Eastern Caribbean Currency Union (ECCU). The data update to 2021 is currently available for 155 economies (plus the euro area and the ECCU), including the 60 largest economies and 92 of the largest 100. The data will be updated at regular intervals. The 2021 update will be completed for the entire sample at the end of 2022.
The year 2021 saw a rapid recovery in global GDP from the depths of the COVID-induced recession, further increases in equity prices across the world, most notably in the United States, and a widening of current account surpluses and deficits. The latter development reflected both the strength of the recovery and the rebound in commodity prices, especially for oil and gas, which boosted the external balances of exporting countries at the expense of importers.
The combined effect of these factors reduced the aggregate size of global creditor and debtor positions in relation to world GDP. The dominant factor was the increase in the denominator, boosted by strong growth and rising inflation.
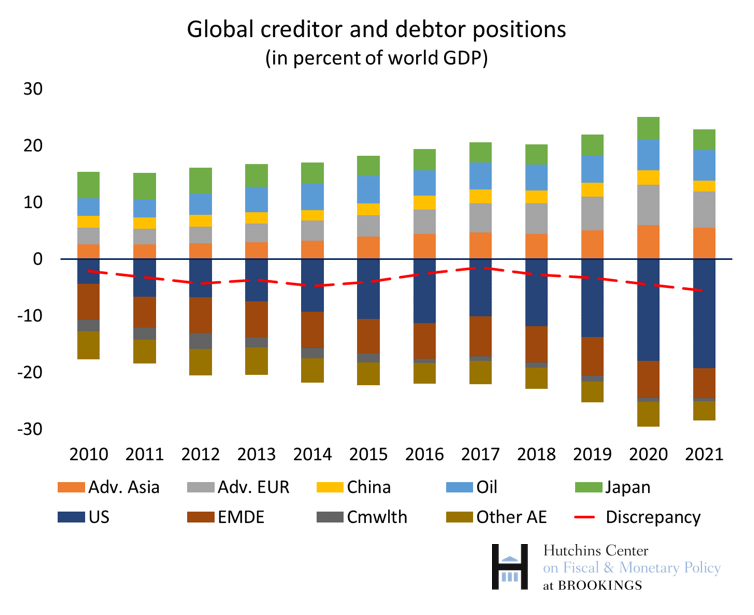
The U.S. debtor position
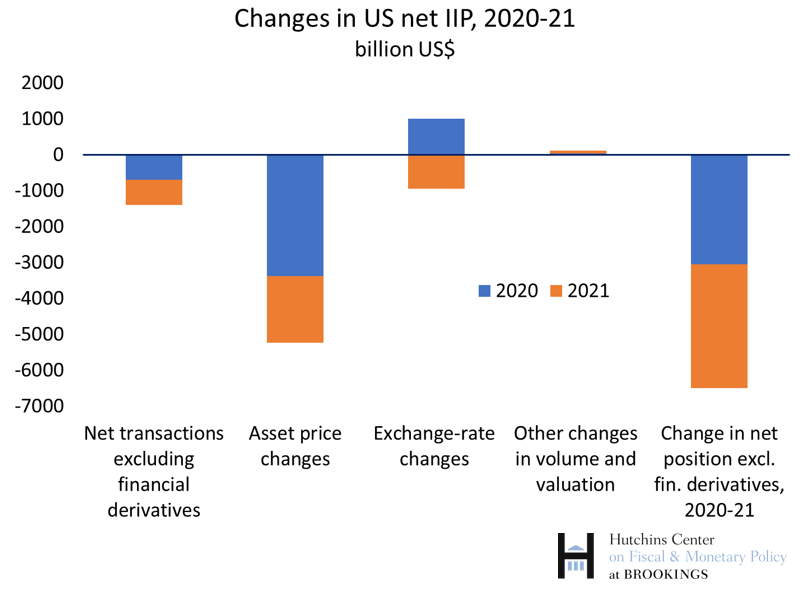
However, as in 2020, the largest net debtor position—that of the United States—increased further. It is close to 80 percent of U.S. GDP, a level with very few precedents across large economies in more than 50 years.[1] Three factors contributed to the increase: higher U.S. borrowing from abroad as U.S. consumers spent more on goods, an appreciating U.S. dollar (which reduces the dollar value of U.S. assets in other currencies), and especially a further sharp increase in U.S. equity prices (up 25 percent during the year, according to the Morgan Stanley Capital International index) which raises the value of foreign-owned shares and plants in the U.S.
Should the increase in the U.S. debtor position raise worries? As discussed here, there are factors tempering concerns: the deterioration in the external position has been primarily driven by rising asset prices, which also raise overall U.S. wealth, and measurement issues related to FDI may overstate U.S. liabilities. A U.S. stock market correction (as occurred dramatically in 2022) tends to improve the external position (by reducing the value of U.S. shares and plants owned by nonresidents), and a depreciation of the U.S. dollar likely will contribute to external adjustment both through its impact on net exports (stimulating exports and discouraging imports) and through its valuation effects (by raising the dollar value of U.S. assets in foreign currencies). However, the U.S. dollar has continued to appreciate this year and the U.S. current account deficit is likely to widen further in 2022, as foreign demand cools and U.S. demand remains strong.
Valuation gains from higher values of U.S. assets
Who were the beneficiaries of increased asset values in the U.S.? As in 2020, countries with large sovereign wealth funds, which have high equity and FDI holdings in the U.S., rank high on the list. These include Norway and several Gulf states (including Kuwait, Saudi Arabia, and the United Arab Emirates). Creditor positions in these countries also benefited from higher oil revenues, which widened current account surpluses.[2]
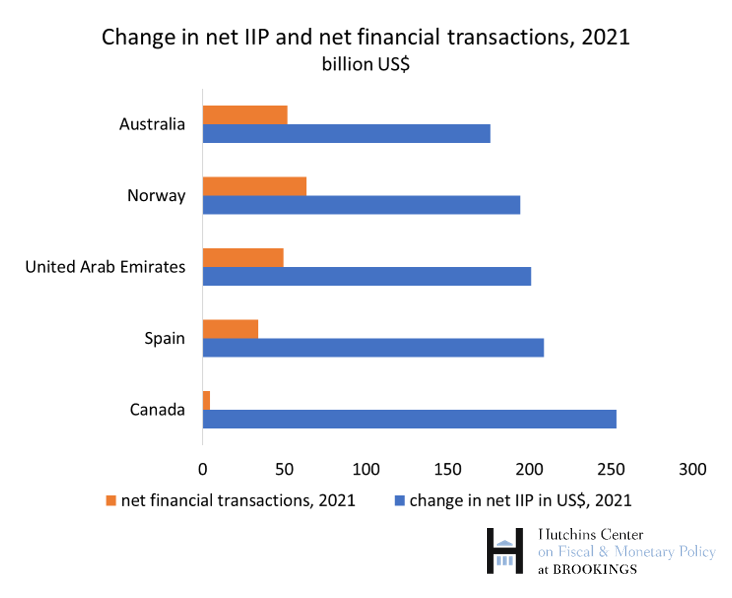
But the country where the external position improved the most is Canada. It is now the 8th largest creditor country, with net assets of around US$1.17 trillion. Canada has a large share of its external assets in the U.S., and hence benefits heavily from higher U.S. asset prices. Furthermore, its currency depreciated against the dollar, and this raises the value of its assets in U.S. dollars relative to its liabilities in Canadian dollars. The large creditor position of Canada stands in sharp contrast with its pattern of external borrowing. Since the end of 2009, Canada’s cumulative net external borrowing amounted to US$500 billion, but its net external position improved by almost $1.4 trillion dollars: large increases in the value of its external assets in the U.S. played a crucial role.
The largest creditors and China’s external position
This table shows the largest net creditors in absolute terms as of end-2021, as well as the position relative to domestic GDP and the change relative to 2020. The worsening of China’s external position is surprising: in 2021 it recorded a large current account surplus, and it has sizable holdings of U.S. assets.
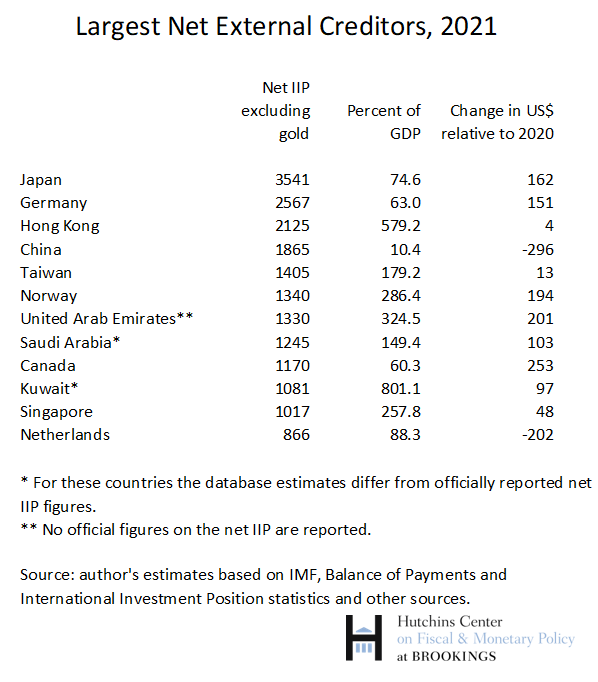
Scrutiny of the data provides an explanation. First, Chinese assets in the U.S. are overwhelmingly bonds, which did not increase in value during 2021. Second, Chinese portfolio equity assets are concentrated in Hong Kong, where the stock market lost value in 2021. Third, the Chinese renminbi appreciated during 2021, including vis-à-vis the dollar. Chinese liabilities are denominated at least in part in renminbi—hence their dollar value has risen. In contrast, their foreign-currency assets, including both FDI and reserves, are partly denominated in other currencies, such as the euro or emerging market currencies, and their dollar value correspondingly declined with the strengthening of the U.S. dollar. Finally, China’s net lending abroad is quite a bit smaller than its current account surplus, as its external accounts are characterized by a large negative discrepancy (“net errors and omissions” in the balance of payments) between the two. This could reflect unrecorded outflows of capital from China (which would not be captured in its official net creditor position) or some overstatement of the current account balance.
[1] Among all economies with GDP exceeding $500 billion (roughly the size of Austria or Norway in 2021), only Spain’s net debtor position has exceeded this amount in relation to domestic GDP in the past 50 years.
[2] As for other countries in the chart, Spain’s position in U.S. dollars improved because of the depreciation of the euro vis-à-vis the dollar (Spain’s liabilities are overwhelmingly in euros), while Australia’s improved position reflects both large equity holdings in the U.S. (which increased in value) and a depreciation of the Australian dollar, which reduced the US$ value of its liabilities.
The Brookings Institution is financed through the support of a diverse array of foundations, corporations, governments, individuals, as well as an endowment. A list of donors can be found in our annual reports published online here. The findings, interpretations, and conclusions in this report are solely those of its author(s) and are not influenced by any donation.
Author

-
Acknowledgements and disclosures
The author is grateful to David Wessel for useful suggestions and to Alex Conner for comments and help with the data and charts.
The Brookings Institution is committed to quality, independence, and impact.
We are supported by a diverse array of funders. In line with our values and policies, each Brookings publication represents the sole views of its author(s).

Commentary
Updating the External Wealth of Nations database to 2021
September 19, 2022