
This publication is part of a broader series examining the potential of office-to-residential conversions across six U.S. case studies. The project is part of a cooperative agreement with the US Department of Housing and Urban Development, and the research team is composed of contributors from Gensler, HR&A Advisors, Brookings, and Eckholm Studios.
Over the last 70 years, Pittsburgh has seen a dramatic population decline as families moved to the surrounding suburbs and steel production went overseas. Emerging from 14 years of state receivership in 2017, the city seemed to be on an upward fiscal trajectory supported by a strong, modern “eds and meds” economy. However, in 2020, the pandemic exacerbated existing challenges for Pittsburgh’s historic commercial core, where leasing activity is now down more than 60% from 2019. This downturn presents a severe fiscal problem for a city that relies on its downtown for nearly a quarter of its property tax revenue.
Despite recent new deliveries and affordable prices drawing in young, childless professionals, Pittsburgh’s downtown still consists almost exclusively of office buildings—making residential conversions a particularly attractive option for revitalizing the area. In a sense, downtown’s potential gentrification—with increasing home values and high absorption, in contrast to the “hypervacancy” characterizing many other Pittsburgh neighborhoods—presents an opportunity to draw in the kind of middle-class taxpayers who fled to the suburbs a generation or more ago. The biggest barrier to conversions, however, is downtown’s general lack of the amenities that characterize residential areas, such as grocery stores and green space. In October 2024, Pennsylvania Governor Josh Shapiro announced $600 million in grants for public spaces and conversion projects, which will likely have a transformative impact.
Pittsburgh history and context
At the headwaters of the Ohio River, the city of Pittsburgh formed as a vital logistics junction connecting the population centers of the East Coast to the interior. First settled by colonists in 1758 and incorporated in 1816, the city’s access to fresh water and proximity to coal sources attracted the early steel industry, leading to rapid population growth from 1875 to 1930.
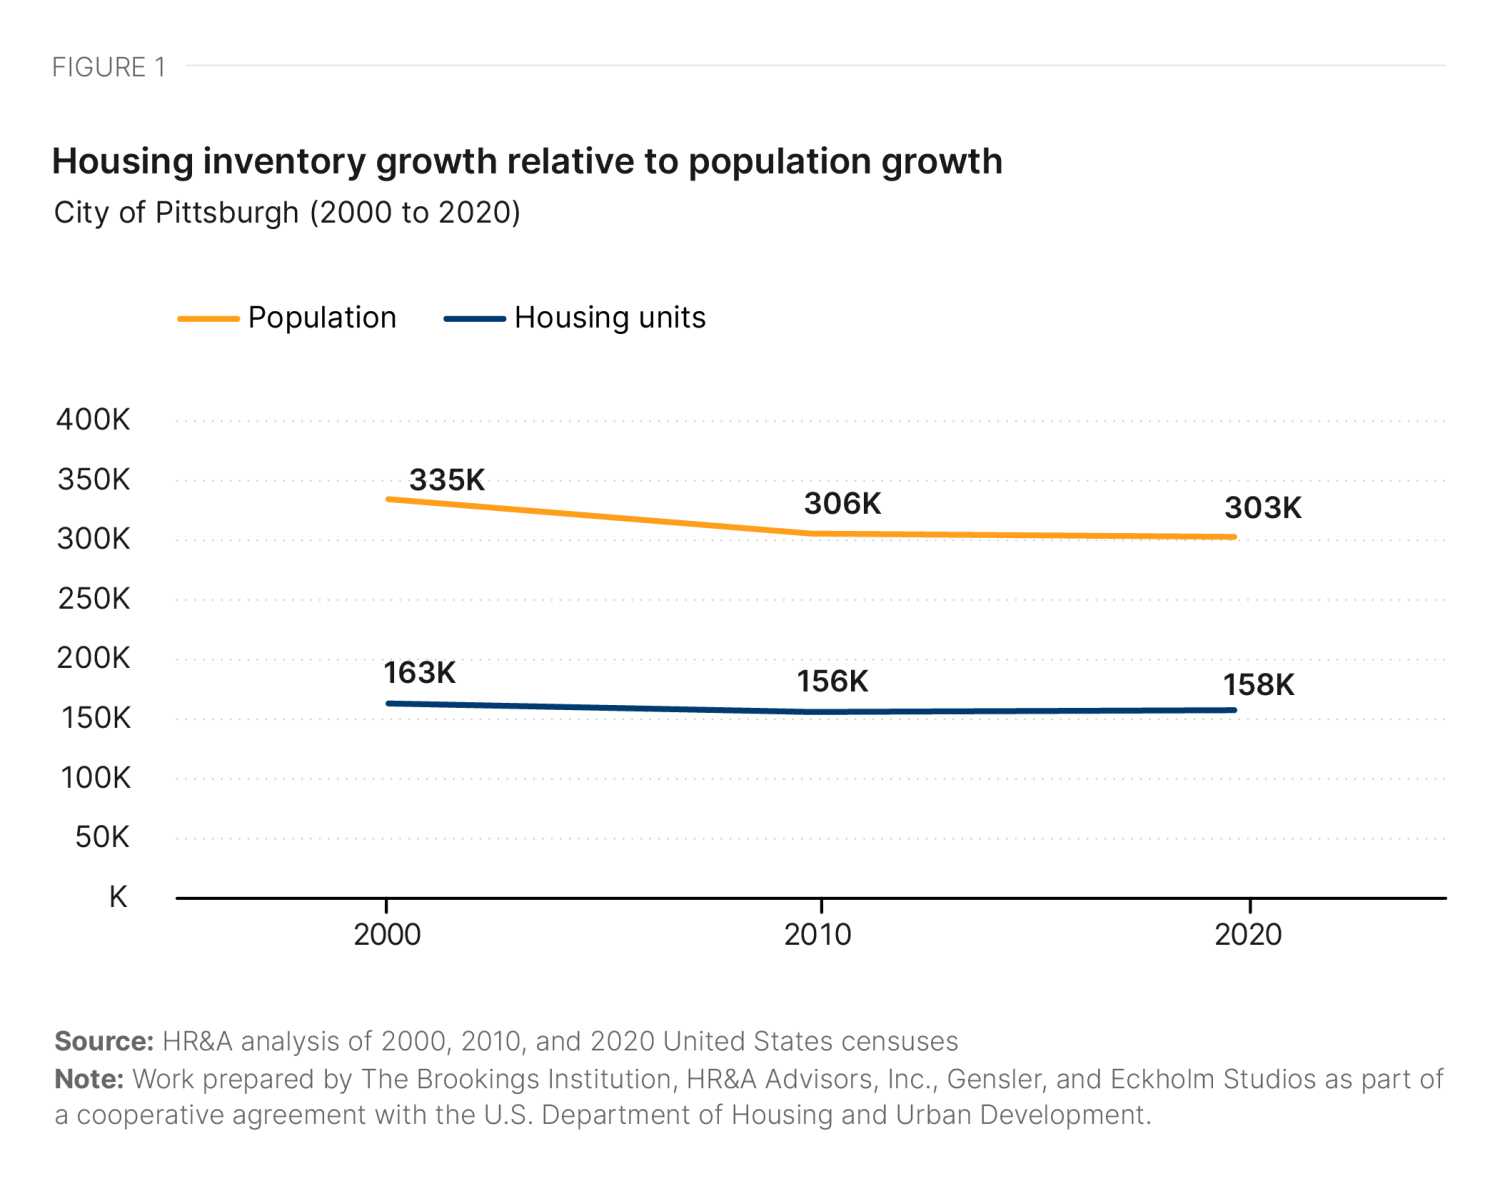
Pittsburgh was once the eighth-largest city in the U.S., and its population continued to grow until hitting a peak in 1950. Two major trends caused the city’s population to collapse in the postwar era: suburbanization and offshoring of steel production. Today, while the population of the region’s 1950s-era suburbs has remained stable, the city’s population is less than half of its 1950 peak. Pittsburgh is now the 68th-largest city in the U.S. Between 2000 and 2020 alone, the city saw its population decline from 335,000 to 303,000—a roughly 10% drop (Figure 1). The city also lost 5,000 housing units over the same period.
While the region still has a very high relative concentration of workers in mining, these jobs represent less than 1% of the region’s employment base. Instead, the city and region now have an “eds and meds” economy with high shares of workers in education and health care (22%, compared to 15% nationwide), driven by the many universities within the city limits. Pittsburgh is also the headquarters of PNC Bank, the seventh-largest American bank by asset size.
Still, decades of population decline culminated in a fiscal crisis for Pittsburgh in 2003, prompting the city to elect Act 47 protection—thereby entering state receivership—to help it avoid bankruptcy. The city remained under receivership for 15 years, until it had stabilized its finances and successfully exited receivership in 2017. Pittsburgh was on the upswing.
If you look at our finances in 2019, we were doing quite well. Our fund balance continued to grow. We had companies who wanted to move here…Duolingo moved its headquarters to Pittsburgh and even put up billboards in San Francisco to attract people.
A Pittsburgh stakeholder
However, the onset of the COVID-19 pandemic in 2020 jeopardized Pittsburgh’s upward trajectory. Rachael Heisler, the city’s controller, has warned of a pending fiscal cliff, driven in part by falling property values in the office-heavy downtown, which comprises 23% of city’s real estate tax base. In 2023, adjustments in the assessed value of downtown office buildings had reduced the tax base by $409.9 million, costing the city $3.3 million in tax revenue out of the projected $35 million it typically receives from downtown property—an almost 10% revenue loss. This shortfall has spurred intense dialogue among Pittsburgh’s leadership on how to reposition the city’s downtown assets.
Downtown footprint and demand
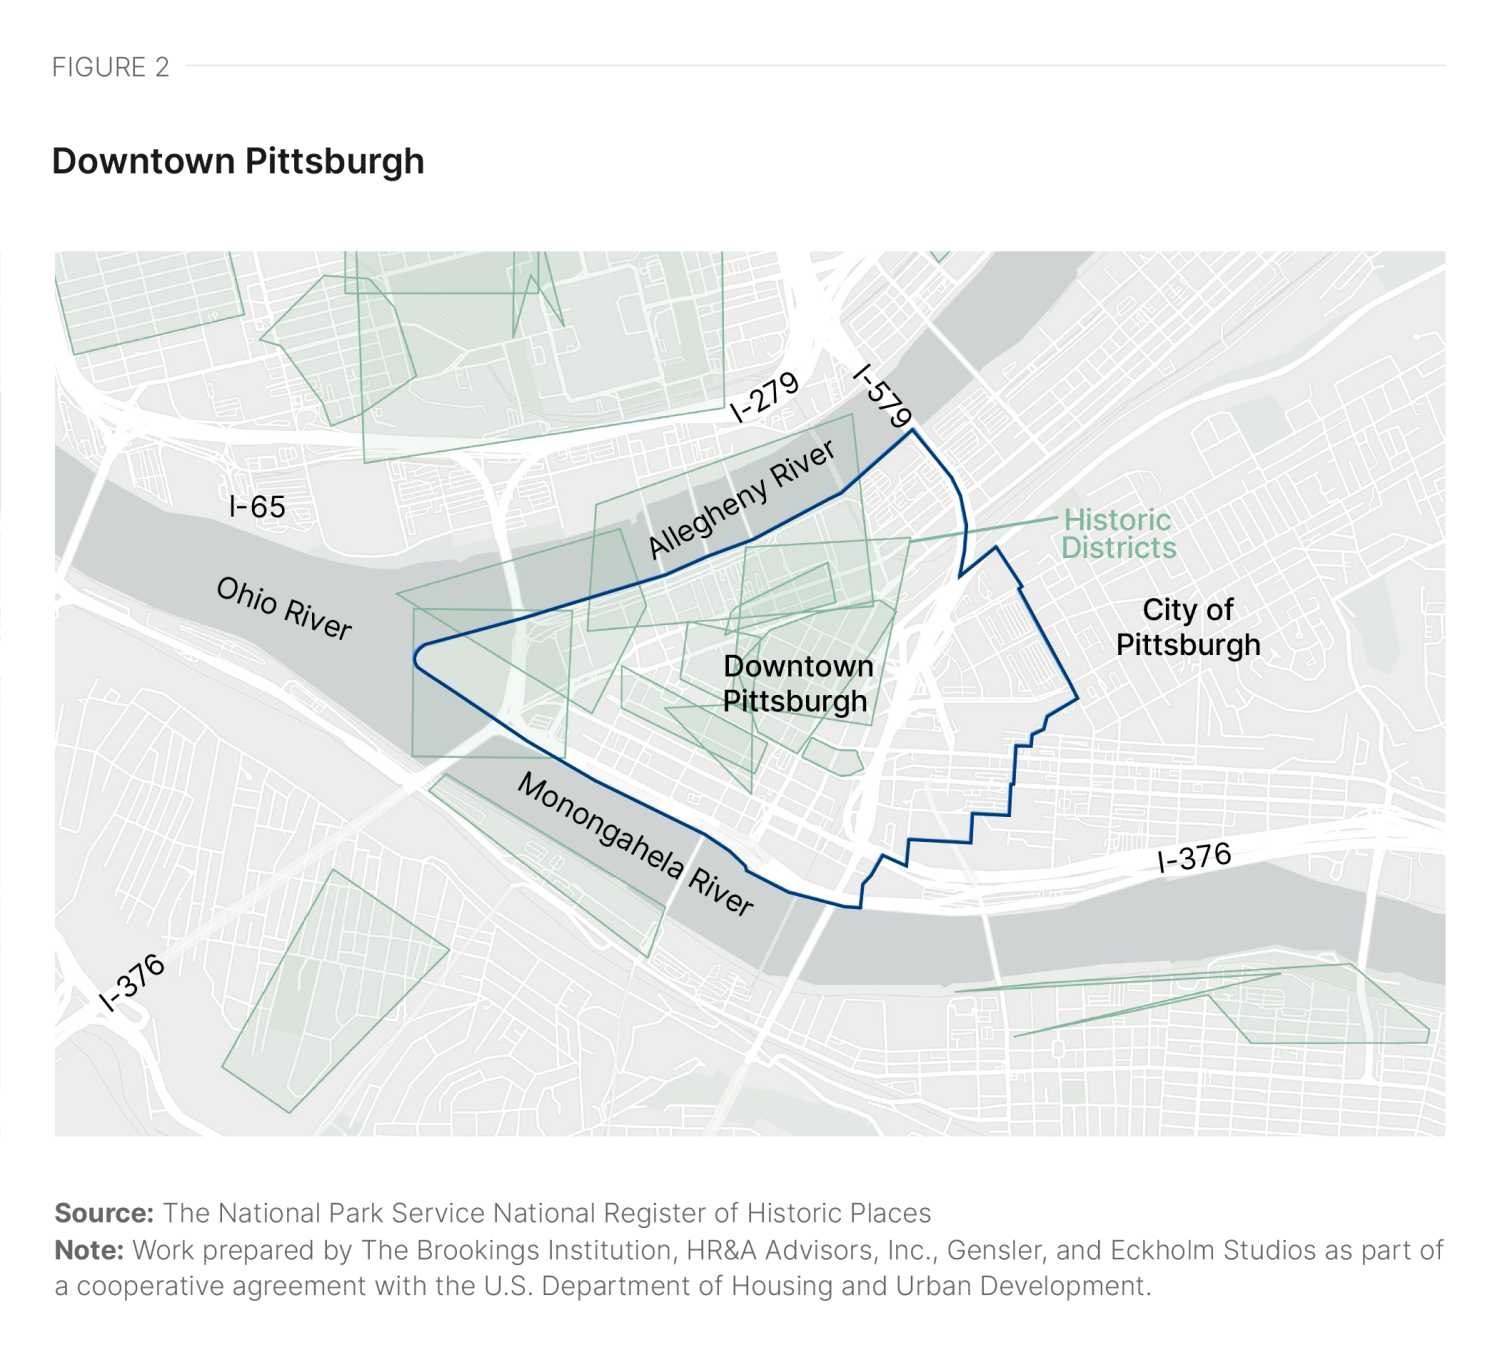
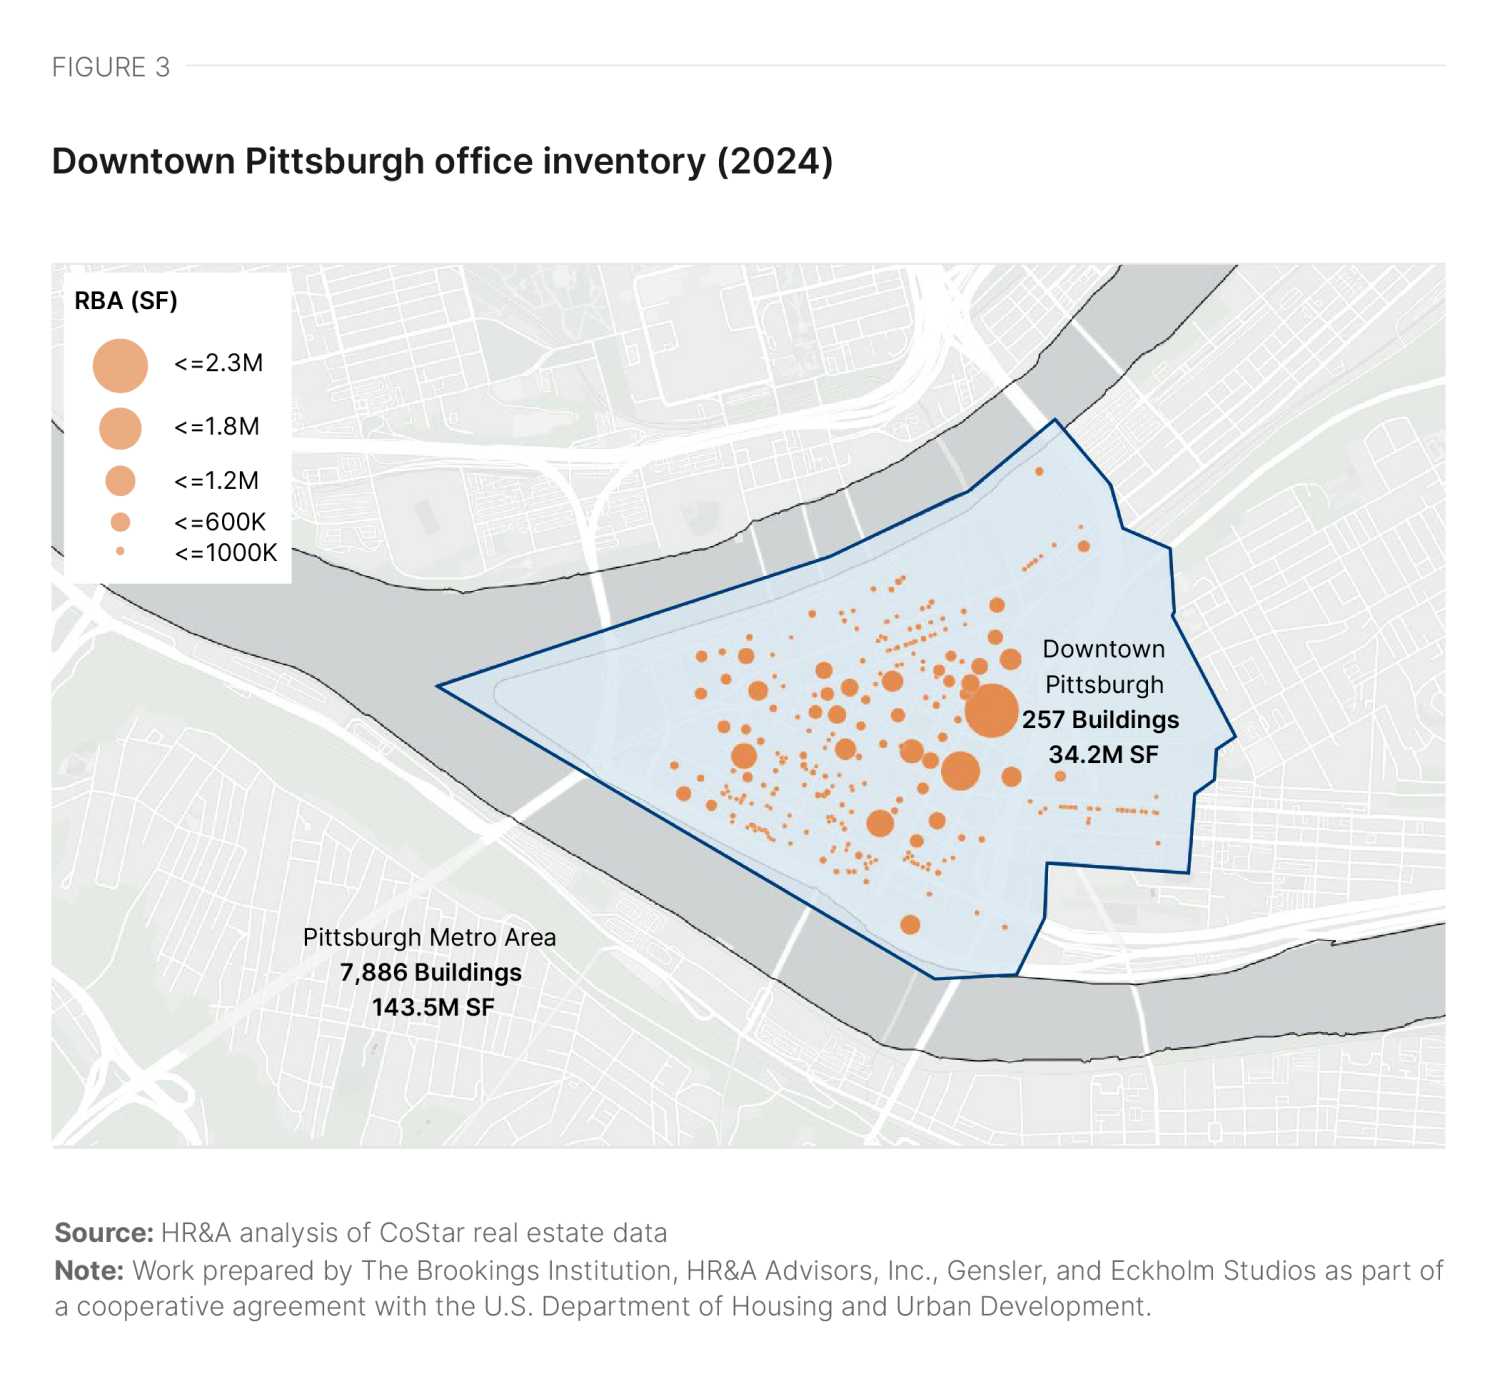
Downtown Pittsburgh is an office-intensive, 0.76-square-mile triangular region at the convergence of the Allegheny, Monongahela, and Ohio rivers (Figure 2). Largely constructed during Pittsburgh’s steel heyday, most of downtown is covered by either a historic district on the National Register of Historic Places or a city-designated historic district.
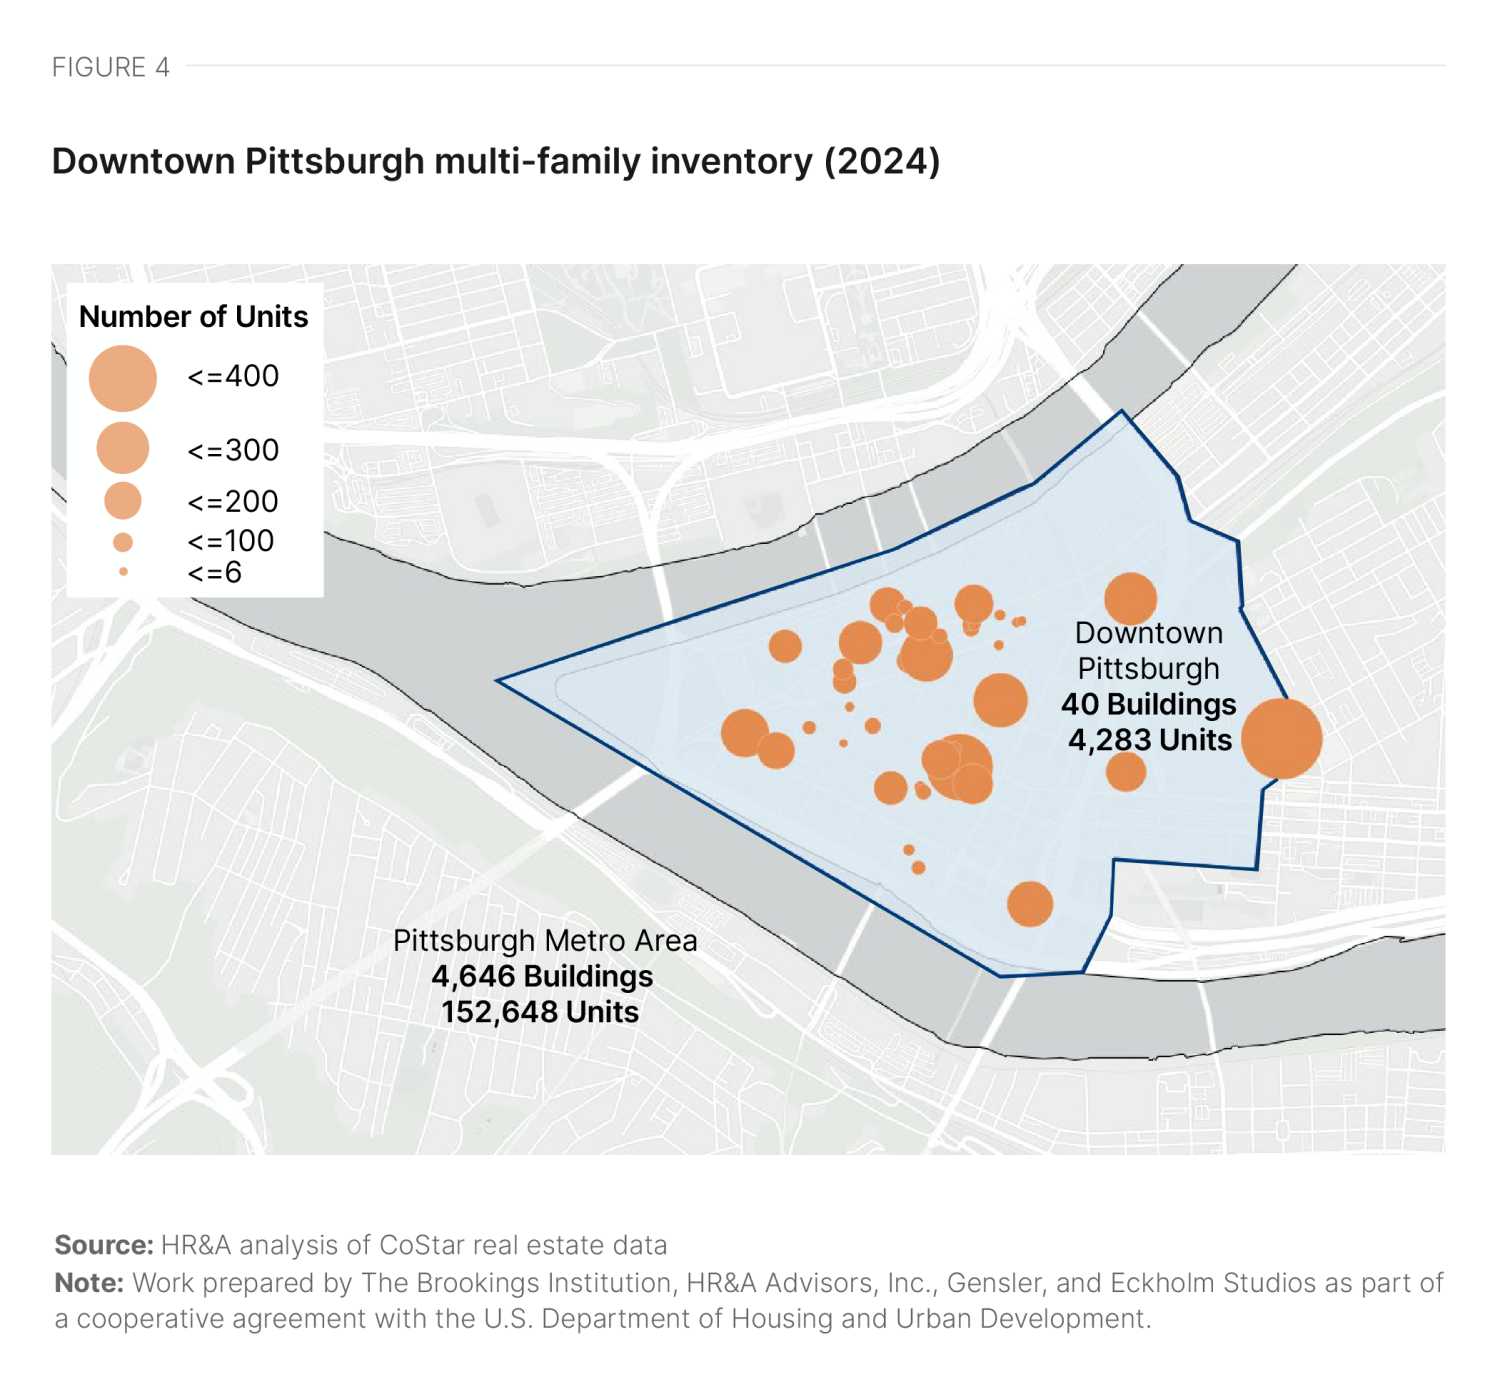
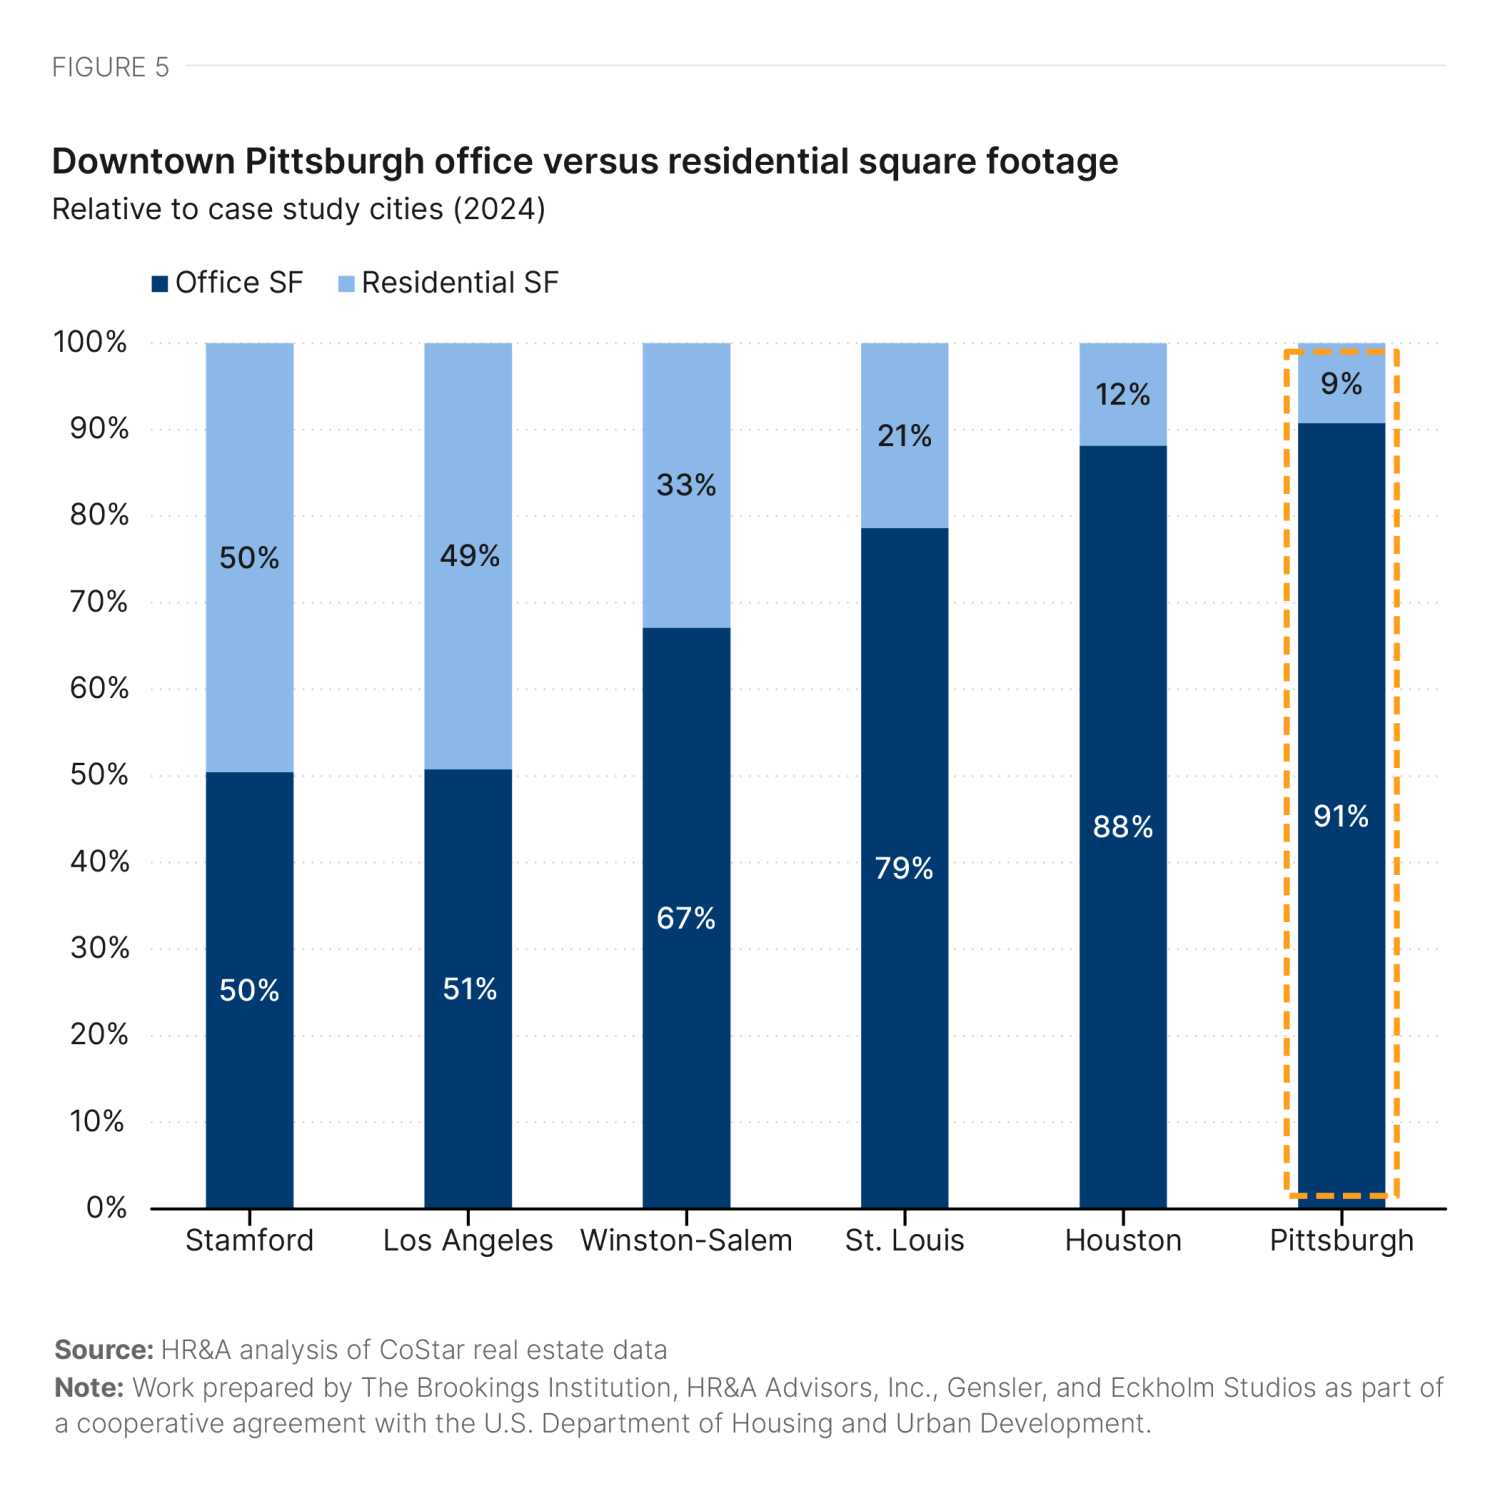
Downtown Pittsburgh is home to 257 office buildings (Figure 3) and 40 apartment buildings, containing 4,238 units—a mere 3% of the city’s total apartment inventory (Figure 4). With a 10-1 ratio, the market has the highest share of office space relative to apartment inventory of any of the six downtowns reviewed for this study (Figure 5). However, Pittsburgh’s office product is in dated condition: Just 2% of downtown office buildings were built within the last 15 years.1 This makes the city a strong fit for conversion activity; older buildings with smaller floor plates are often advantageous for conversions because it’s easier to design efficient layouts in which all units have windows.
Relative to office construction, downtown Pittsburgh has experienced more residential construction activity, with six deliveries since 2019 and three multifamily projects in the pipeline.2 The city is concurrently planning public realm improvements to create the conditions to attract more residential buildings, because despite recent progress, the city has limited residential inventory compared to other downtowns.
Office market conditions
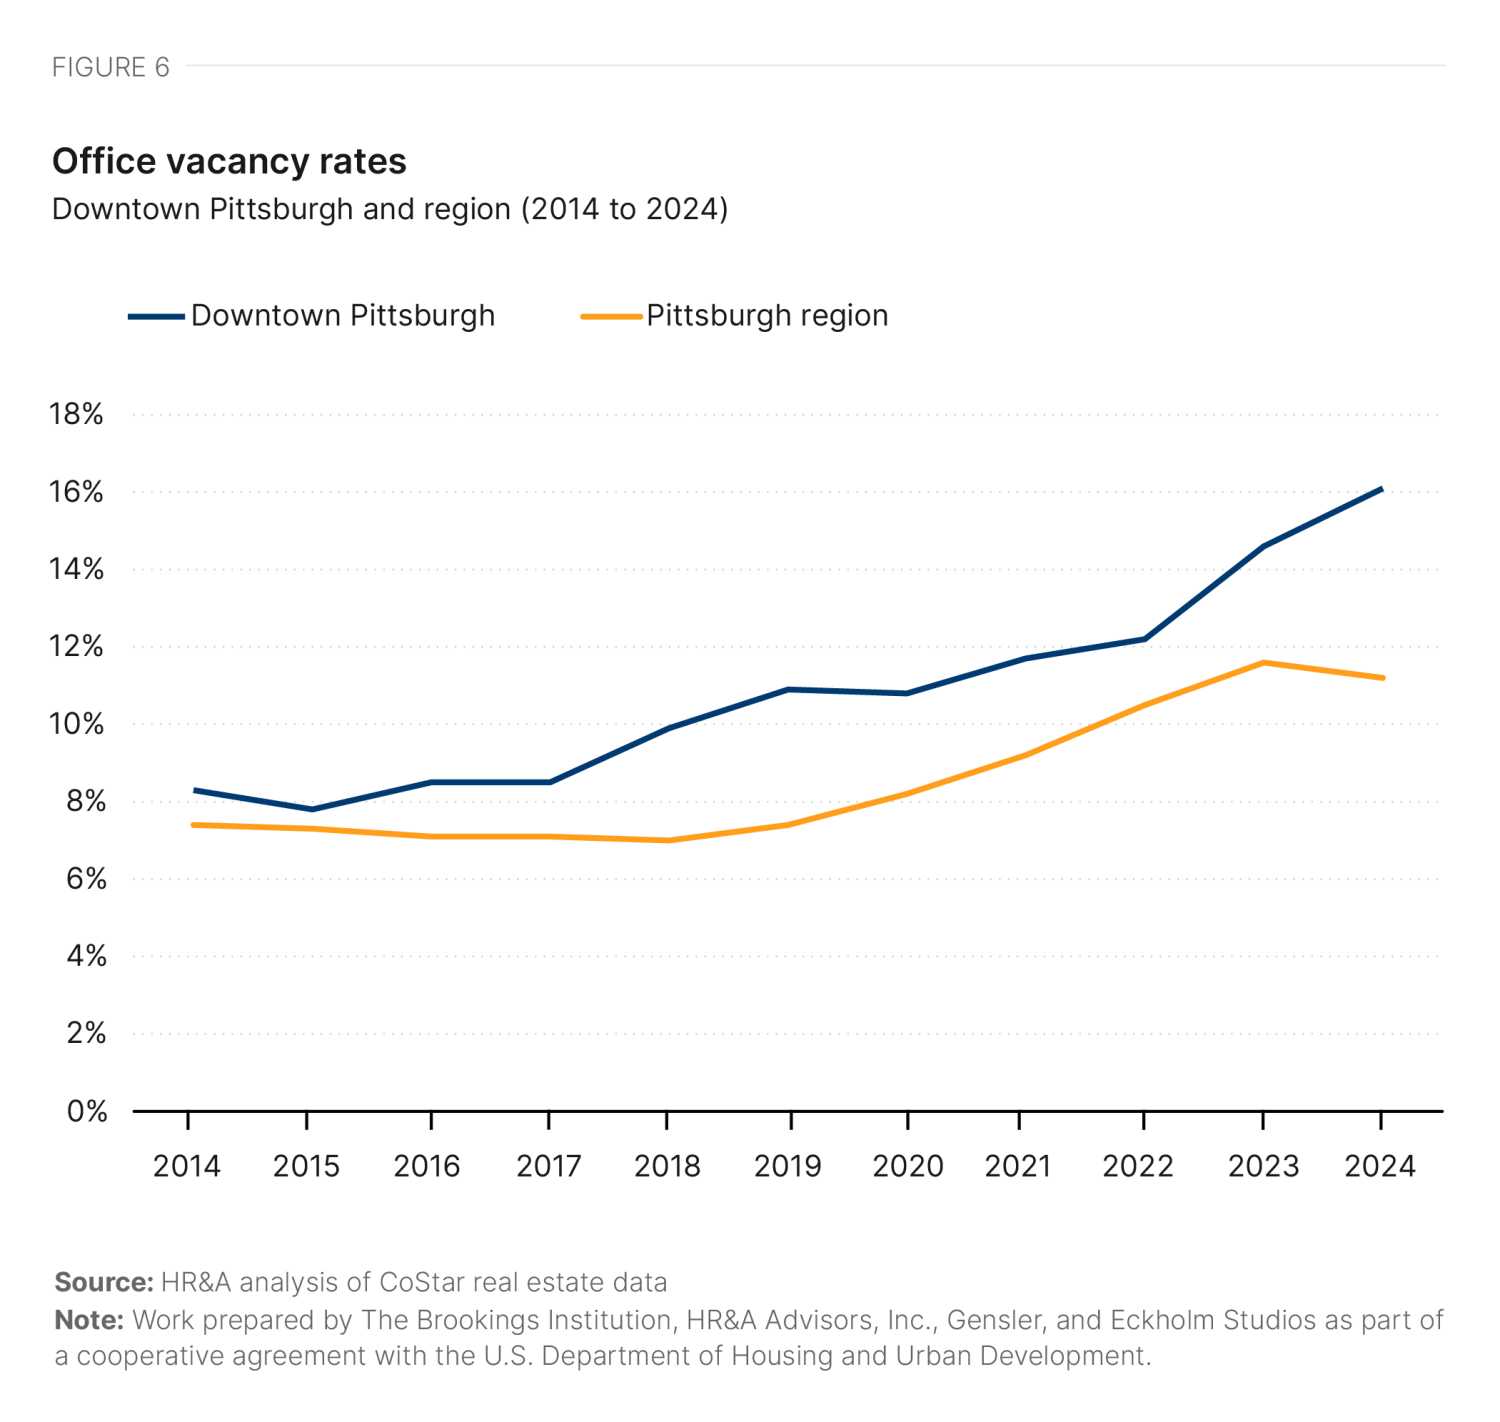
Pittsburgh’s office and residential markets show divergent trajectories, with signs of reduced demand for office space and increased demand for apartments. This trend began prior to—but was accelerated by—the pandemic.
From 2016 to 2019, downtown office vacancy increased from 9% to 11%, and as of Q3 2024, market-level office vacancy is estimated at 16% (Figure 6). This is slightly lower than the 19% national average office vacancy rate in Q3 2024.3
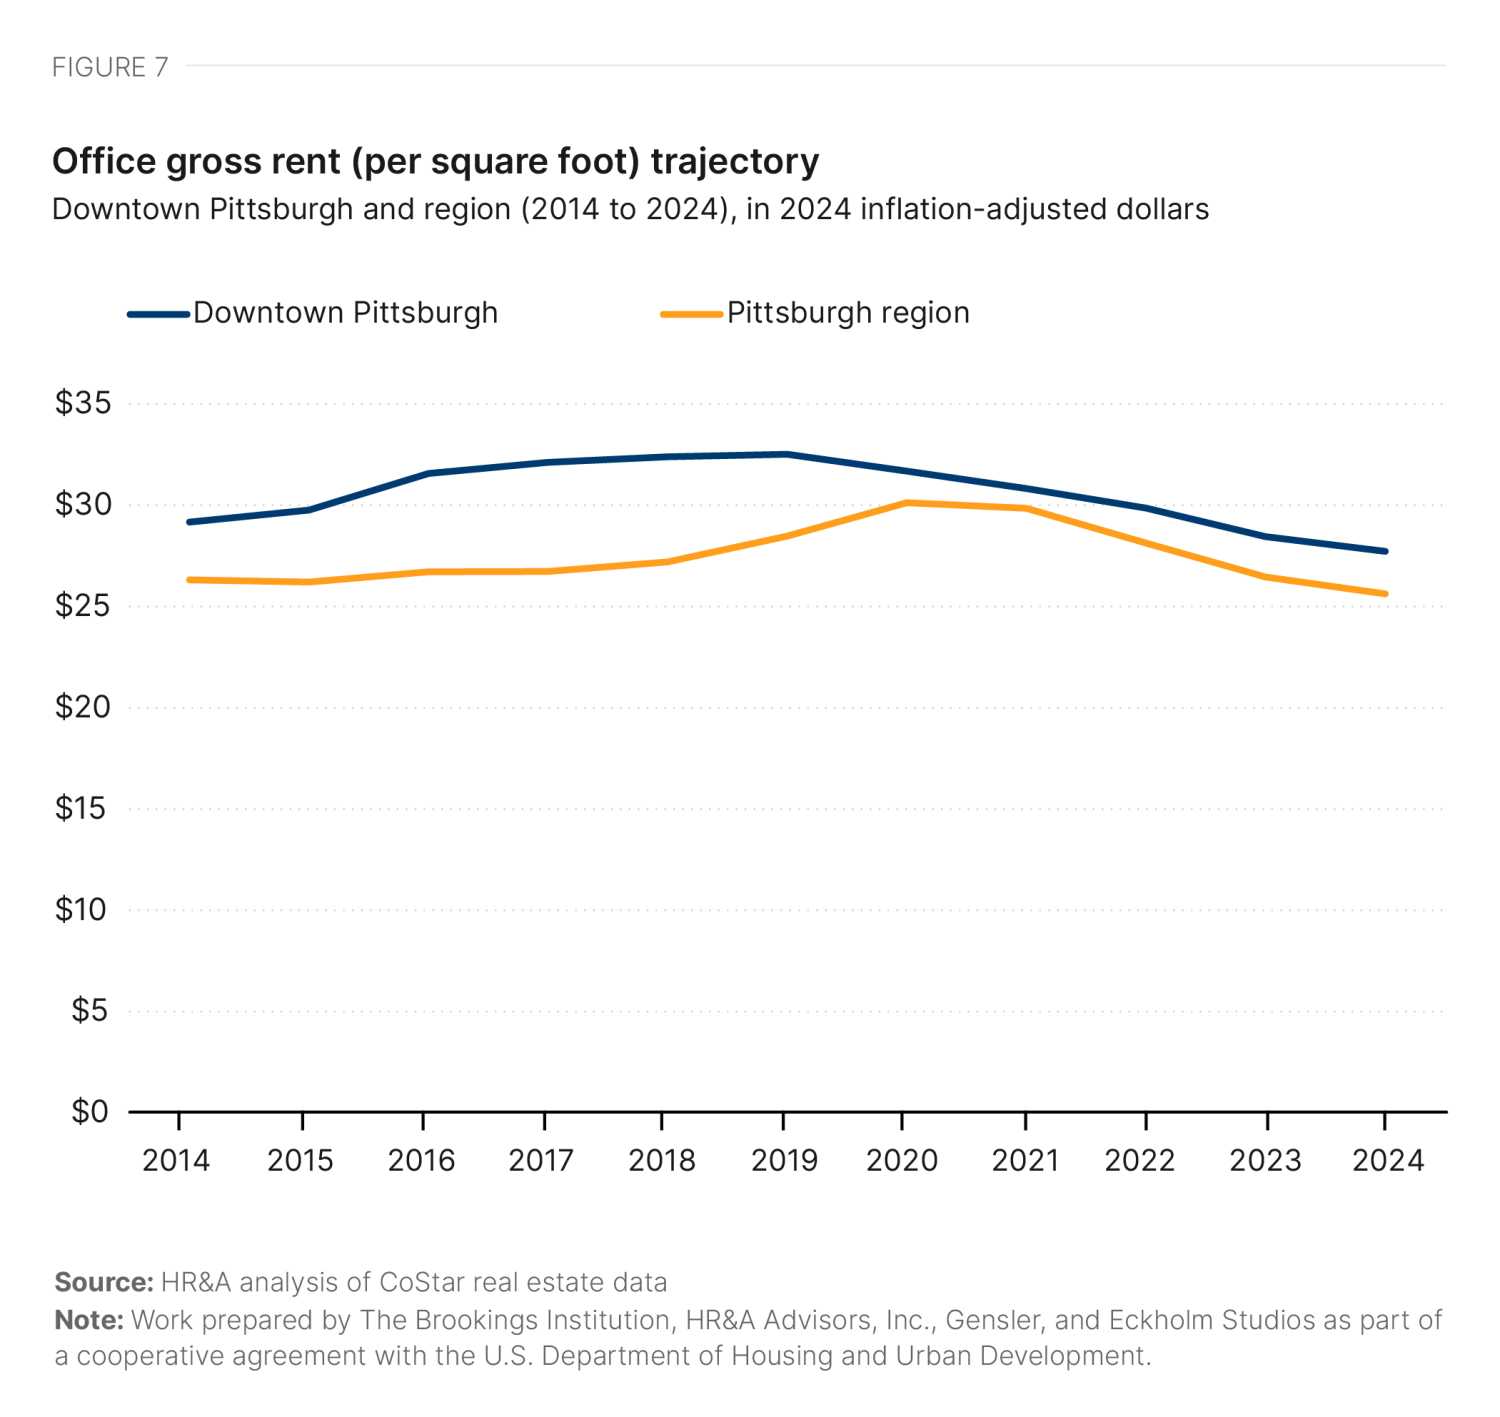
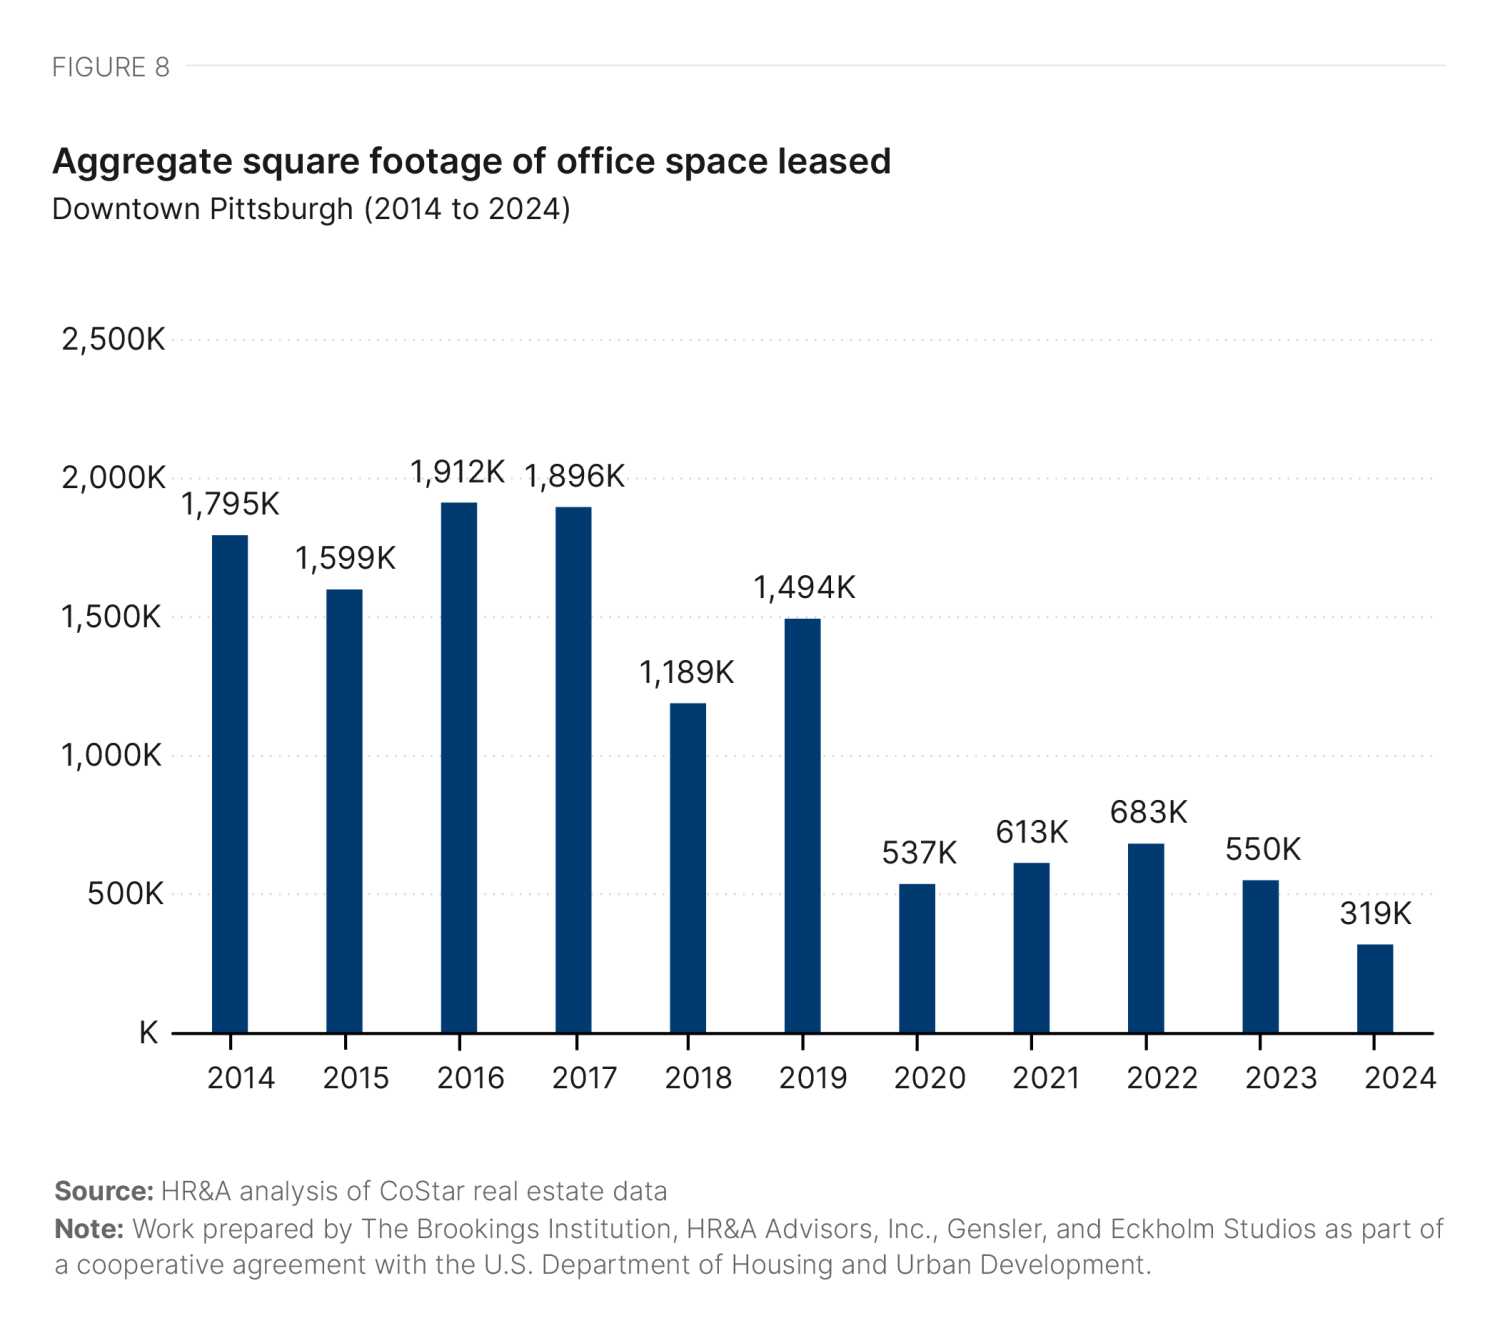
Vacancy has increased across building classes. While inflation-adjusted asking rents were stable until 2020, rents have since fallen from an average of about $33 per square foot in 2019 to $28 per square foot in 2023—a decline in real terms of 16% (Figure 7). Leasing activity has yet to pick up in response to the slump in prices. Downtown Pittsburgh leased 1.65 million square feet of office space per year before the pandemic; since 2020, the annual leasing activity has dropped by 63% (Figure 8).
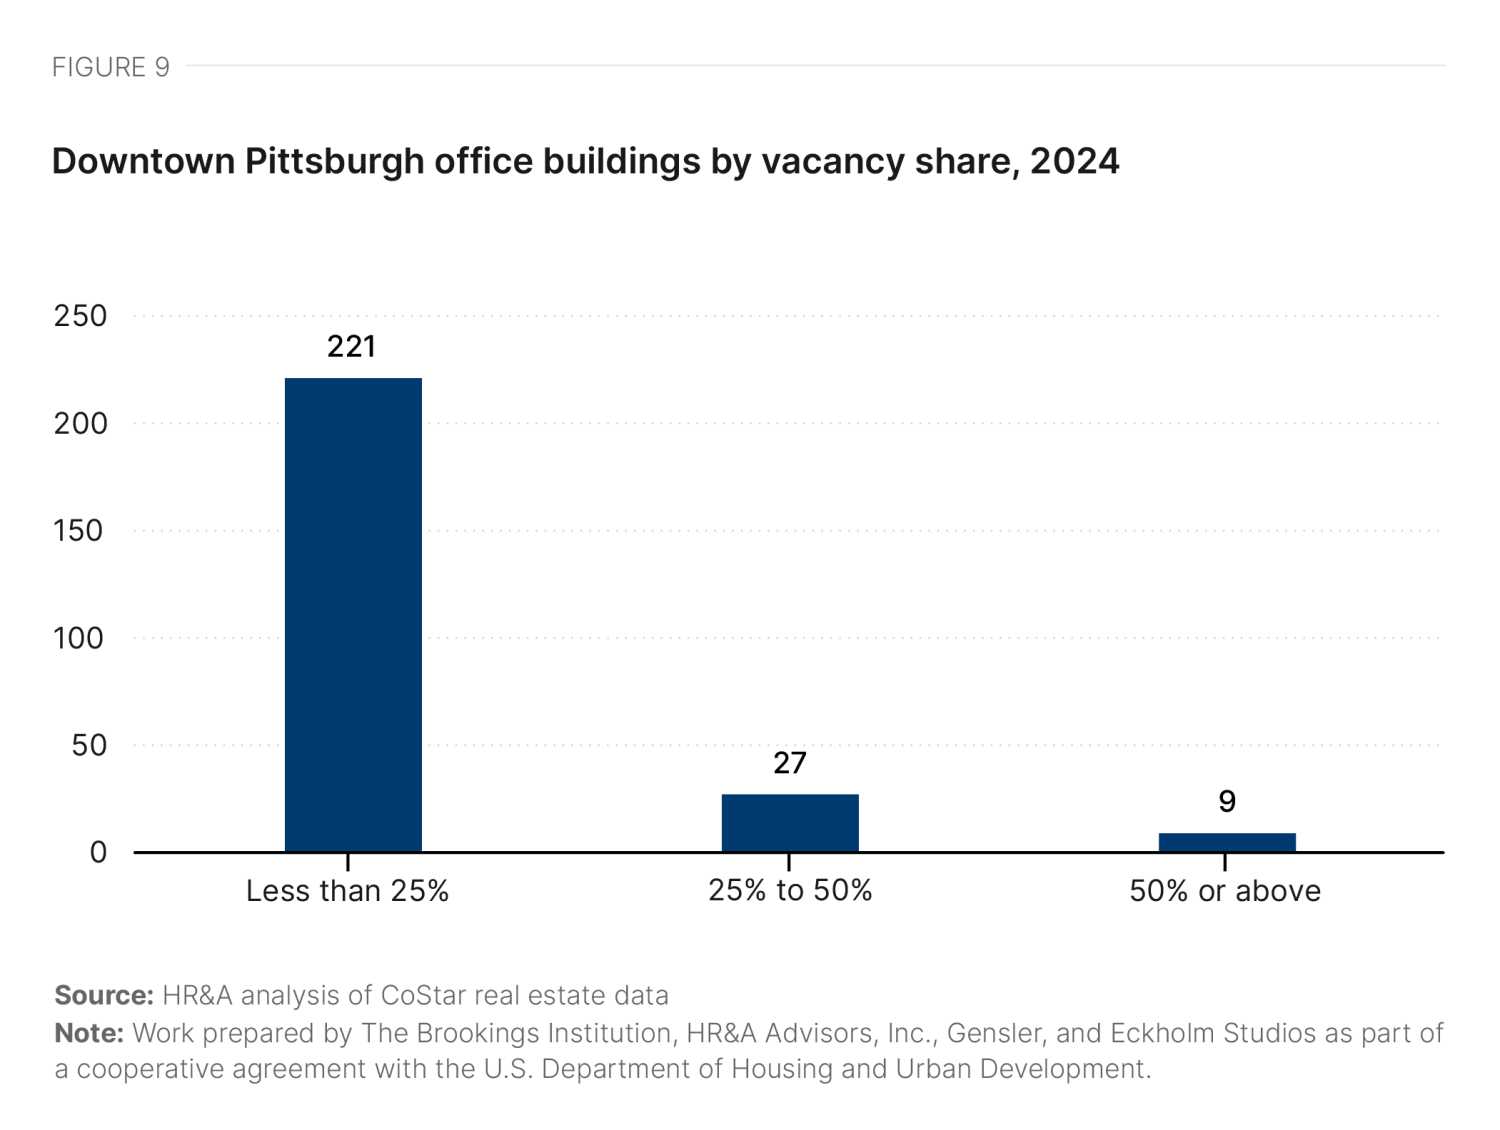
It is worth noting that Pittsburgh’s downtown vacancy rate is driven in large part by high vacancy rates in a subset of the city’s larger office buildings. Out of the downtown’s 257 office buildings, only 36 have vacancy rates exceeding 25%, but these buildings comprise 29% of downtown’s total office space (Figure 9). Forty-seven percent of the vacant office space in downtown Pittsburgh can be found in just 10 buildings, including the 525 William Penn Place, 500 Grant St., and the One Oxford Centre.4 This creates a paradox for Pittsburgh: The buildings that are hardest to convert due to their floor plate depths also have some of the highest vacancy rates, making them more desirable to convert.
Residential market conditions
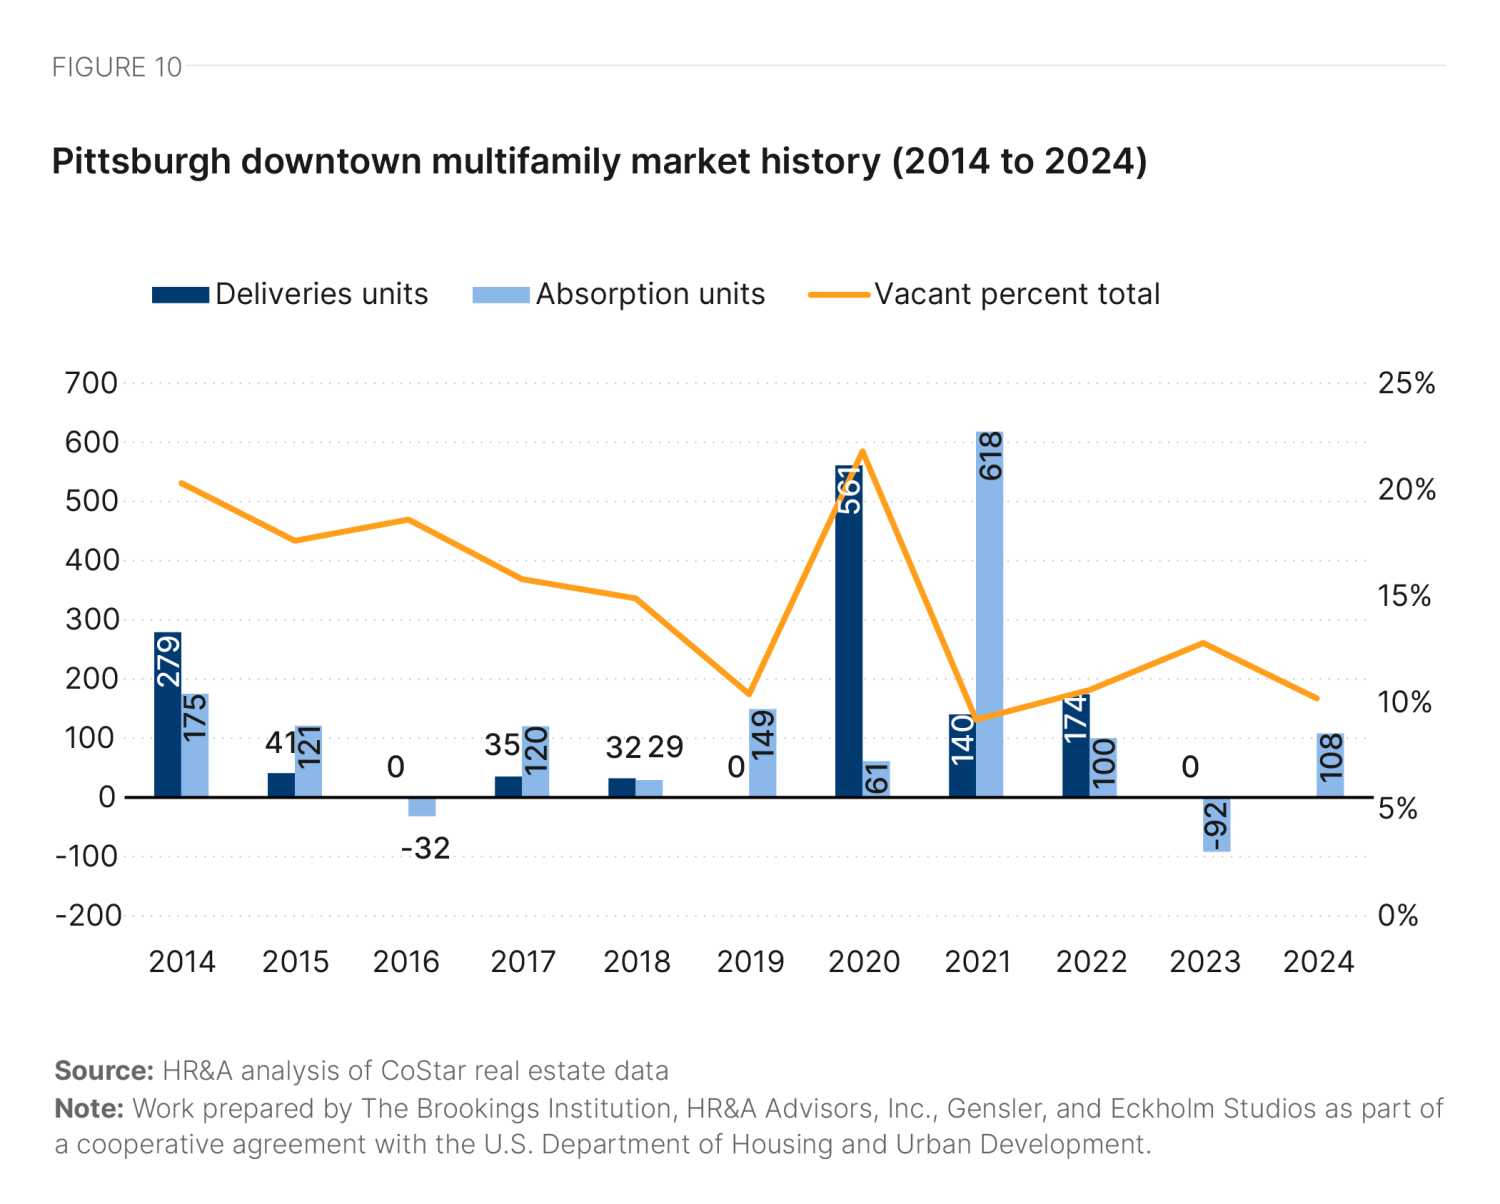
Pittsburgh is a majority-renter city, with only 47% of residents owning their home—well below the national homeownership rate of 66%. This in part reflects the departure of the middle class from the city, where the center of the income distribution went from almost half of all families in 1960 to only 25% in 2015. The result is a housing stock in which almost a quarter of census tracts have 10% or more vacant units, a condition writer Alan Mallach calls “hypervacancy,” which prevents the housing market from functioning normally. At the same time, Mallach identifies eight neighborhoods in the city, including downtown, where home values have dramatically increased since 2000 and gentrification is occurring. Apartment occupancy in downtown Pittsburgh has increased in recent years, even as additional apartment buildings have been delivered (Figure 10).
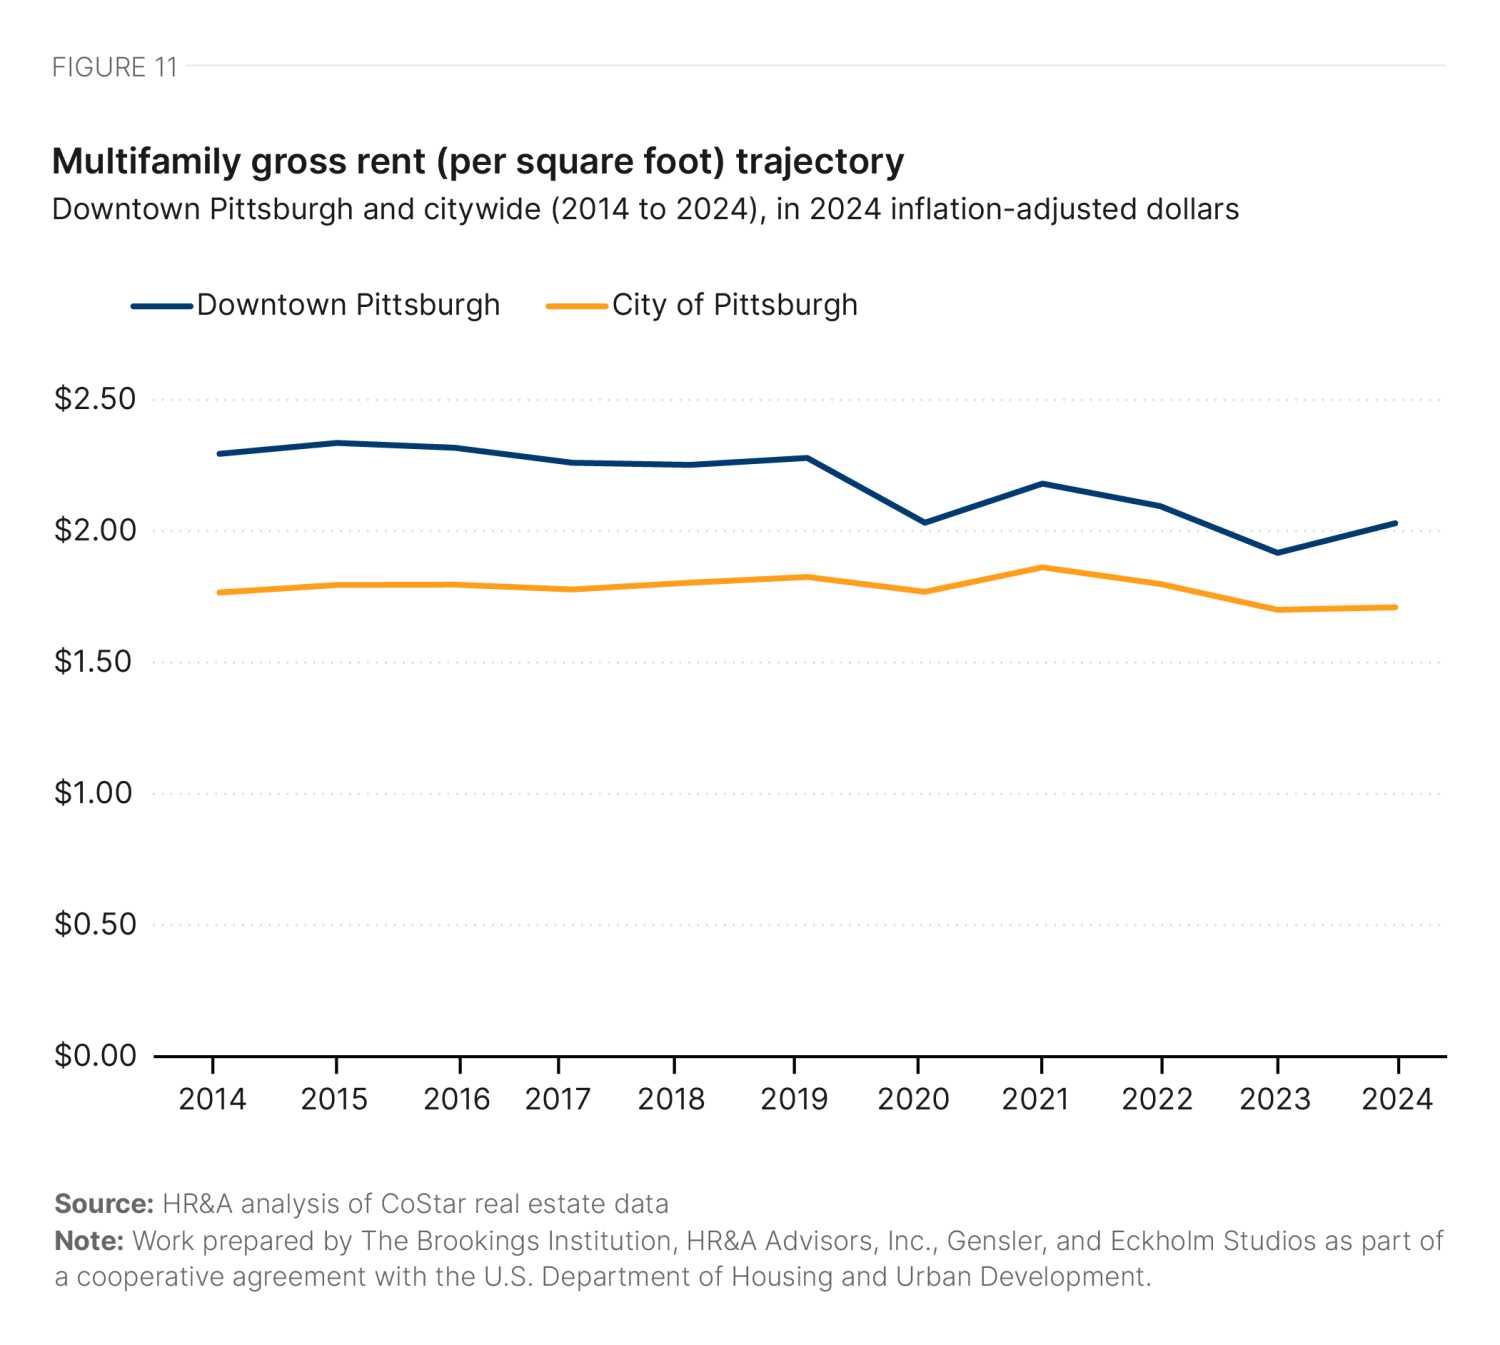
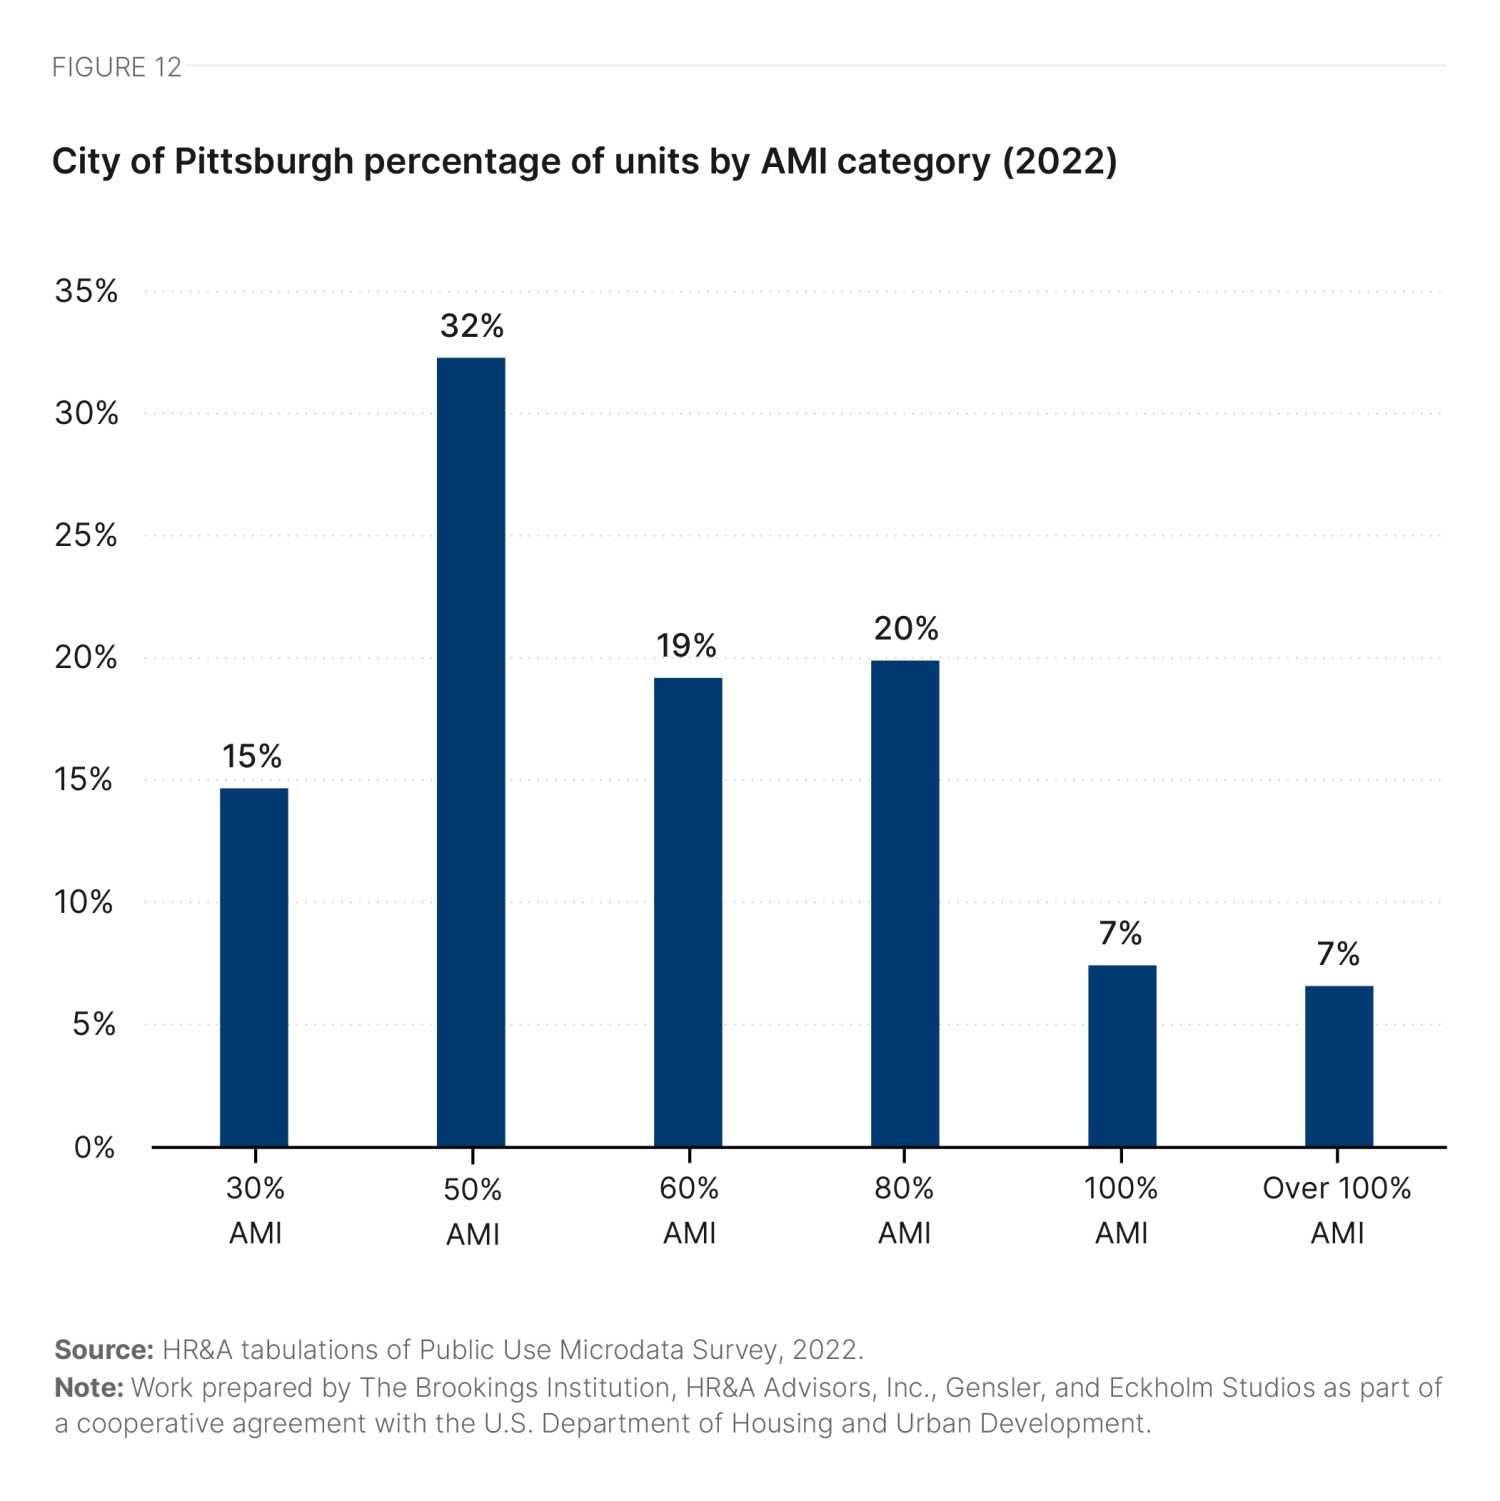
Most recently, however, the rent premium for downtown living has decreased from 30% in 2014 to 19% in 2024, as new supply increased competition (Figure 11). Today, housing units in Pittsburgh tend to be broadly affordable, with 47% renting at rates affordable to those earning 50% of the area median income (AMI)—the highest share out of any of the six case study cities (Figure 12, Table 1).5

The demographic profile of Pittsburgh’s downtown residents is notably different from the city as a whole. Seventy-three percent of the housing stock downtown consists of studio or one-bedroom units, which represent only a quarter of the citywide stock.vi Students and young professionals are the core population downtown. There are almost no children under the age of 10 living downtown, and over half (54%) of the downtown population is between the ages of 10 and 30, compared to 35% citywide.
Traditionally, [downtown] was never a place where people have wanted to live. More recently, condos have been starting to pop up. We got a Target downtown.
A Pittsburgh stakeholder
Thirty-six percent of Pittsburgh’s population is nonwhite, higher than the statewide average of 23% but lower than any of the other case study cities.6 Most of this difference can be attributed to a greater proportion of Black residents (23% compared to a statewide 11%), as the proportion of other ethnicities roughly parallels statewide averages. Downtown Pittsburgh is slightly less diverse than the city, with a Black population of 14%. The city has a lower share of Latino or Hispanic residents, comprising 5% of the downtown population and 4% of the citywide population compared to 8% statewide. Citywide, 19% of Pittsburgh residents live below the poverty line; that number is 12% downtown and statewide (Table 2).
|
Submarket |
Citywide |
Statewide |
|
|---|---|---|---|
|
Total Population |
|||
| White Alone Population Share | 69.7% | 64.5% | 77.1% |
| Black Alone Population Share | 13.6% | 23.2% | 10.8% |
| Other Share (anything other than White or Black alone) | 16.7% | 12.3% | 12.1% |
| Hispanic Population Share | 4.5% | 3.6% | 8.1% |
|
Population in Housing Units |
|||
| Poverty rate | 12.1% | 19.2% | 11.6% |
Source: Brookings analysis of ACS 2022 5-year estimates
Note: Work prepared by The Brookings Institution, HR&A Advisors, Inc., Gensler, and Eckholm Studios as part of a cooperative agreement with the U.S. Department of Housing and Urban Development.
Political, policy, and financial conditions
Pittsburgh is governed by a “strong mayor” (i.e., the mayor is the chief executive with sole power to hire and fire) and a nine-member city council, all of whom represent nonoverlapping districts. The city has a nine-member planning commission that advises the city council on zoning legislation and reviews major development and redevelopment proposals, as well as a three-member Zoning Board of Adjustment (ZBA) that reviews land use proposals—both of which are staffed by appointees of the mayor. The development regime is established in statute by the mayor and council and then interpreted by those bodies. The ZBA is required to render decisions within 45 days of a hearing. Any project that seeks to do exterior work to historic landmarks—or new construction or demolition within a historic district—must also appear before the city’s historic review commission (composed of seven members, also appointed by the mayor).
Much of the work on office-to-residential conversion policy in Pittsburgh has been led by three quasigovernmental economic development bodies: the Pittsburgh Downtown Partnership (PDP), the Urban Redevelopment Authority (URA), and the Allegheny Conference on Community Development (AC). The PDP operates downtown, the URA operates across the city, and the AC operates across Pittsburgh and its nine neighboring counties.
Since the onset of the pandemic, the city and state have made a number of policy and financial changes to streamline the process for office-to-residential conversions in downtown Pittsburgh. Across the city, there is wide recognition of the need to spur office-to-residential conversion activity, and seven conversions over 50,000 square feet have occurred since 2020.7 But there remains disagreement about the extent of public subsidy offered, and whether new residential products should include affordability requirements.
We are certainly in a place right now where we are threatened with a significant demise of our central business district due to its underuse and misuse. We need to reposition our built environment. We have an overreliance on commercial real estate.
A Pittsburgh stakeholder
Pittsburgh stakeholders are generally aligned on the need to spur more office-to-residential conversion activity. Top motivations cited for conversion include:
- Preserving the downtown tax base, which is facing a projected revenue loss of about 10%.
- Preserving iconic heritage buildings with high vacancy rates, such as the BNY building.
- Generating new housing and creating a more attractive downtown living environment.
However, there remains tension regarding the types of new housing that should be delivered, and the degree to which new housing should be associated with affordability and labor requirements. While this is true, most units downtown—including affordable units—are studios and one-bedrooms, and advocates have argued there is a need for more affordable options for families.
There is tension between the mayor and the governor. The mayor is insisting on all affordable housing, including conversion. All housing projects are being reviewed through this lens. This creates an untenable situation [for real estate development]. Downtown Pittsburgh already has more affordable units than anywhere else in the city.
A Pittsburgh stakeholder
From a fiscal perspective, to rebuild the city’s tax base, there is high interest among some local advocates in promoting conversion of office assets to condominiums, as Pittsburgh has one of the highest condominium fee transfer taxes in the country, at 5%. In addition, multiple respondents cited the 2017 conversion of Schenley High School into apartments as a successful heritage conversion project that generated tax revenue for the city.
The city and state have recently made a number of policy changes to streamline the process for office-to-residential conversions in downtown Pittsburgh:
- In 2022, the mayor and council passed legislation revising the city’s zoning code to allow conversions to happen more or less by-right, without requiring approval of the planning commission.
- In 2024, the city made a number of additional process changes, including:
- Eliminating floor area ratio limitations on residential construction.
- Folding all permit reviews into one permit application. A pre-meeting is required to socialize information and expectations between applicants and staff.
- In 2025, the city is considering a measure that would remove the requirement to create parking when building new housing.
However, some developers note that certain aspects of Pittsburgh’s policy environment still prove limiting for conversion activity. In particular, the state’s requirement of two egress options in all multifamily buildings presents a challenge for conversion of Pittsburgh’s many older office buildings with smaller floor plates. A state technical advisory committee is currently studying modifying the state’s building code to allow single-exit multifamily buildings up to six stories.
The city and state have recently launched a number of programs to close the financing gap on office-to-residential conversion projects. These programs include the following new tools:
- The Pittsburgh Downtown Partnership created the “Paris to Pittsburgh” program, offering a series of small grants for facade and retail activation.
- The City Council passed an enhancement to the Downtown Local Economic Revitalization Tax Assistance Act (LERTA). The revised LERTA offers up to a 100% tax abatement over 10 years, dependent on affordable housing and job creation.
- The Urban Redevelopment Authority launched a pilot Pittsburgh Downtown Conversion Program (PDCP), which offers zero-interest loans to projects, with loan values scaling based on affordability. The pilot had $5.1 million from the state and federal American Rescue Plan Act funds in FY 2023, and has since been augmented by a portion of the city’s recent $31 million affordable housing bond.
- The state assembly approved an increase to the state historic preservation tax credit, increasing the cap from $5 million to $20 million per project.
However, financing remains a significant barrier to successful office-to-residential conversion in Pittsburgh. “The top barrier to adaptive reuse is simply that the financing gap is bigger than the [net operating income],” said one interview respondent. “In other words, paying zero taxes for 10 years still doesn’t make these conversions pencil.”
Respondents highlighted that cost for conversions was driven in part by the need for associated streetscape improvements in downtown: “To do the project, we need to light the street, to redo the sidewalk,” said a respondent. There was hope that the state of Pennsylvania might play a more active role in allocating discretionary grant funding to offset public infrastructure costs associated with conversion projects.
An overview of the main state and local tools respondents cited as available to support conversion in Pittsburgh is shown in Table 3.
|
Type |
Name |
Details |
|
|---|---|---|---|
|
Grant |
|||
| Grants for facade and sidewalk activation; a 50% match of up to $50,000 per façade. | |||
| Grant for up to $3 million for transit-oriented development projects. | |||
| Grant program administered by the Office of the Budget for regional economic, cultural, civic, recreational, and historical improvement projects. | |||
|
Tax abatement |
|||
| Up to 100% 10-year tax abatement on building improvements. | |||
|
Loan |
|||
| Zero-interest loans to projects; must rent at least 20% of units to households at or below 80% of AMI. | |||
|
Subordinate loan program for businesses in Pittsburgh. |
|||
|
Tax credit |
|||
| Historic preservation tax credit of up to $20 million per project. | |||
| Tax credit of up to $500,000 for businesses improving buildings within designated Enterprise Zones. | |||
Note: Work prepared by The Brookings Institution, HR&A Advisors, Inc., Gensler, and Eckholm Studios as part of a cooperative agreement with the U.S. Department of Housing and Urban Development.
Past and future conversion activity
In this political, policy, and economic environment, at least seven office-to-residential conversion projects exceeding 50,000 square feet have been completed since March 15, 2020, and at least seven more are in the planning process (Figure 13).8

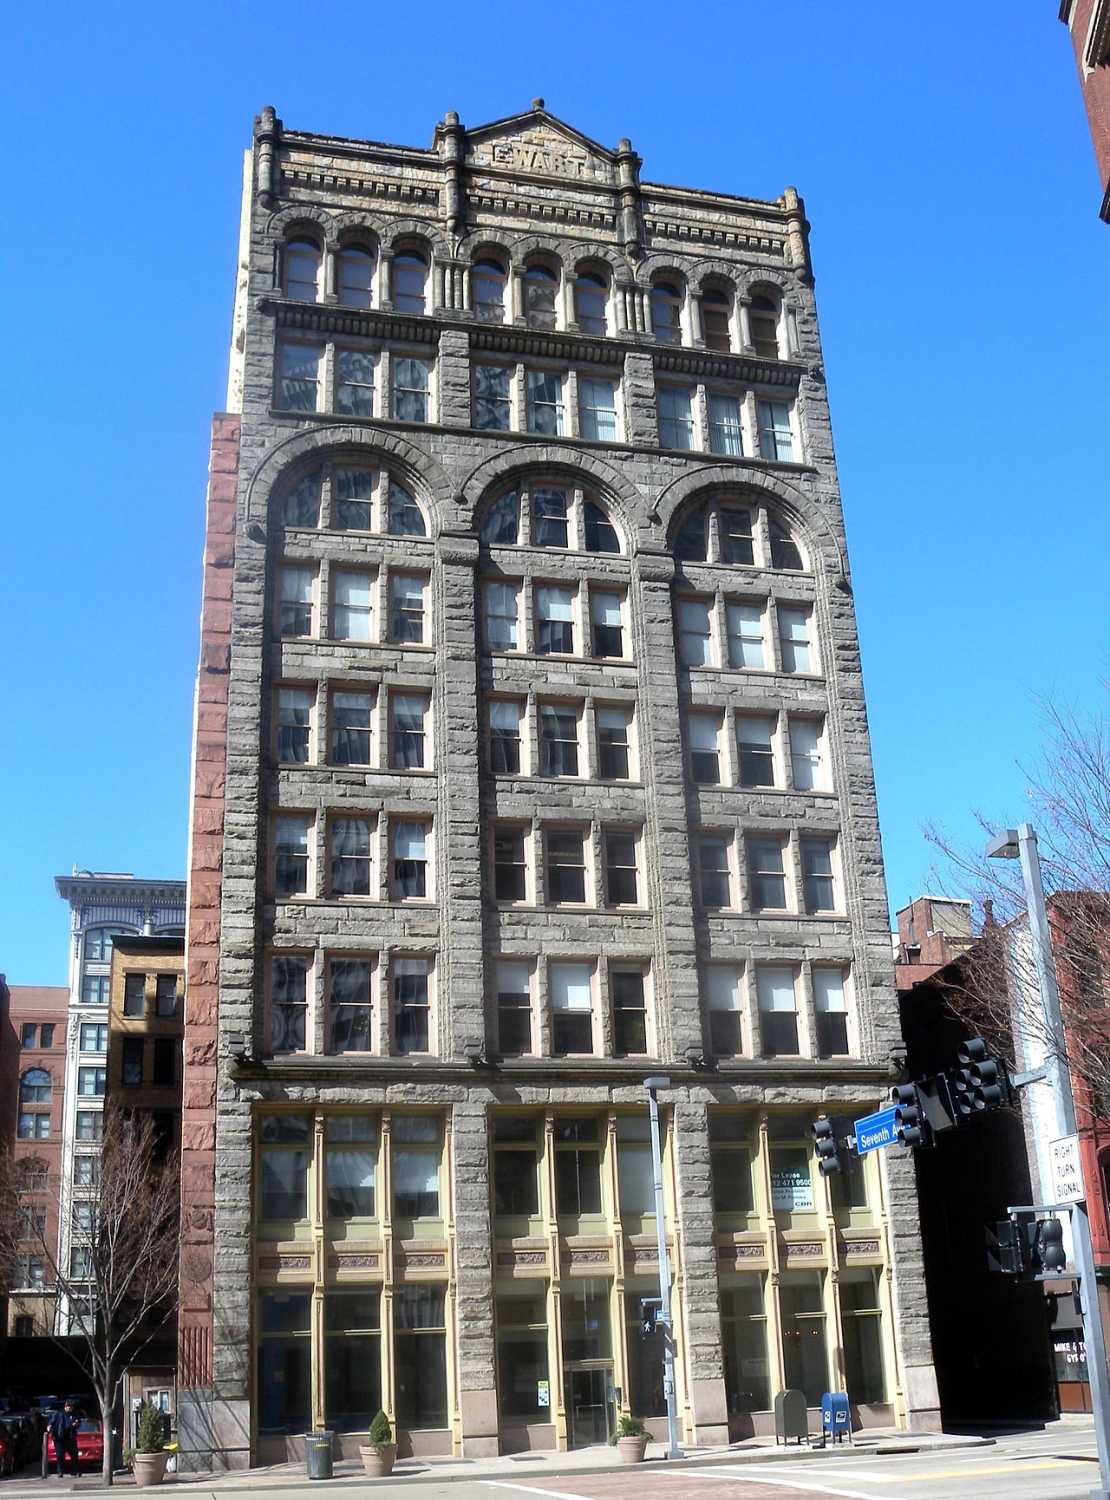
The Ivy Residences
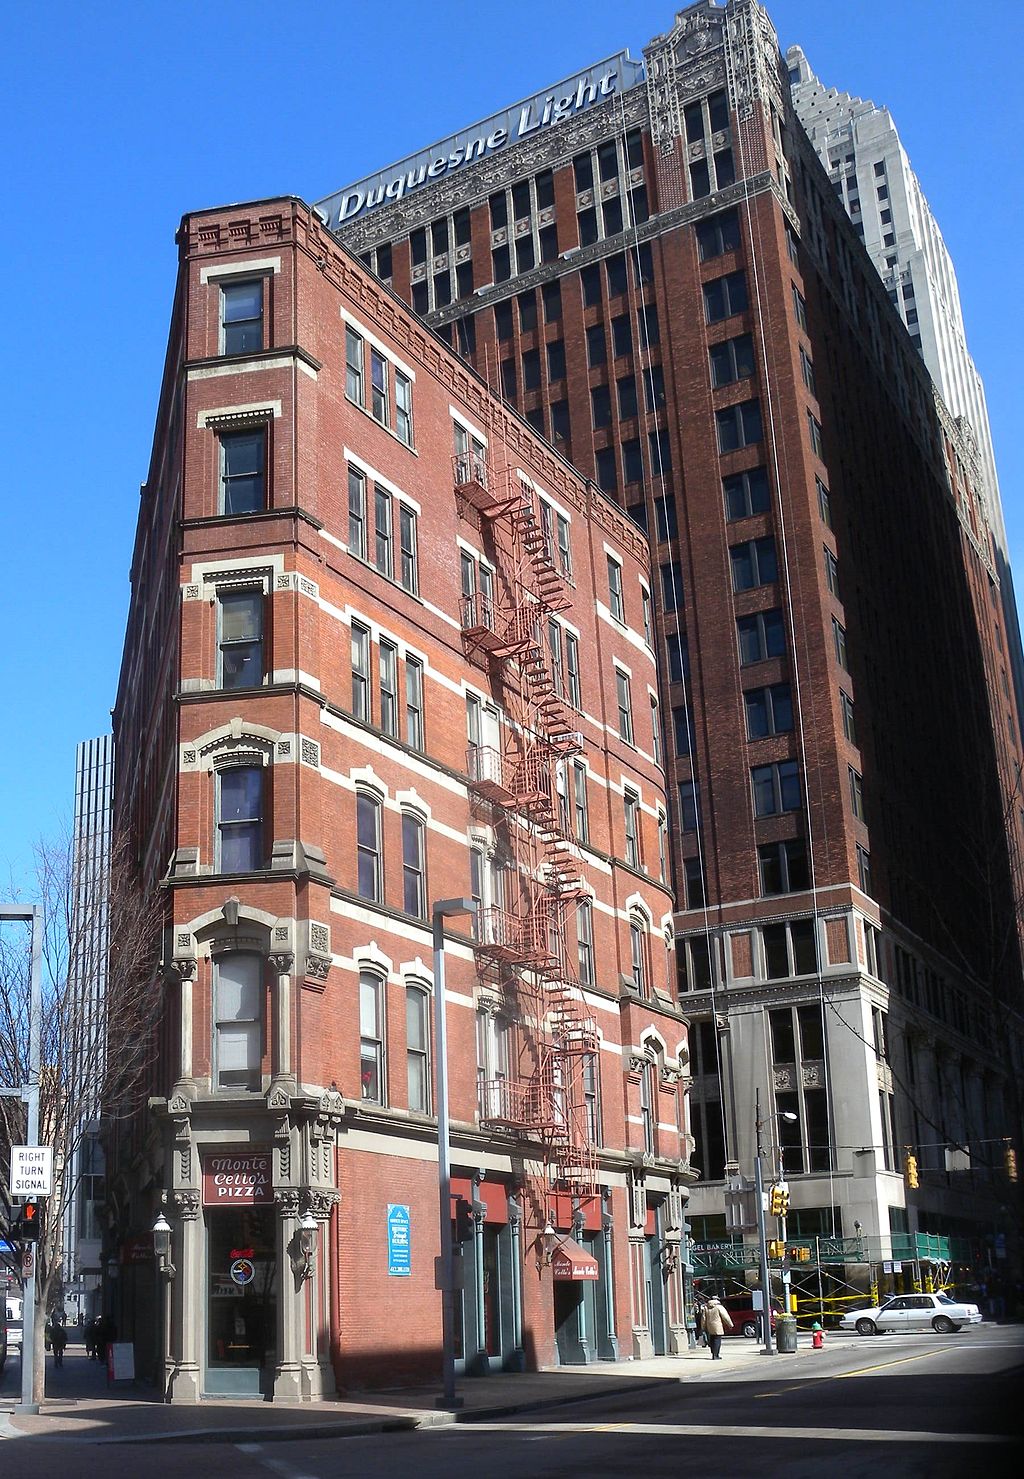
Designed by Pittsburgh architect Andrew W. Peebles in 1884, the historic “Triangle Building” resembles the Flatiron Building in New York. In 2024, it was converted into a mix of market rate and affordable units (Table 4). The conversion was financed with the capital stack shown in Table 5.
|
Name |
The Ivy Residences |
| Address | 701-705 Smithfield St. |
| Owner | Hullett Properties |
| Gross square feet | 21,600 |
| Rentable square feet | 17,250 |
| Building history | Former office |
| Year built | 1886 |
| Year converted | 2024 |
| Number of converted floors | 6 |
| Average floor plate size | 3,600 |
| Number of units | 15 |
| Unit mix by type | 5 x 1BR, 3 x 1BR/Den |
| Average rent | $2,850 |
| Average rent per square foot | $2.75 |
| Affordability | Market rate and affordable |
| Acquisition price | $1,725,000 |
Source: Authors’ analysis of CoStar real estate market data and interviews with local stakeholders
Note: Work prepared by The Brookings Institution, HR&A Advisors, Inc., Gensler, and Eckholm Studios as part of a cooperative agreement with the U.S. Department of Housing and Urban Development.
|
Financing Type |
|---|
|
Traditional financing |
| Developer equity |
| Senior construction loan |
|
City |
| Urban Redevelopment Authority subordinate loan |
| City of Pittsburgh Downtown Conversion Program loan |
| Downtown Pittsburgh Partnership facade grant |
|
State |
| State historic preservation tax credit |
| State DCED Enterprise Zone Tax Credit |
| State DCED Multimodal Transportation Fund grant |
|
Federal |
| Federal historic preservation tax credit |
| New Markets Tax Credit |
Source: Authors’ interviews with local stakeholders
Note: Work prepared by The Brookings Institution, HR&A Advisors, Inc., Gensler, and Eckholm Studios as part of a cooperative agreement with the U.S. Department of Housing and Urban Development.
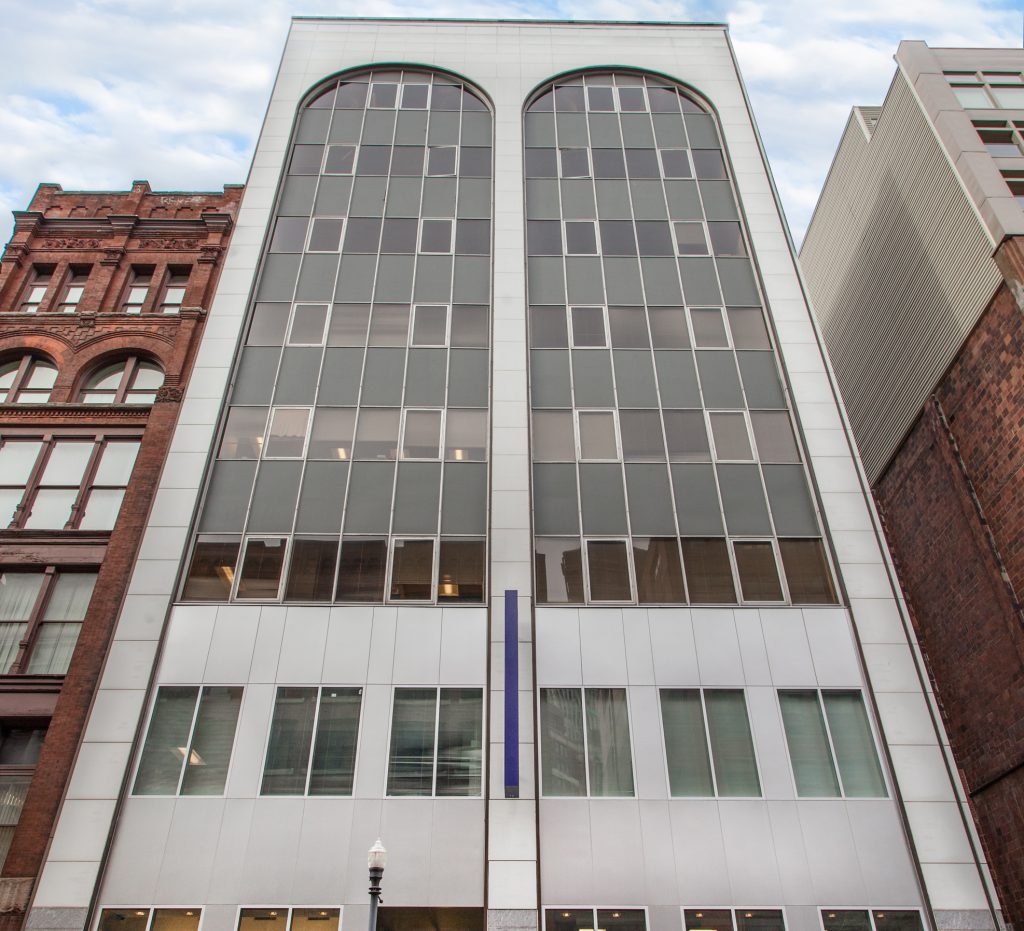
933 Penn Avenue
Once home to the Pittsburgh Dry Goods company, developers Rugby Realty and Hullett Properties are planning to convert 933 Penn Ave. into 70 units of student housing (Table 6). The team is still trying to assemble a viable capital stack (options under consideration are shown in Table 7). The project depends on successfully receiving a $2.75 million grant from the State Redevelopment Assistance Capital Program, and a $1.5 million loan from Urban Redevelopment Authority.
|
Name |
933 Penn Ave. |
| Address | 933 Penn Ave. |
| Owner | Rugby Realty |
| Gross square feet | 77,400 |
| Rentable square feet | 73,588 |
| Building history | Former office |
| Year built | 1920 |
| Year converted | Planned |
| Number of converted floors | 8 |
| Average floor plate size | 9,400 |
| Number of units | 70 |
| Unit mix by type | 7 x Studio, 28 x 1BR, 28 x 2BR, 7 x 3BR |
| Average rent | N/A |
| Average rent per square foot | N/A |
| Affordability | 10% |
| Acquisition price | $7,800,000 |
Source: Authors’ analysis of CoStar real estate market data and interviews with local stakeholders
Note: Work prepared by The Brookings Institution, HR&A Advisors, Inc., Gensler, and Eckholm Studios as part of a cooperative agreement with the U.S. Department of Housing and Urban Development.
|
Financing Type |
|---|
|
Traditional financing |
| Developer equity |
| Senior construction loan |
|
City |
| Urban Redevelopment Authority subordinate loan |
| City of Pittsburgh Downtown Conversion Program forgivable loan |
| Downtown Pittsburgh Partnership facade grant |
| Downtown Pittsburgh Street Activation Grant |
|
State |
| Redevelopment Assistance Capital Program |
| State DCED Enterprise Zone Tax Credit |
Source: Authors’ interviews with local stakeholders
Note: Work prepared by The Brookings Institution, HR&A Advisors, Inc., Gensler, and Eckholm Studios as part of a cooperative agreement with the U.S. Department of Housing and Urban Development.
Future conversion potential
We assessed the architectural conversion viability of 25 high-vacancy buildings in downtown Pittsburgh. To select these buildings, we used CoStar data to identify buildings with vacancy rates in excess of 20%. The CoStar data were then triangulated with input from qualitative interviews about potential conversion candidates and additional factors such as year built, building area, number of stories, and office class in order to identify the buildings best suited to make up a representative set of properties for architectural conversion viability analysis. Finally, three buildings were selected for detailed architectural studies based on results from the initial analysis and input from interview participants.
Buildings were assigned a percentage score to denote their architectural compatibility for conversion, and grouped into the following categories:
- Properties that score above 80% can likely convert without design comprises.
- Properties that score between 70% and 80% can likely convert with some design compromises.
- Properties that score under 70% can likely convert only with major design compromises.
From the analysis, we then projected out the number of units that would be created by converting all the scored buildings. We also projected out the greenhouse gas savings associated with unit creation via conversion rather than new build activity. A full explanation of our calculation methodology is included in Appendix A.
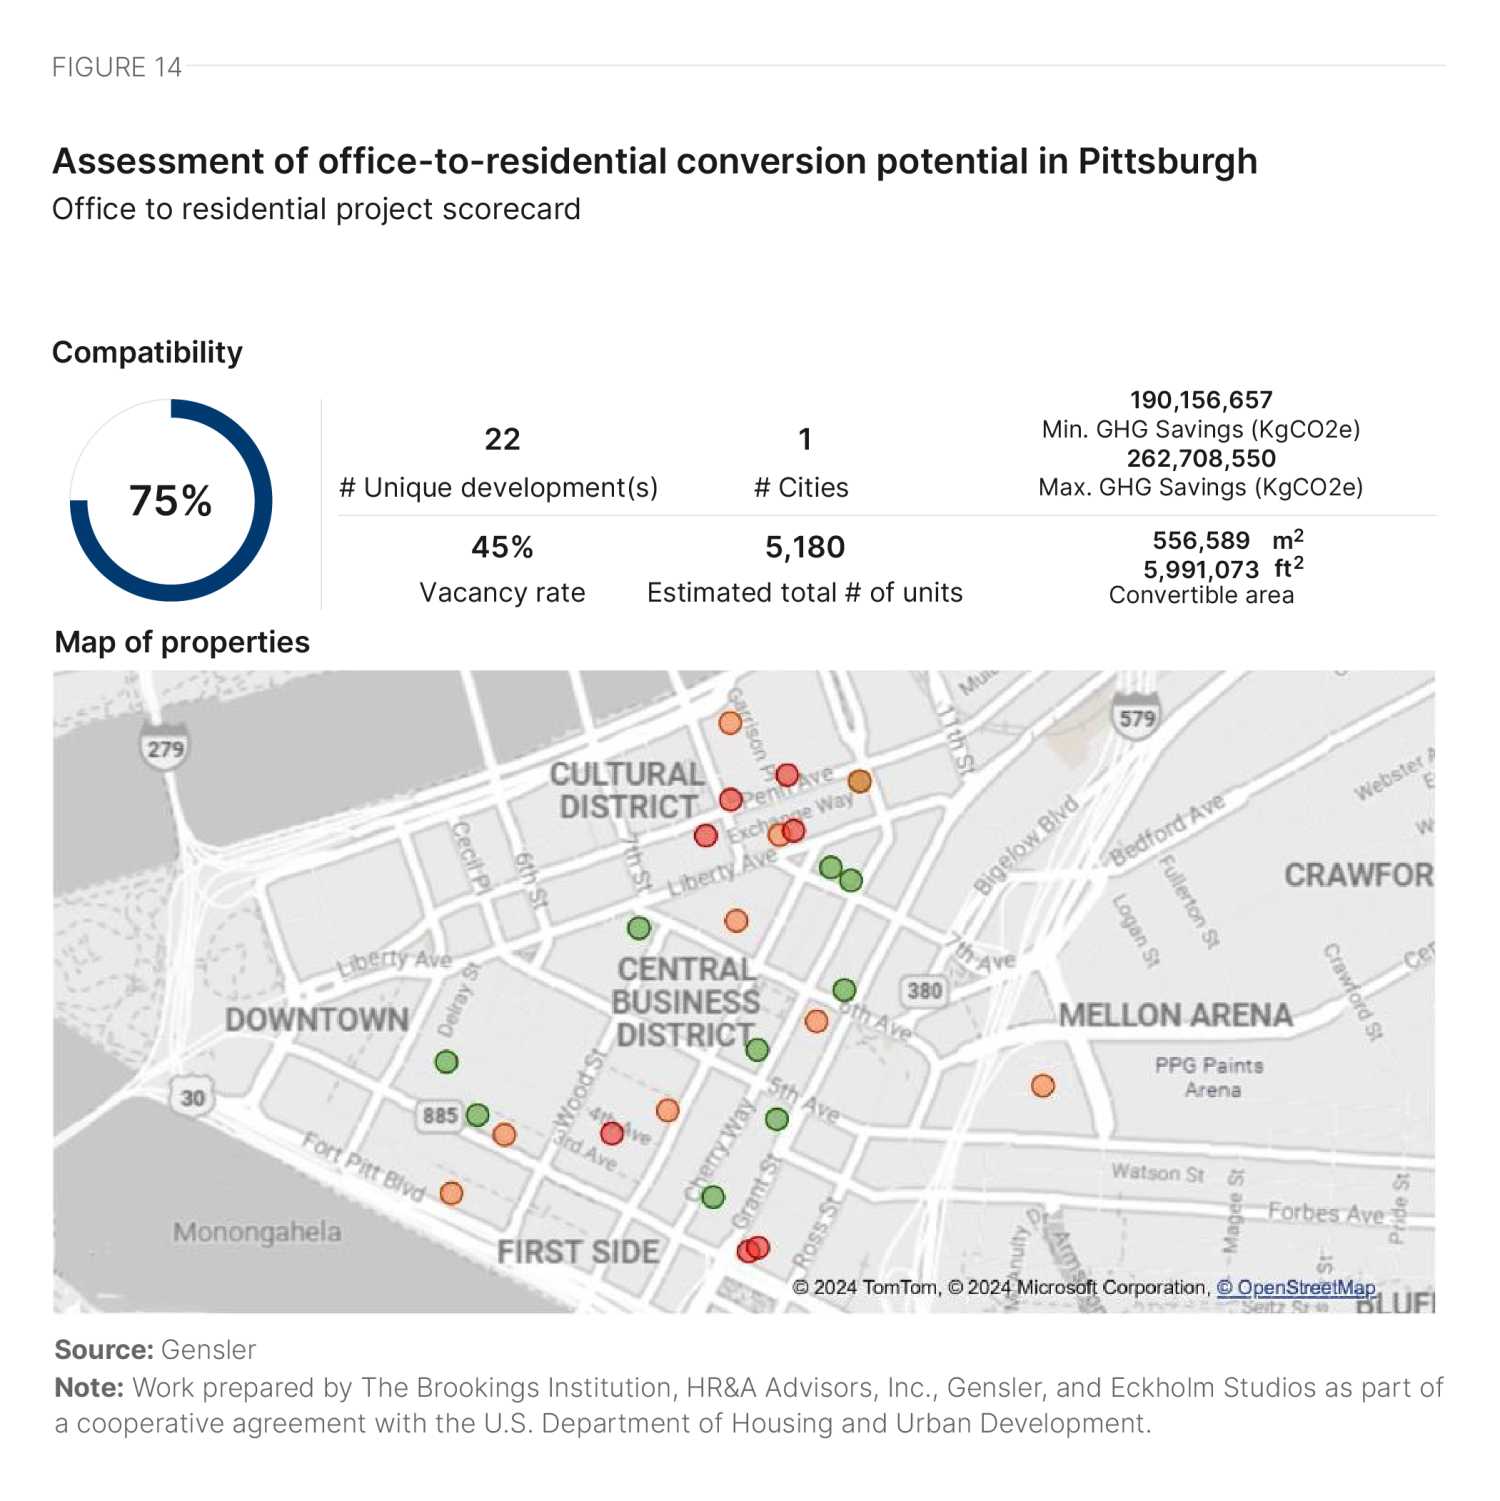
In Pittsburgh, 10 buildings account for 73% of the total building area analyzed, each scoring over 80%. Another nine buildings, making up 24% of the area, scored over 70%. These ratios align closely with Gensler’s findings from over 1,400 properties analyzed in other cities.
Most of the buildings have the desired rectangular form, but floor plate sizes vary significantly, posing challenges for some properties. For instance, Heinz 57 Center and 530 William Penn Place have large floor plates, making it difficult to utilize the deep space. These buildings, located in the central core, were built in the 1910s.
On the other hand, buildings such as 929 Liberty Ave., 931 Penn Ave., and 510 Third Ave. have small floor plates and fewer facades with desired openings, rendering parts of the floor plate unusable or highly inefficient without major changes. These buildings are mainly in the cultural district and were built before 1920 on interior zoning lots.
In Pittsburgh, we have a lot of buildings that fit dimensional appropriateness [for conversion]. We have a lot of [older] smaller floor plate buildings.
A Pittsburgh stakeholder
Excellent walkability and a robust transit system—including buses, light rail, incline, and paratransit—have a positive impact on the scores for all buildings analyzed. Facade types range from curtain walls to punched windows, variably affecting the overall score. Buildings constructed before the 1960s (such as 601 Grant St., 530 William Penn Place, and 925 Liberty Ave.) have punched windows, while most buildings built after the 1960s (such as 1 PPG Place and One Oxford Centre) feature curtain wall facades. Approximately 75% of the buildings analyzed in Pittsburgh have punched windows, contributing positively to their scores.
525 William Penn Place
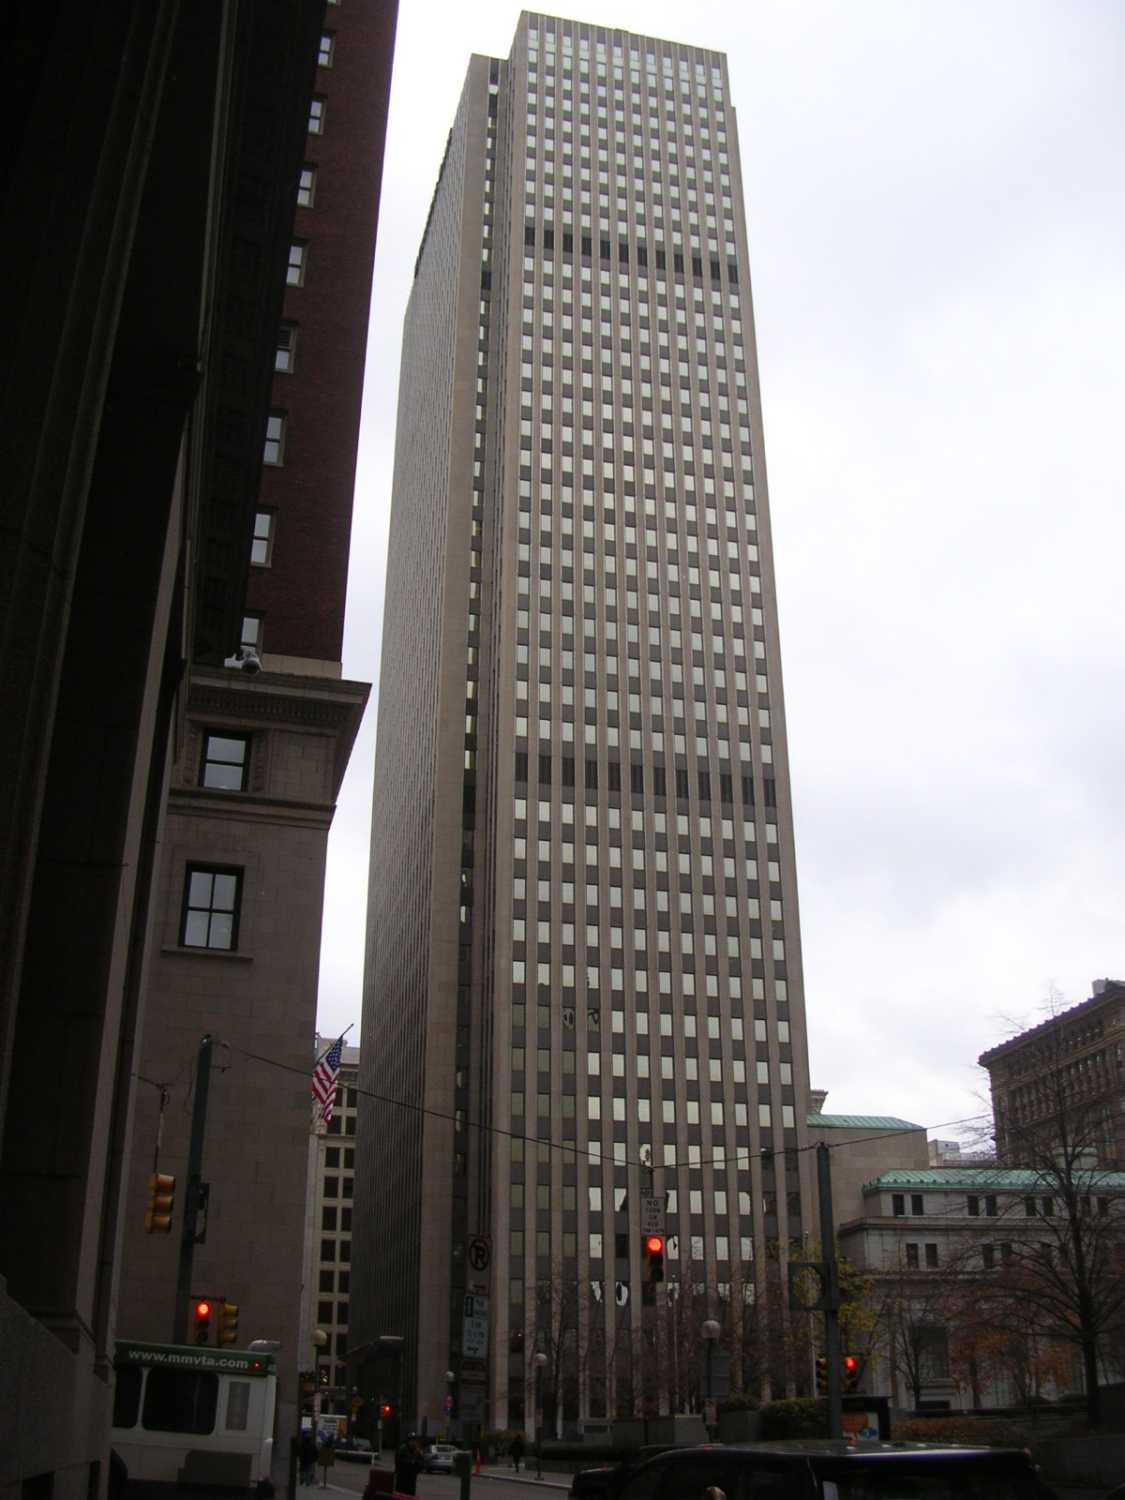
525 William Penn Place sits centrally at the intersection of Fifth Avenue and William Penn Place. Built in 1951, it is a 41-story structure with a gross area of 953,127 square feet.
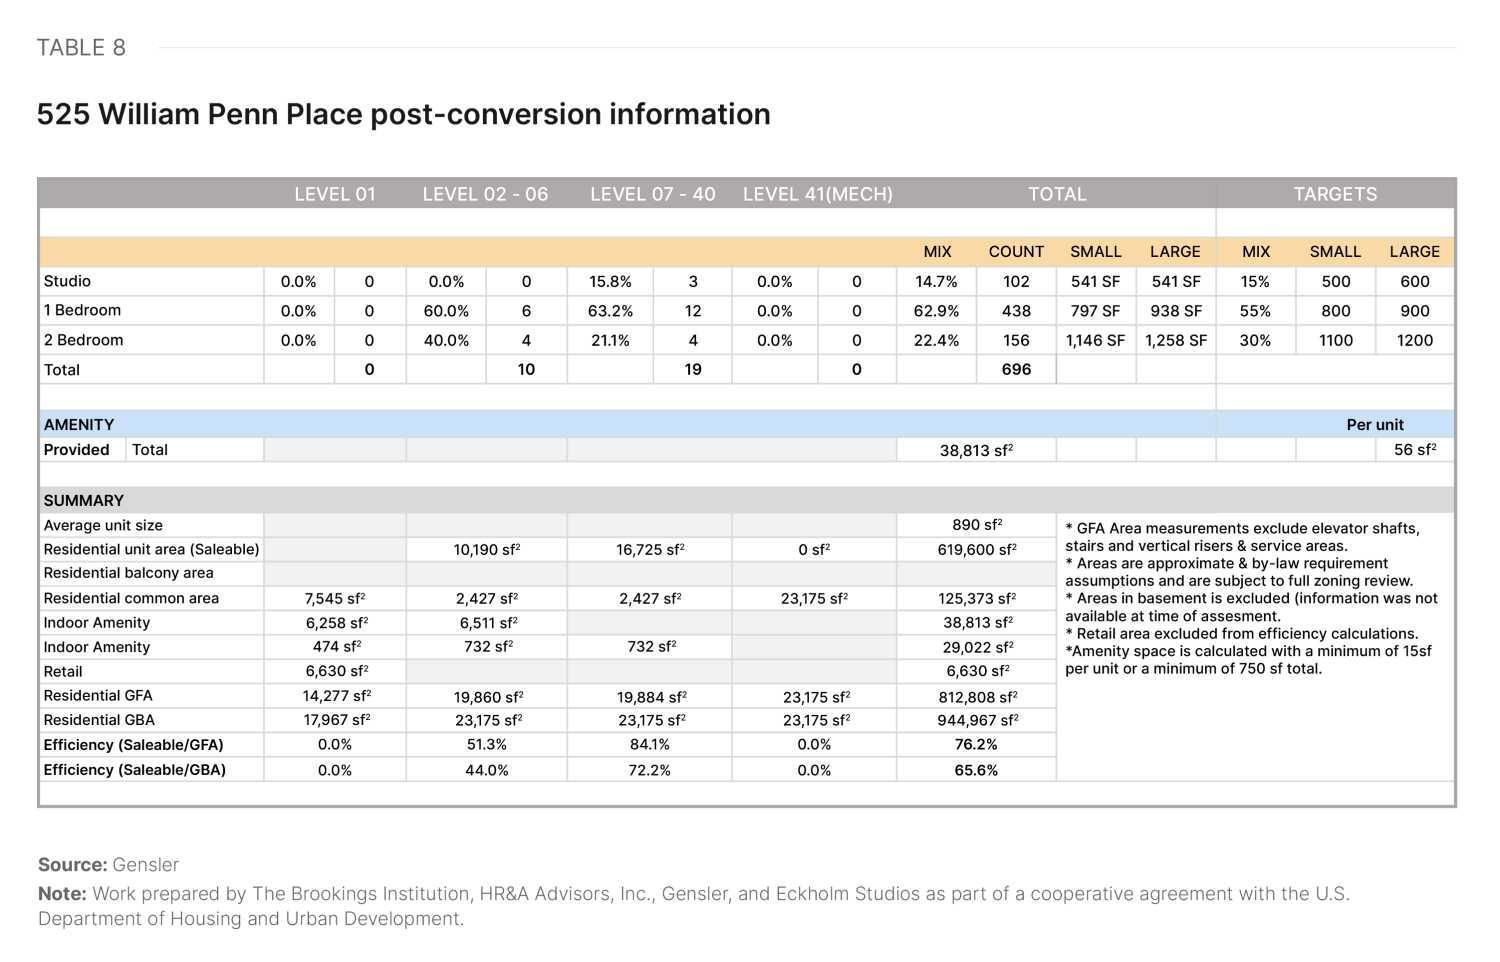
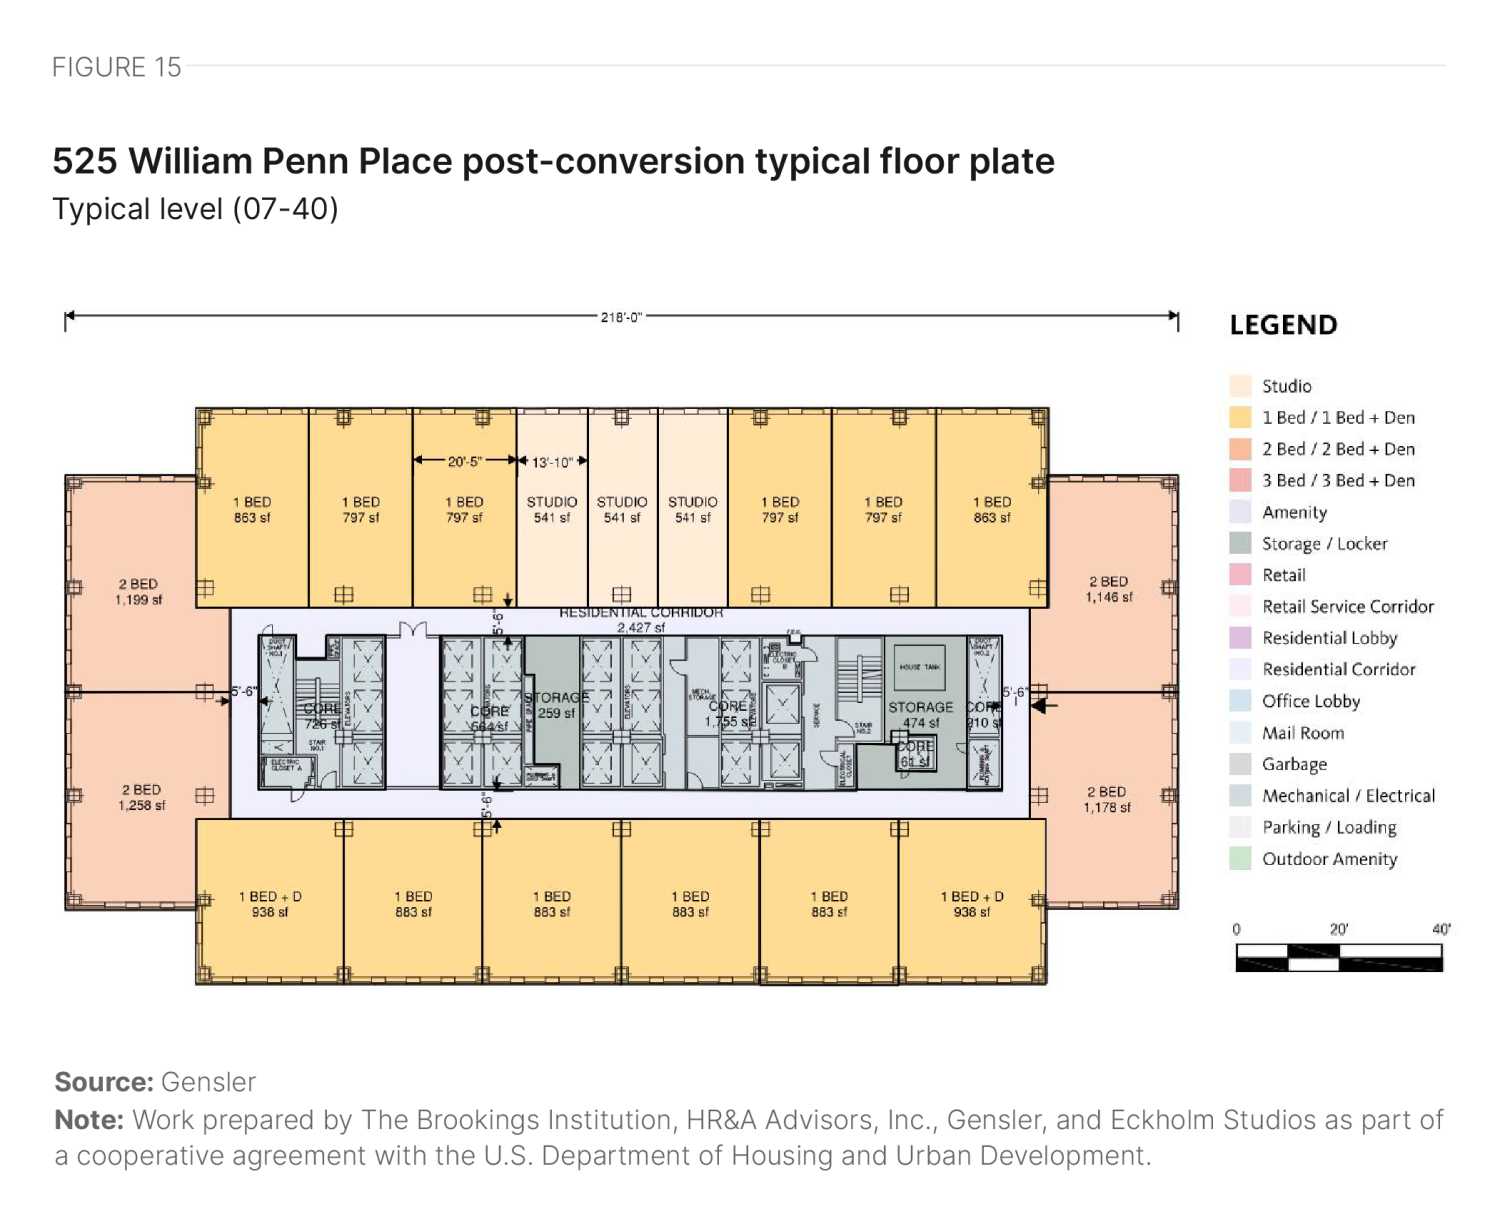
The building features a rectangular floor plate with a central core and a relatively good floor plate size. The core-to-window depth is also close to ideal, allowing for good floor plate efficiency (Figure 15) and yielding units close to market size (yield shown in Table 8).
Some lower levels are obstructed by an adjacent building on the west side, creating space that cannot be used for units. A developer could introduce amenities in these spaces, but the overall efficiency of the building is impacted. The elongated core with multiple elevator cores also creates interstitial interior spaces, where a developer could introduce storage use.
The façade consists of punched windows on all sides, providing good access to views and daylight. The developer may need to add operable sections. Part of the ground floor would likely be retail, while part would be dedicated to the residential lobby and service areas.
601 Grant Street
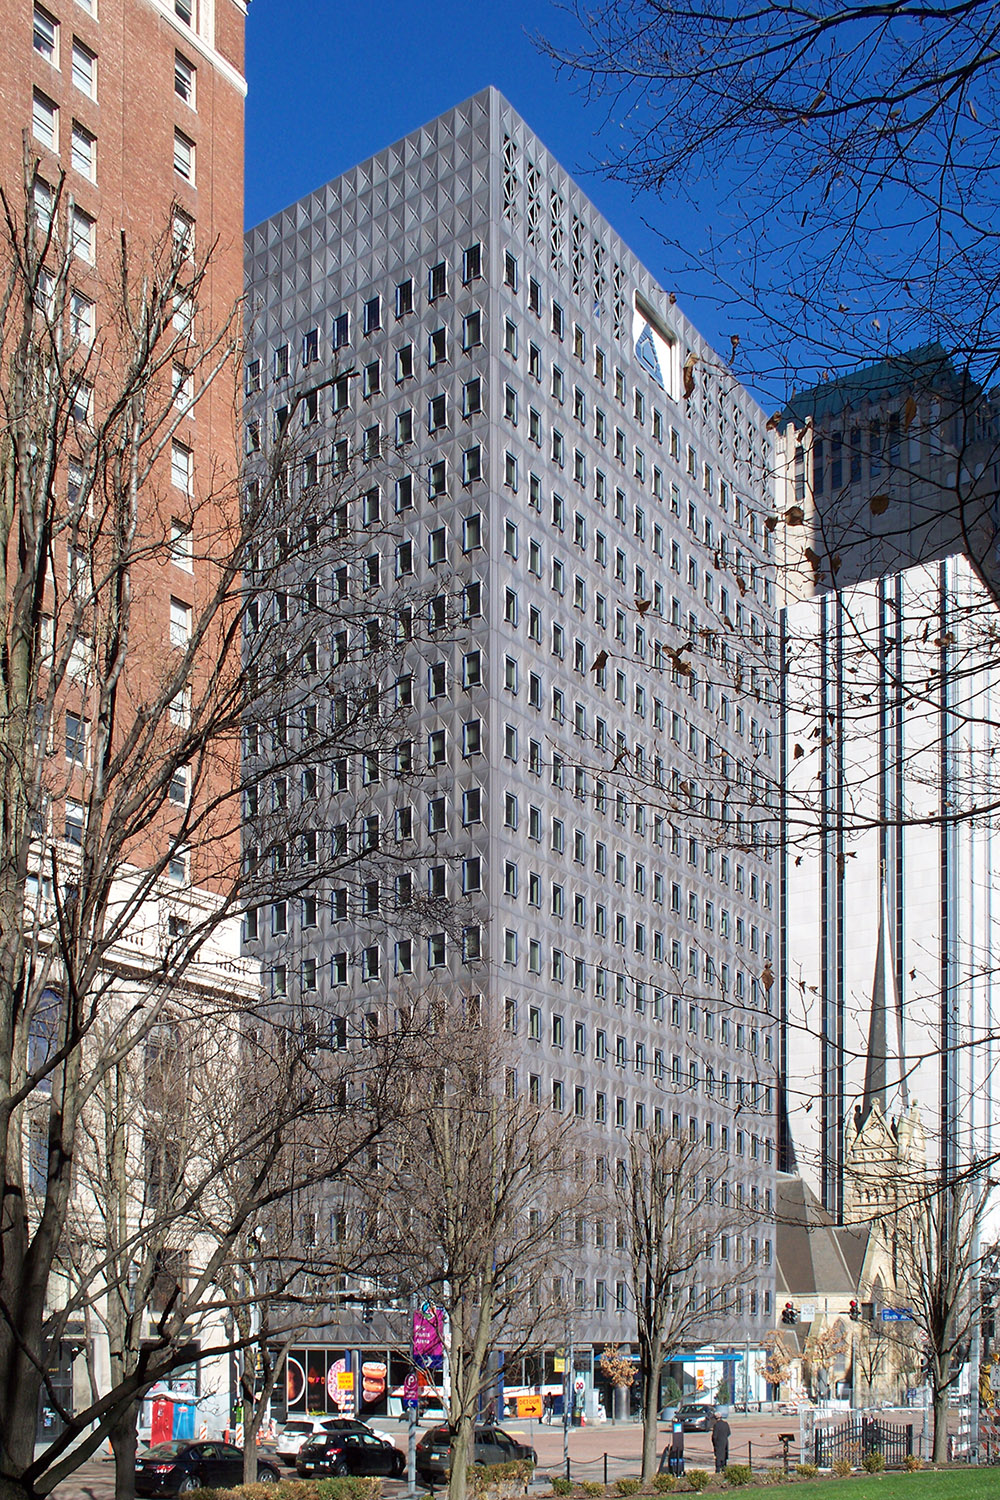
601 Grant St. sits at the intersection of Sixth Avenue and Grant Street. Built in 1958, it is a 17-story structure with a gross area of 181,747 square feet.
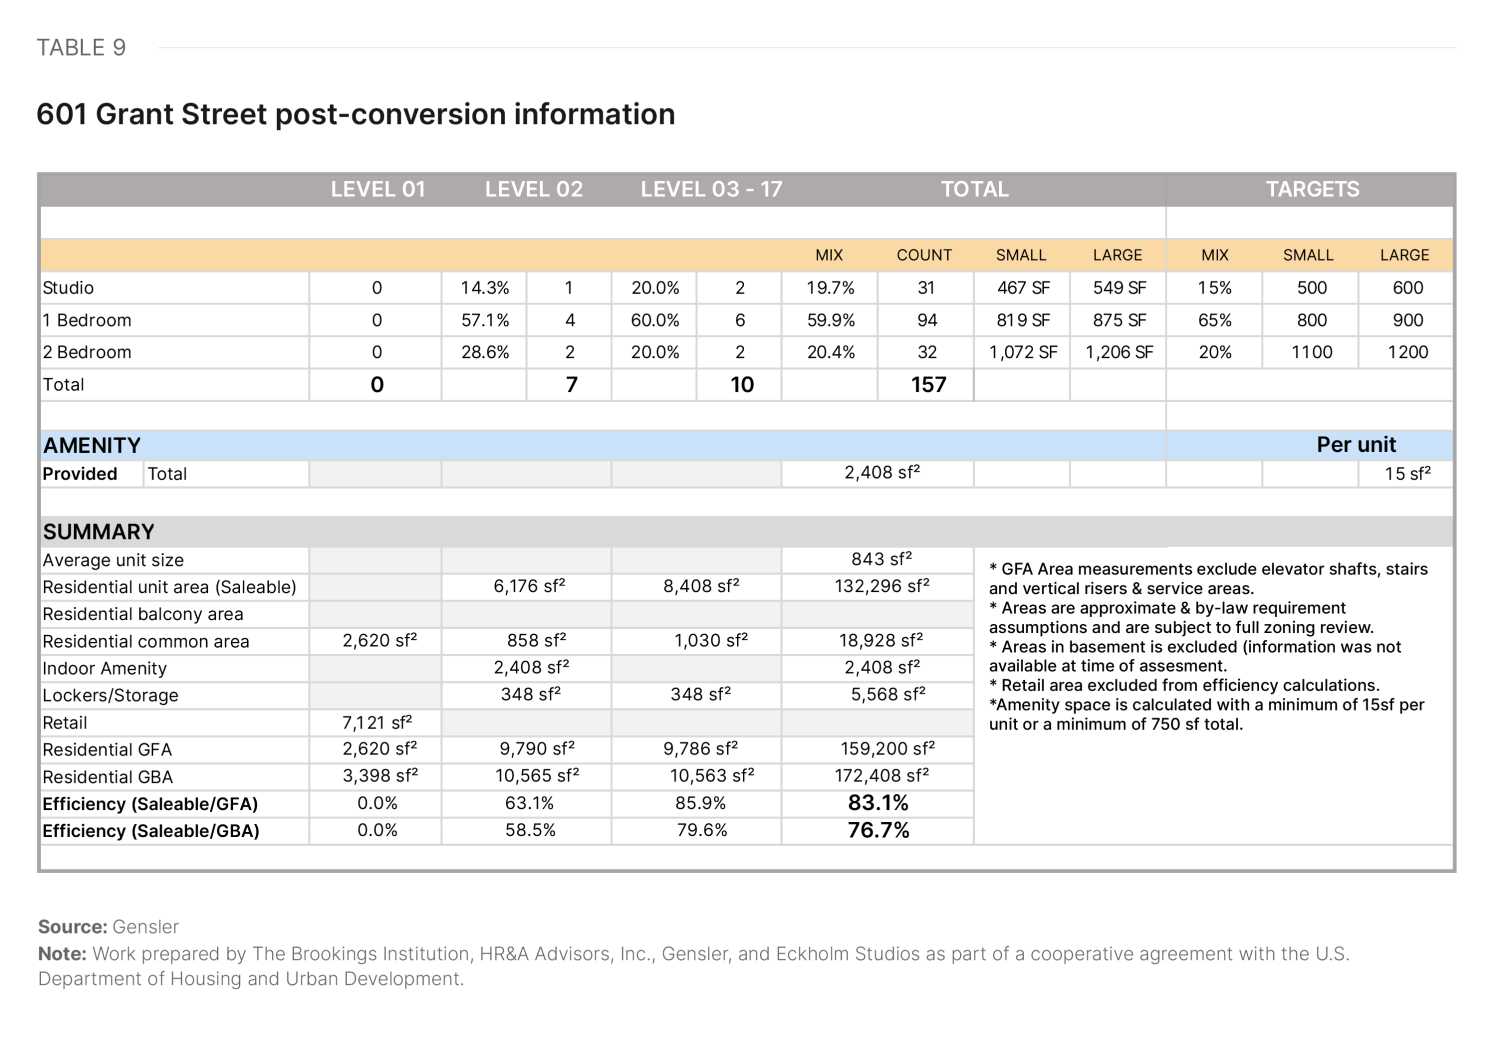
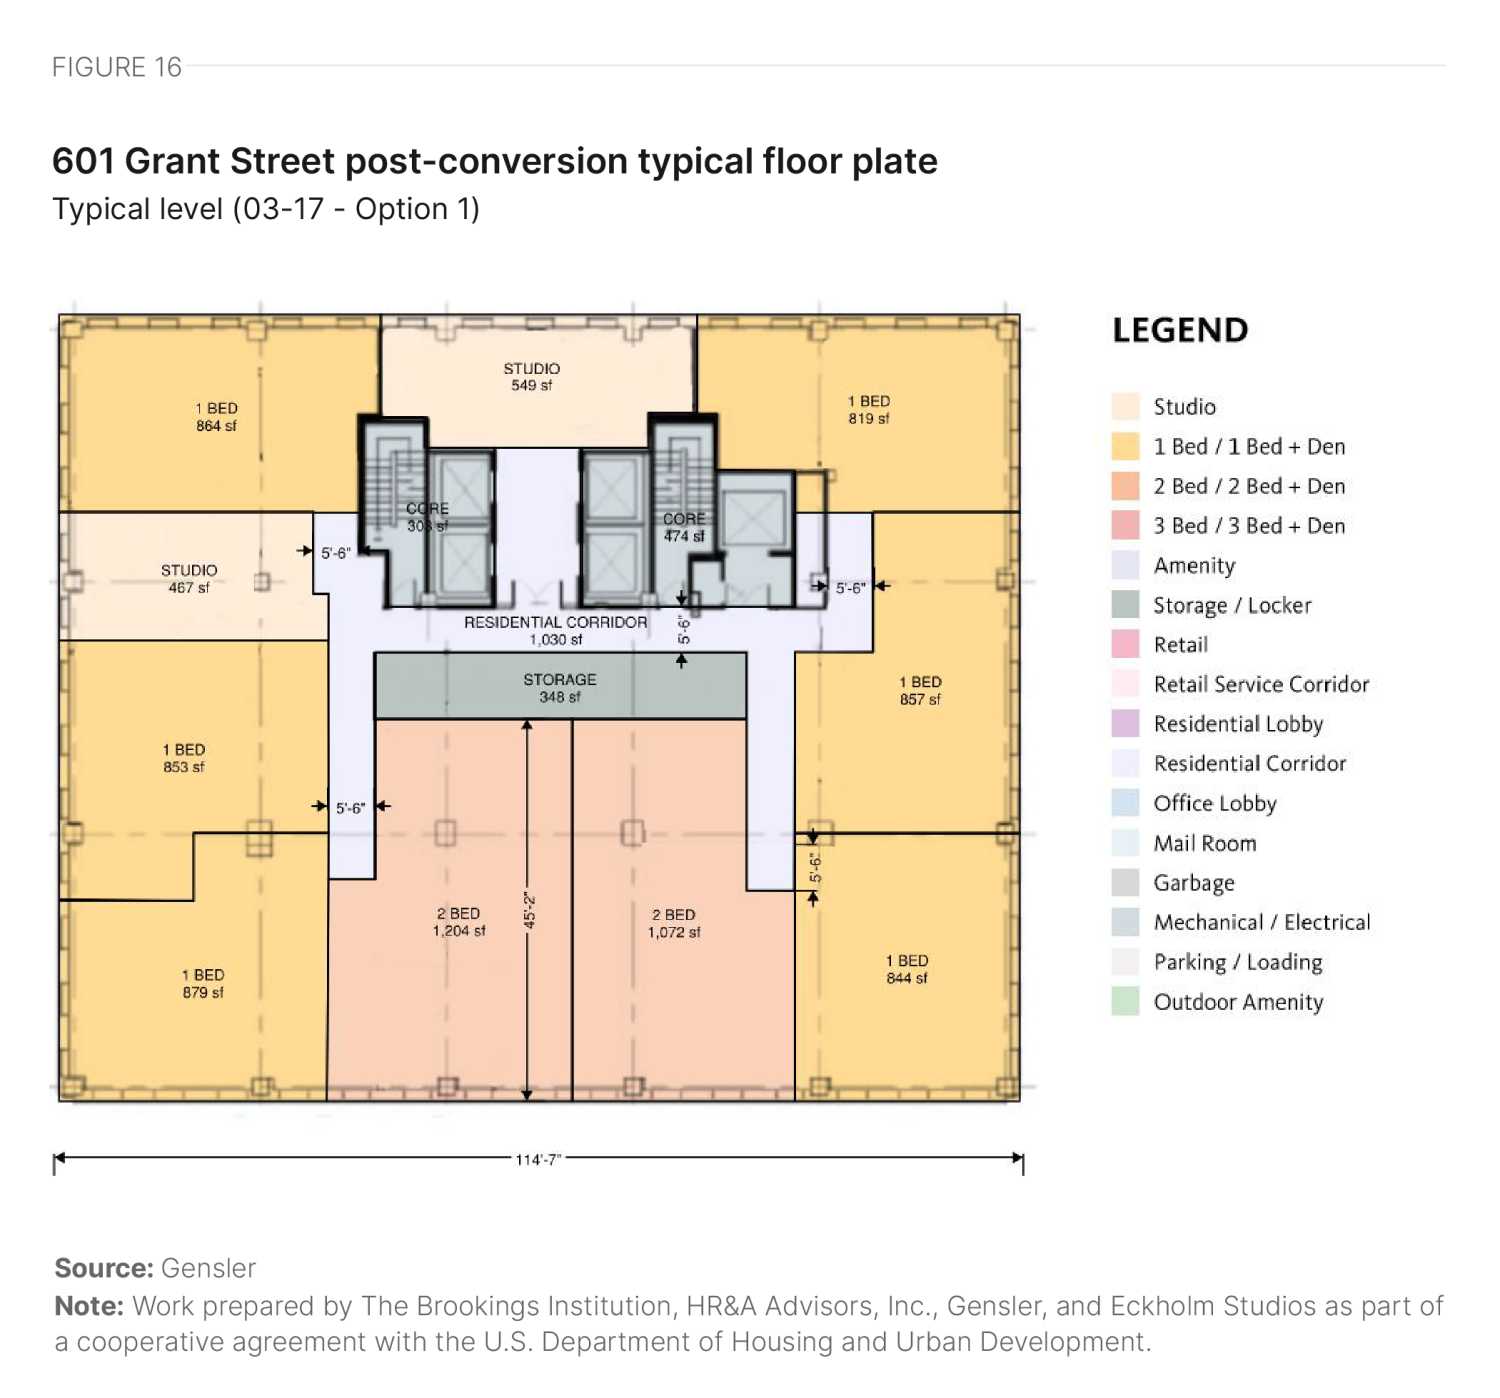
The building features a rectangular floor plate with an off-centered core, but the floor plate size remains relatively good, allowing for strong floor plate efficiency (Figure 16). The off-centered core creates varying core-to-window depths, resulting in deeper units on the east side and shallower units on the west side. A developer could introduce storage in deep spaces that do not have direct access to natural light. The full potential yield is summarized in Table 9.
The façade consists of punched windows on all sides, providing strong access to views and daylight. A developer may need to add operable sections. We expect the majority of the ground floor would convert to retail, with some space dedicated to the residential lobby and service areas.
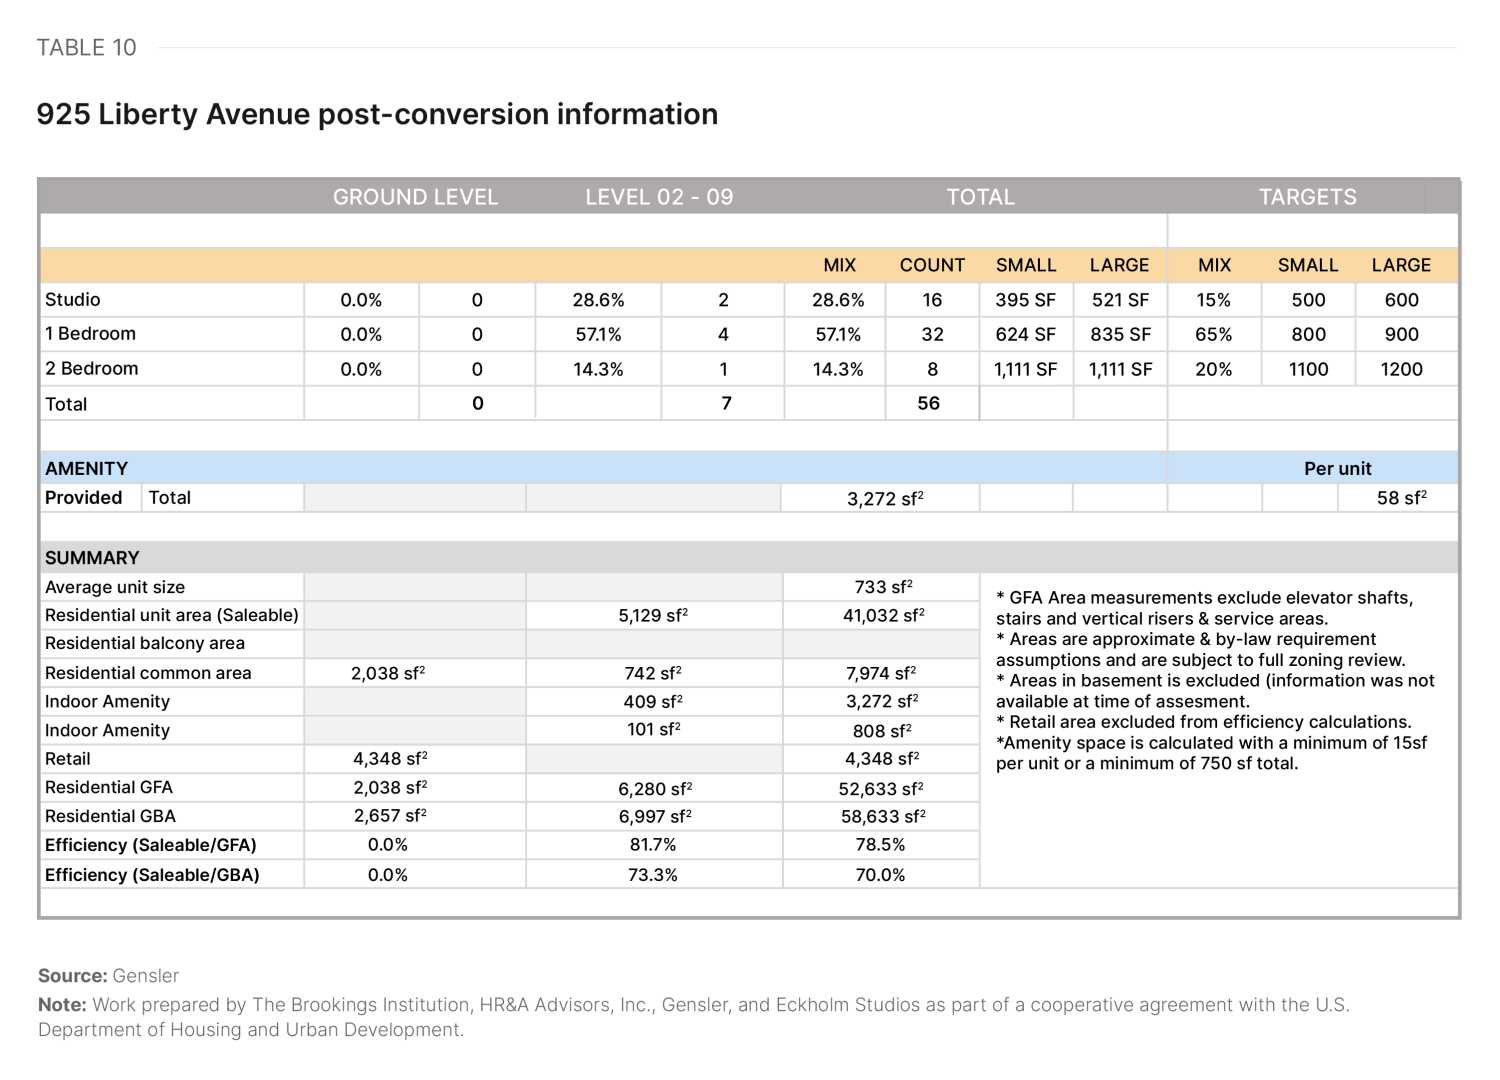
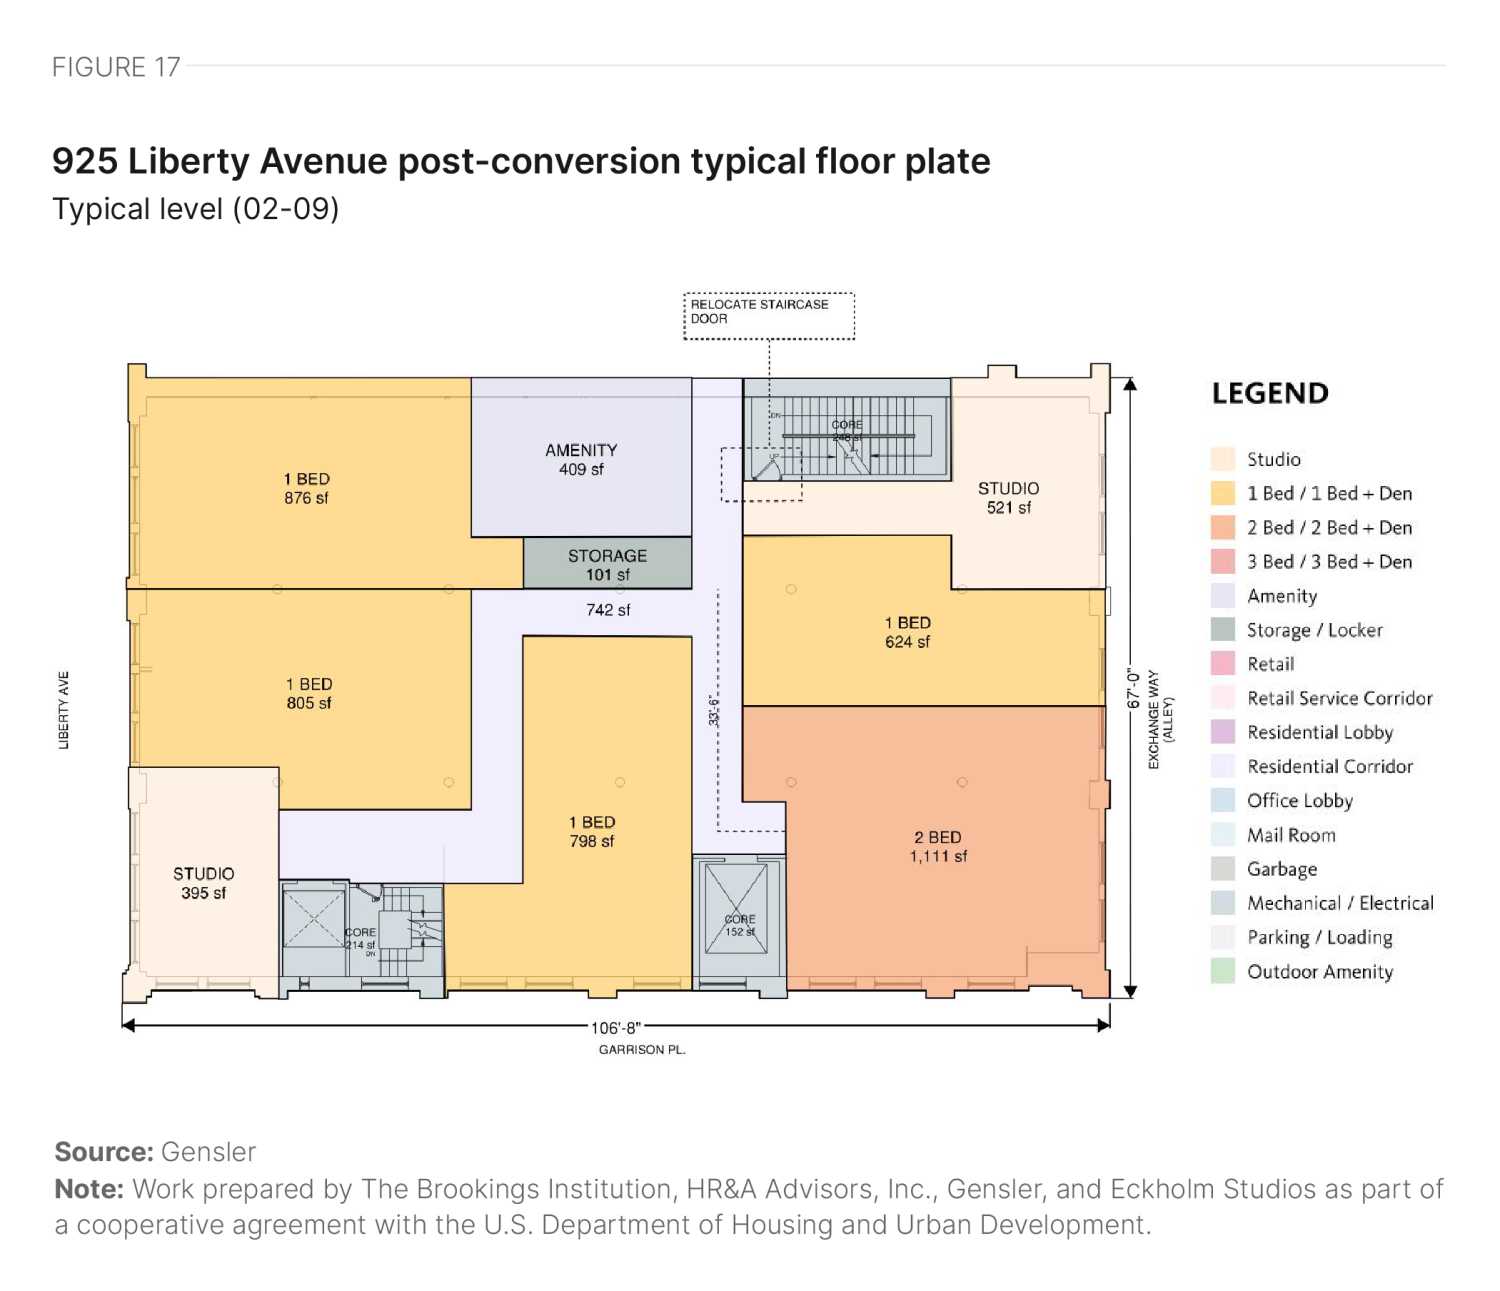
925 Liberty Avenue
925 Liberty Ave. sits at the intersection of Liberty Avenue and Garrison Place. Built in 1900, it is a nine-story structure with a gross area of 62,703 square feet.
The building features a rectangular floor plate with no defined core and a smaller-than-ideal floor plate size. The varying locations of the elevator and stair cores, along with the core-to-window depth, allow for a reasonable level of floor plate efficiency (Figure 17). The small floor plate and varying core result in units close to market size, but lead to a constrained unit mix (yield summary in Table 10). The developer can introduce amenities in deep spaces that do not have direct access to natural light.
The façade consists of punched operable windows on three sides, providing good access to views and daylight. Once again, the majority of the ground floor could become retail, with some space dedicated to the residential lobby and service areas.
Future outlook
While travel demand (total unique visits) in the city of Pittsburgh is up 22% from the fall of 2019, trips starting or ending in downtown are still down 12% from the 2019 baseline. Using cell phone location tracking data, Table 11 presents estimates of the number of unique visitors on a typical Thursday downtown and citywide in fall 2019 and 2023. It shows a significant underutilization of a central location with 270-degree waterfront exposure, served by infrastructure that just a few years ago was supporting a much larger daytime population.
|
Winston-Salem |
St. Louis |
Pittsburgh |
Houston |
Los Angeles |
Stamford |
|
|---|---|---|---|---|---|---|
|
Citywide |
||||||
| Fall 2019 | 972,648 | 1,139,210 | 1,042,281 | 10,416,616 | 13,082,015 | 427,544 |
| Fall 2023 | 1,083,344 | 1,224,894 | 1,269,712 | 10,732,698 | 13,265,515 | 523,890 |
| Percent Change | 11% | 8% | 22% | 3% | 1% | 23% |
|
Downtown |
||||||
| Fall 2019 | 46,014 | 119,880 | 120,850 | 275,304 | 793,111 | 102,939 |
| Fall 2023 | 45,570 | 113,112 | 106,773 | 242,267 | 747,974 | 124,271 |
| Percent Change | -1% | -6% | -12% | -12% | -6% | 21% |
Source: Replica Data
Note: Work prepared by The Brookings Institution, HR&A Advisors, Inc., Gensler, and Eckholm Studios as part of a cooperative agreement with the U.S. Department of Housing and Urban Development.
Downtown Pittsburgh has an abundance of office stock to potentially convert, alongside growing demand for downtown living. However, realizing a mixed-use downtown will require substantial public investment.
Can federal support be used to attract young people to second-tier cities [like Pittsburgh]? I think there is a real opportunity to spur that kind of growth, which is also diverse growth…We need to incentivize people to live downtown. That means more market rate housing but also better amenities. We need to make it attractive.
A Pittsburgh stakeholder
Local business leaders, working through the Allegheny Conference, have crafted a plan to revitalize downtown Pittsburgh, and are in the process of fundraising for it. The Allegheny Conference’s challenge is how to package together the right federal programs to realize their vision. While the Infrastructure Investment and Jobs Act of 2021 has ample funding for cities like Pittsburgh, its fragmented, grant-by-grant approach was not designed for the downtown-wide change that Pittsburgh hopes to achieve.
In trying to access federal tools, we can't easily find a path forward to cobble together the funding and the tools to deliver on a comprehensive plan for downtown. So we are looking at a million dollars here and $2 million there.
A Pittsburgh stakeholder
While downtown Pittsburgh’s challenges may loom large, the fundamental fact is that the downtown footprint is actually very small. At the scale of infrastructure, a relatively small capital infusion—well under $1 billion—could catalyze far more private investment to completely modernize and remake the built environment of the Pittsburgh core.
Authors’ note: After this case study was finalized, in October 2024, Pennsylvania Governor Josh Shapiro announced a historic plan to invest $600 million in revitalizing downtown Pittsburgh, including direct grants to a number of the conversion candidates featured in this study and investment into downtown public spaces.
Office-to-residential conversion case studies


Authors
Authors listed in alphabetical order


-
Acknowledgements and disclosures
This research was supported by the U.S. Department of Housing and Urban Development under a cooperative agreement.
The authors thank Hanna Love for her review of this piece.
The authors also thank the following contributors for their invaluable assistance on this project:
Brookings:
- Mary Elizabeth Campbell – Research Assistant
HR&A:
- Stefan Korfmacher – Research Analyst
- Clark Ricciardelli – Analyst
- Gensler:
- Diksha Jain – Architect
- Ingmar Buchner – Designer
- Lisa Matthews – Intern
- Nancy Yeh – Designer
- Jose Segura – Architect
Turner Construction:
- Reinaldo Rodriguez
All remaining errors and omissions are those of the authors themselves.
The work that provided the basis for this publication was supported by funding under an award with the U.S. Department of Housing and Urban Development. The substance and findings of the work are dedicated to the public. The author and publisher are solely responsible for the accuracy of the statements and interpretations contained in this publication. Such interpretations do not necessarily reflect the views of the Government.
-
Footnotes
- HR&A analysis of CoStar real estate market data from 2010 to Q3 2024.
- HR&A analysis of CoStar real estate market data for Q3 2024 and authors’ interviews with local stakeholders.
- Multiple respondents noted that vacancy rates were likely underreported, due to a lag in reporting.
- HR&A analysis of CoStar real estate market data for Q3 2024.
- Area median income (AMI) is a key metric used in assessing housing affordability. It is defined as the median (midpoint) of a specific geography’s income distribution (such as a metropolitan area) for different household sizes. It is calculated each year by the U.S. Department of Housing and Urban Development (HUD). According to HUD, households should pay no more than 30% of their gross income on housing, and households that pay more than 30% are considered “housing cost burdened.” HR&A’s analysis of the percentage of units by AMI category in a market begins by establishing “affordable rent levels” that are equivalent to 30% of income at AMI for different household sizes; e.g., for a one-person household in an area with AMI of $X, the “affordable monthly rent level” would be ($X * 30%) / 12. With those rent levels established, the analysis compares unit rent levels to AMI levels at the household sizes that correspond to the number of bedrooms in a unit; e.g., a one-bedroom unit’s rent is compared against 30% of the AMI of a one-person household, and so on.
- Brookings analysis of American Community Survey 2022 5-Year Estimates.
- HR&A analysis of CoStar real estate market data for Q3 2024 and authors’ interviews with local stakeholders.
- HR&A analysis of CoStar real estate market data for Q3 2024 and authors’ interviews with local stakeholders.
The Brookings Institution is committed to quality, independence, and impact.
We are supported by a diverse array of funders. In line with our values and policies, each Brookings publication represents the sole views of its author(s).