This publication is part of a broader series examining the potential of office-to-residential conversions across six U.S. case studies. The project is part of a cooperative agreement with the US Department of Housing and Urban Development, and the research team is composed of contributors from Gensler, HR&A Advisors, Brookings, and Eckholm Studios.
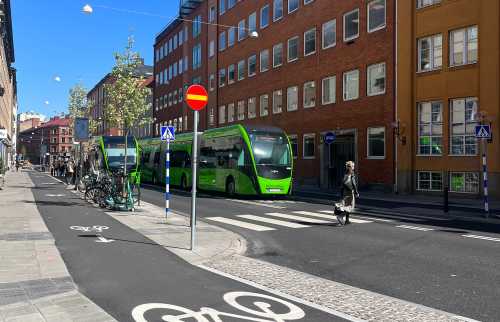
Since its population peak of 856,000 in 1950, St. Louis has shrunk to one-third its former size while remaining a nationally significant multimodal transportation hub. Though population loss continued throughout the 2000s, the urban core saw residential growth—a positive development for a city that relies on earnings taxes. But perceptions of an “urban doom loop” in downtown have threatened that trend, especially since the COVID-19 pandemic—reflecting (and perhaps contributing to) drastically decreased leasing activity and negative absorption for residential units. Adjacent areas continue to grow, and foot traffic is only slightly below pre-pandemic levels.
Downtown suffers from highly concentrated vacancies in highly visible properties, such as the Railway Exchange Building (vacant since 2014) and the AT&T Tower (vacant since 2017). Despite negative absorption rates, the city sees office-to-residential conversions as a critical tool for achieving revitalization. Completed and planned projects have made use of a generous state historic preservation tax credit and city property tax abatements. To convert the large properties that make up most of its office vacancies, the city is considering more drastic measures such as tax increment financing and tax-exempt bonds.
St. Louis history and context
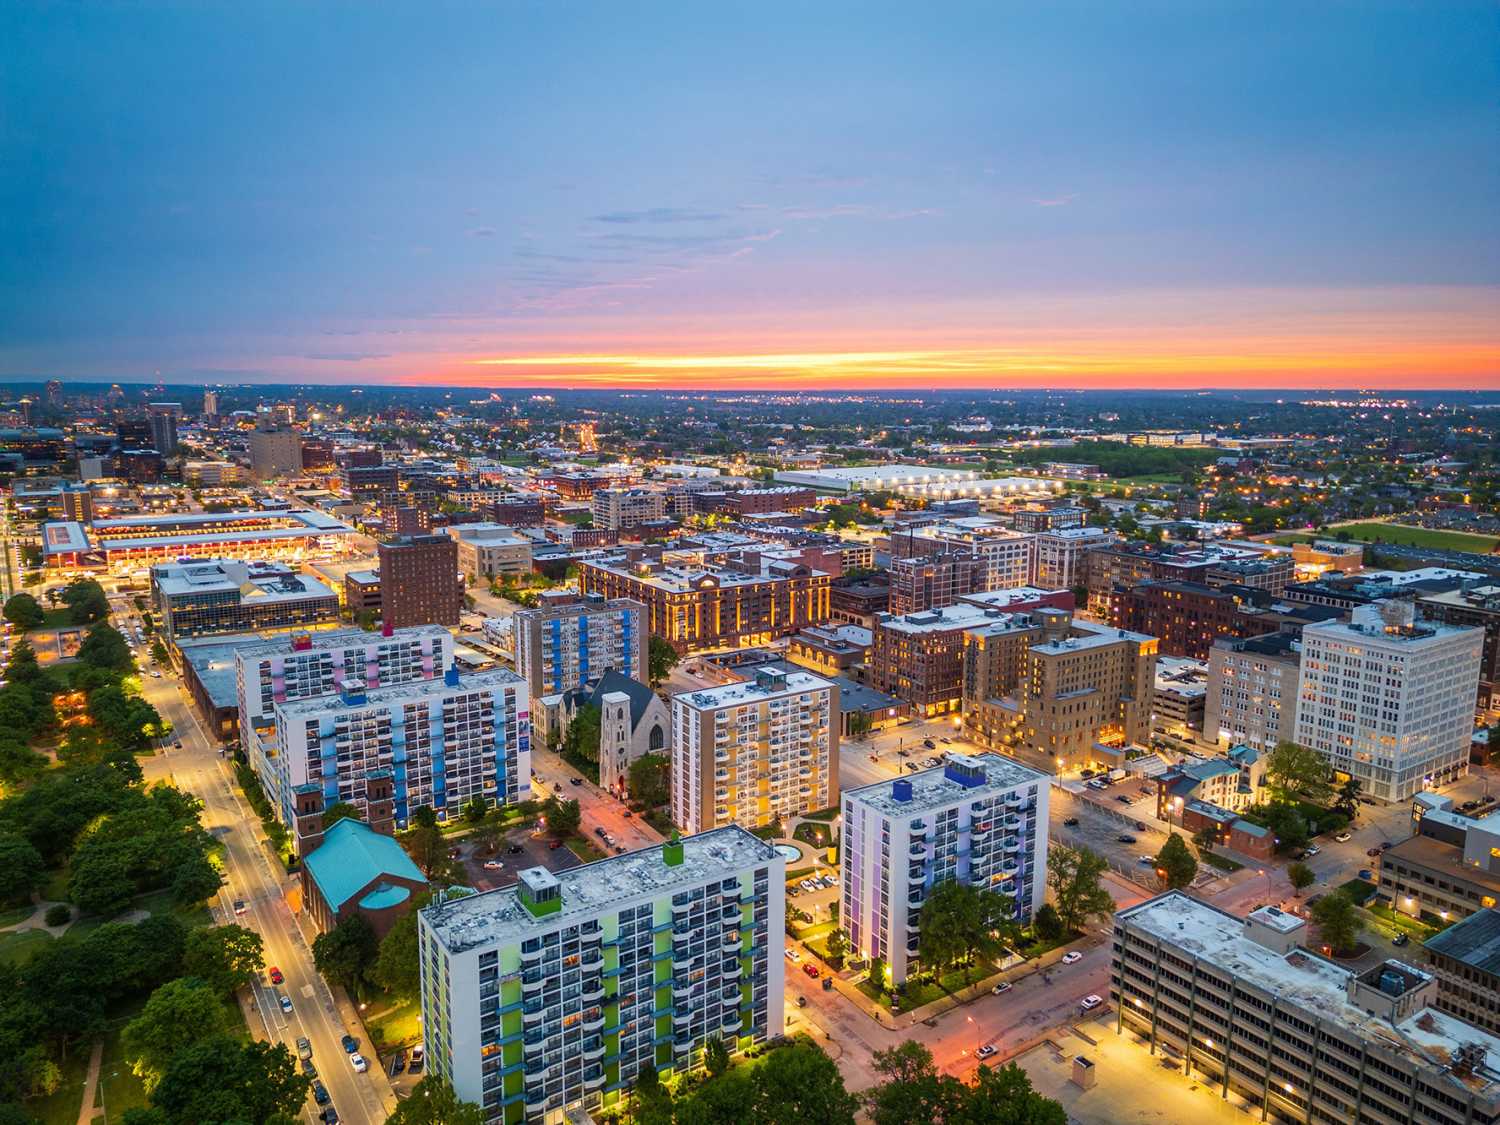
Located right below the convergence of the Mississippi and Missouri rivers, the city of St. Louis gained prominence as the “Gateway to The West” during the early 19th century. St. Louis formally established itself under home rule in 1876, separating from St. Louis County and delineating its current fixed boundaries and area of 61.7 square land miles. At the time, the city had plenty of room to grow within this footprint, but eventually, these landlocked boundaries would limit its expansion.
Rapid population and economic growth characterized 19th century St. Louis. The city’s position along the Mississippi River allowed it to capitalize off the transport of goods and people via steamboat. In addition, the construction of the Eads Bridge in 1874 formally linked St. Louis to the transcontinental railway as a major pass-through between eastern and western rail. In the Gilded Age, St. Louis emerged as a stronghold for manufacturing, interstate transportation and logistics, and major corporate headquarters.
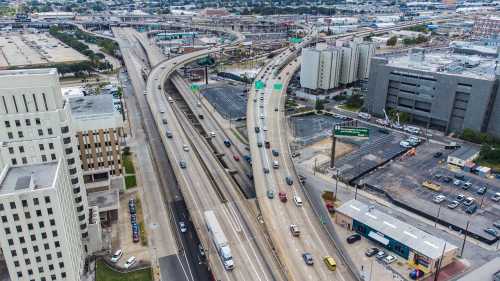
The postwar 20th century ushered in demographic changes in St. Louis through redlining, urban renewal, and suburbanization. As the population peaked at 856,000 in 1950, housing stock within the city’s fixed boundaries failed to keep pace. Racial covenants redlined downtown-adjacent neighborhoods, while major infrastructure projects such as the construction of interstates I-44, I-55, I-64, I-70 fragmented neighborhoods, facilitated suburban flight, and isolated Black and predominantly low-income neighborhoods in the north side of the city. Racial, wealth, and health disparities still spatially mirror this northern-southern divide today, with the north side of the center city experiencing greater housing insecurity, higher unemployment rates, lower incomes, and less transit access.
Contemporary St. Louis remains a nationally significant multimodal transportation and logistics hub. It is the 23rd-largest American metropolitan region by size, and the 76th-largest city. Health care, financial services, and ag-tech make up major and emerging industries alongside transportation and logistics. The car rental company Enterprise and insurance firm Centene Corporation are headquartered in St. Louis.
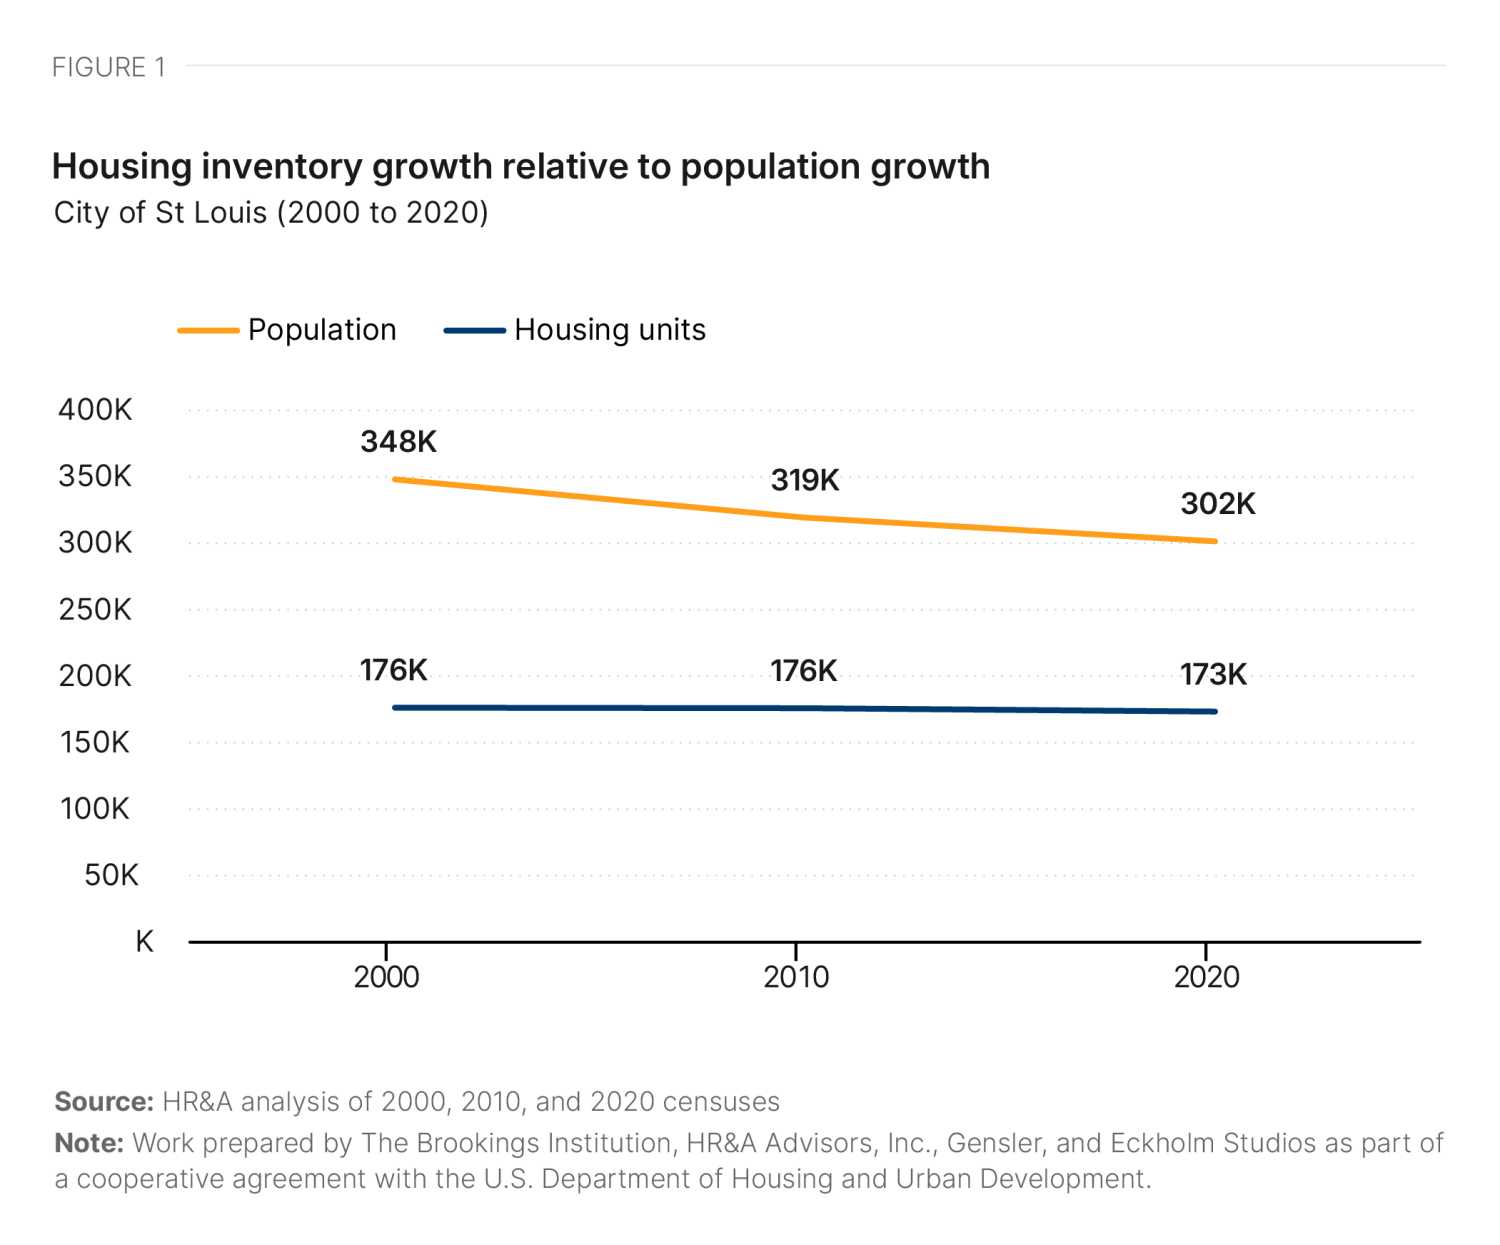
Still, the city’s population is a mere 33% of its 1950 peak. St. Louis lost more than 46,000 residents from 2000 to 2020—a 13.4% decline. The total number of housing units also declined, but at a much lower proportional rate, increasing the overall availability of housing in the city (Figure 1).
In contrast to the city as a whole, since 2000, downtown St. Louis and the immediate surrounding neighborhoods began growing again—becoming the seventh-fastest-growing city core in the U.S. between 2000 and 2018. This growth was part of a national trend, as residents of larger metro areas rediscovered the benefits of proximity. Continued residential growth is particularly critical to the fiscal future of St. Louis because the single largest share of general fund revenue for the city comes from an earnings tax, not property taxes. Nonresidents of the city can file and request refunds of withheld earnings taxes, or employers can stop withholding the taxes if workers chose telework instead of in-person work in the city.
Since the onset of the pandemic, St. Louis has not yet seen any disruption of earnings tax revenue, likely because individual employers have continued withholdings and individual employees have not sought employer verification of time worked away from the office (a prerequisite for receiving an earnings tax refund). However, another city with an earnings-tax-based fiscal model, Philadelphia, has seen declines—so a future decline in St. Louis is not outside the realm of possibility.
Downtown footprint and demand
Downtown St. Louis covers an area of 1.9 square miles, from the Mississippi riverfront to T.E. Huntley Avenue, and bounded by Dr. Martin Luther King Drive and Cole Street to the north and I-64 to the south (Figure 2). Historically a working waterfront, St. Louis’ downtown concentrated commercial uses as the city rapidly grew within its fixed boundaries through the 19th and 20th centuries. Several rounds of rebuilding characterize the city and its downtown, leaving a distinctive mark on historic architecture. The fire of 1849 destroyed 15 city blocks of the central business district and some of the city’s oldest buildings, after which new buildings used more fireproof materials, such as brick with stone or cast iron facades.
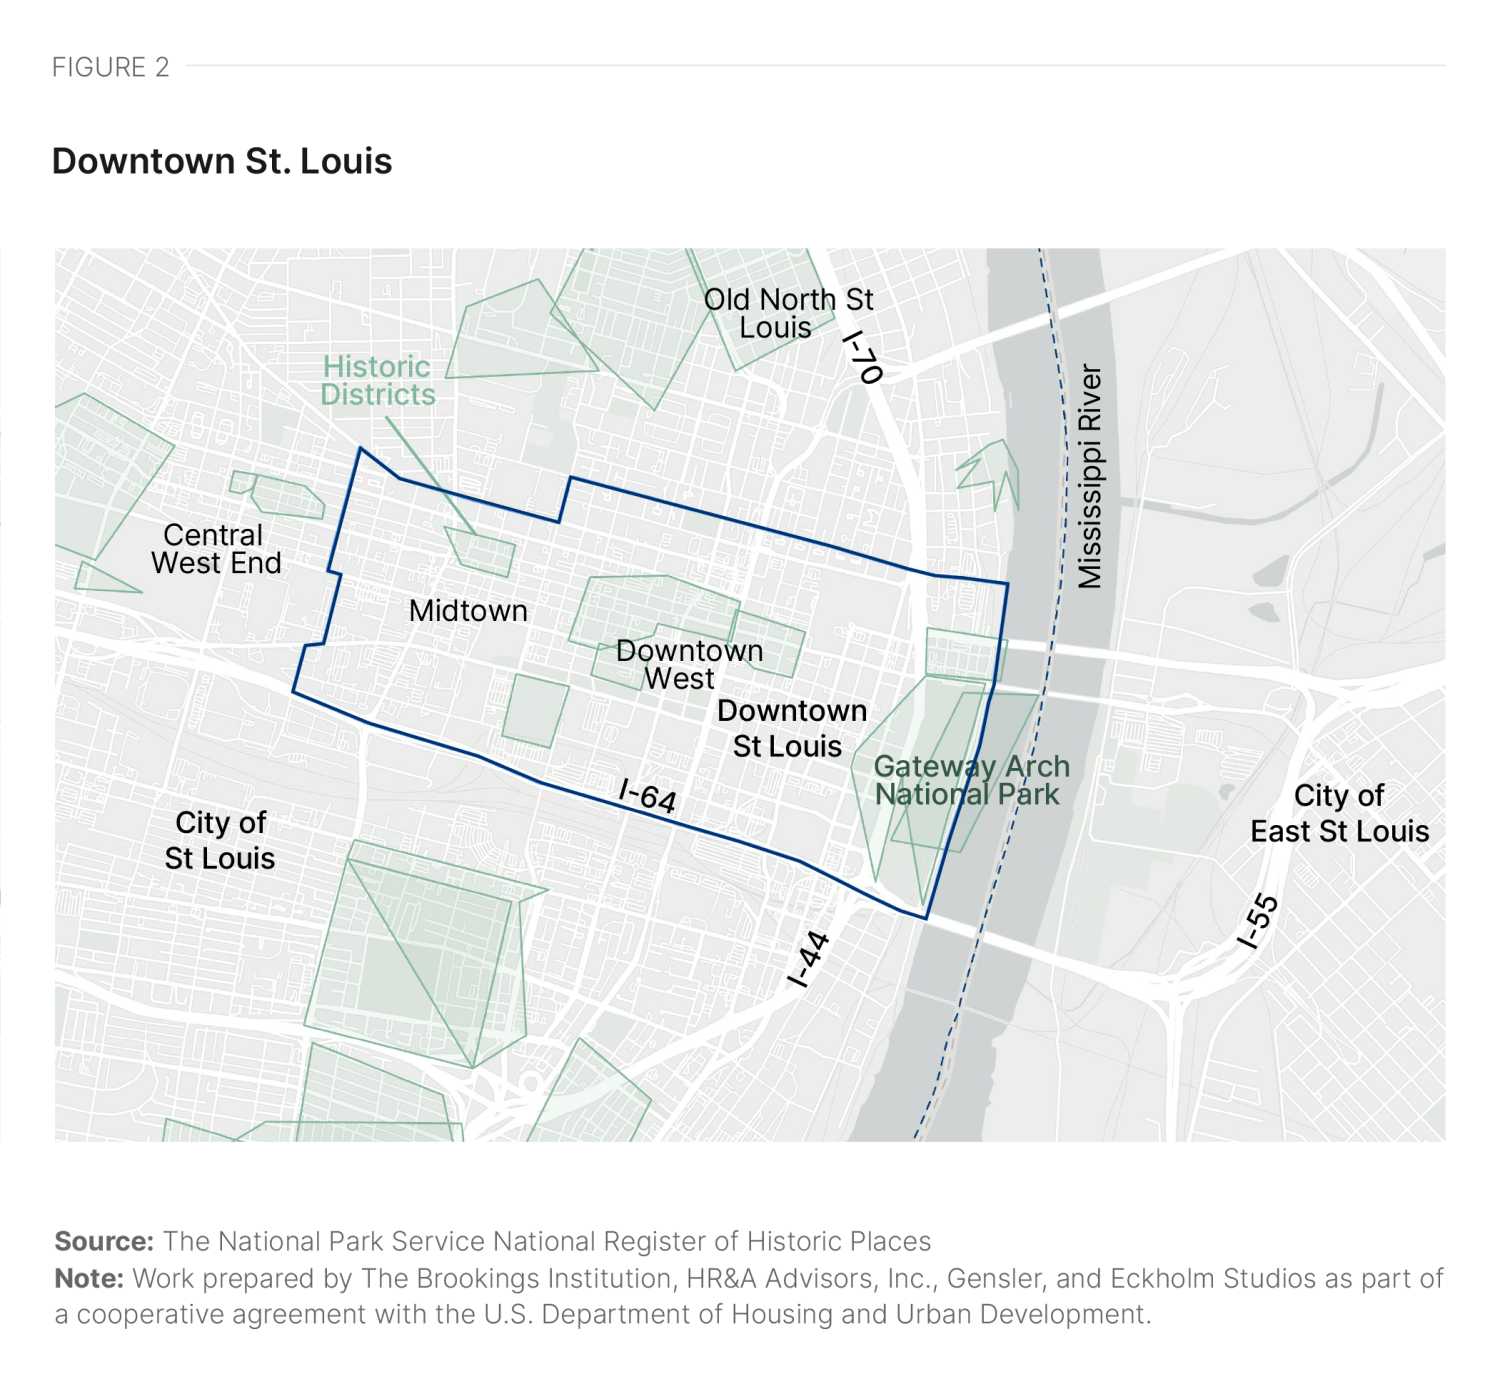
Construction of the interstate system and Gateway Arch National Park also changed the face of downtown, wiping out areas with some of the highest concentrations of historic buildings. In addition, St. Louis saw owners demolishing historic buildings to make room for parking as recently as 2004, with the teardown of the Century Building. Still, much of the building stock downtown and across the city predates the midcentury. Fifty-nine percent of buildings across the city and 53% downtown were built before 1939.1 Much of the city’s office inventory is concentrated in a high-density central business district abutting Gateway Arch National Park, and is surrounded to the west by multiple historic overlay districts listed on the National Register of Historic Places.
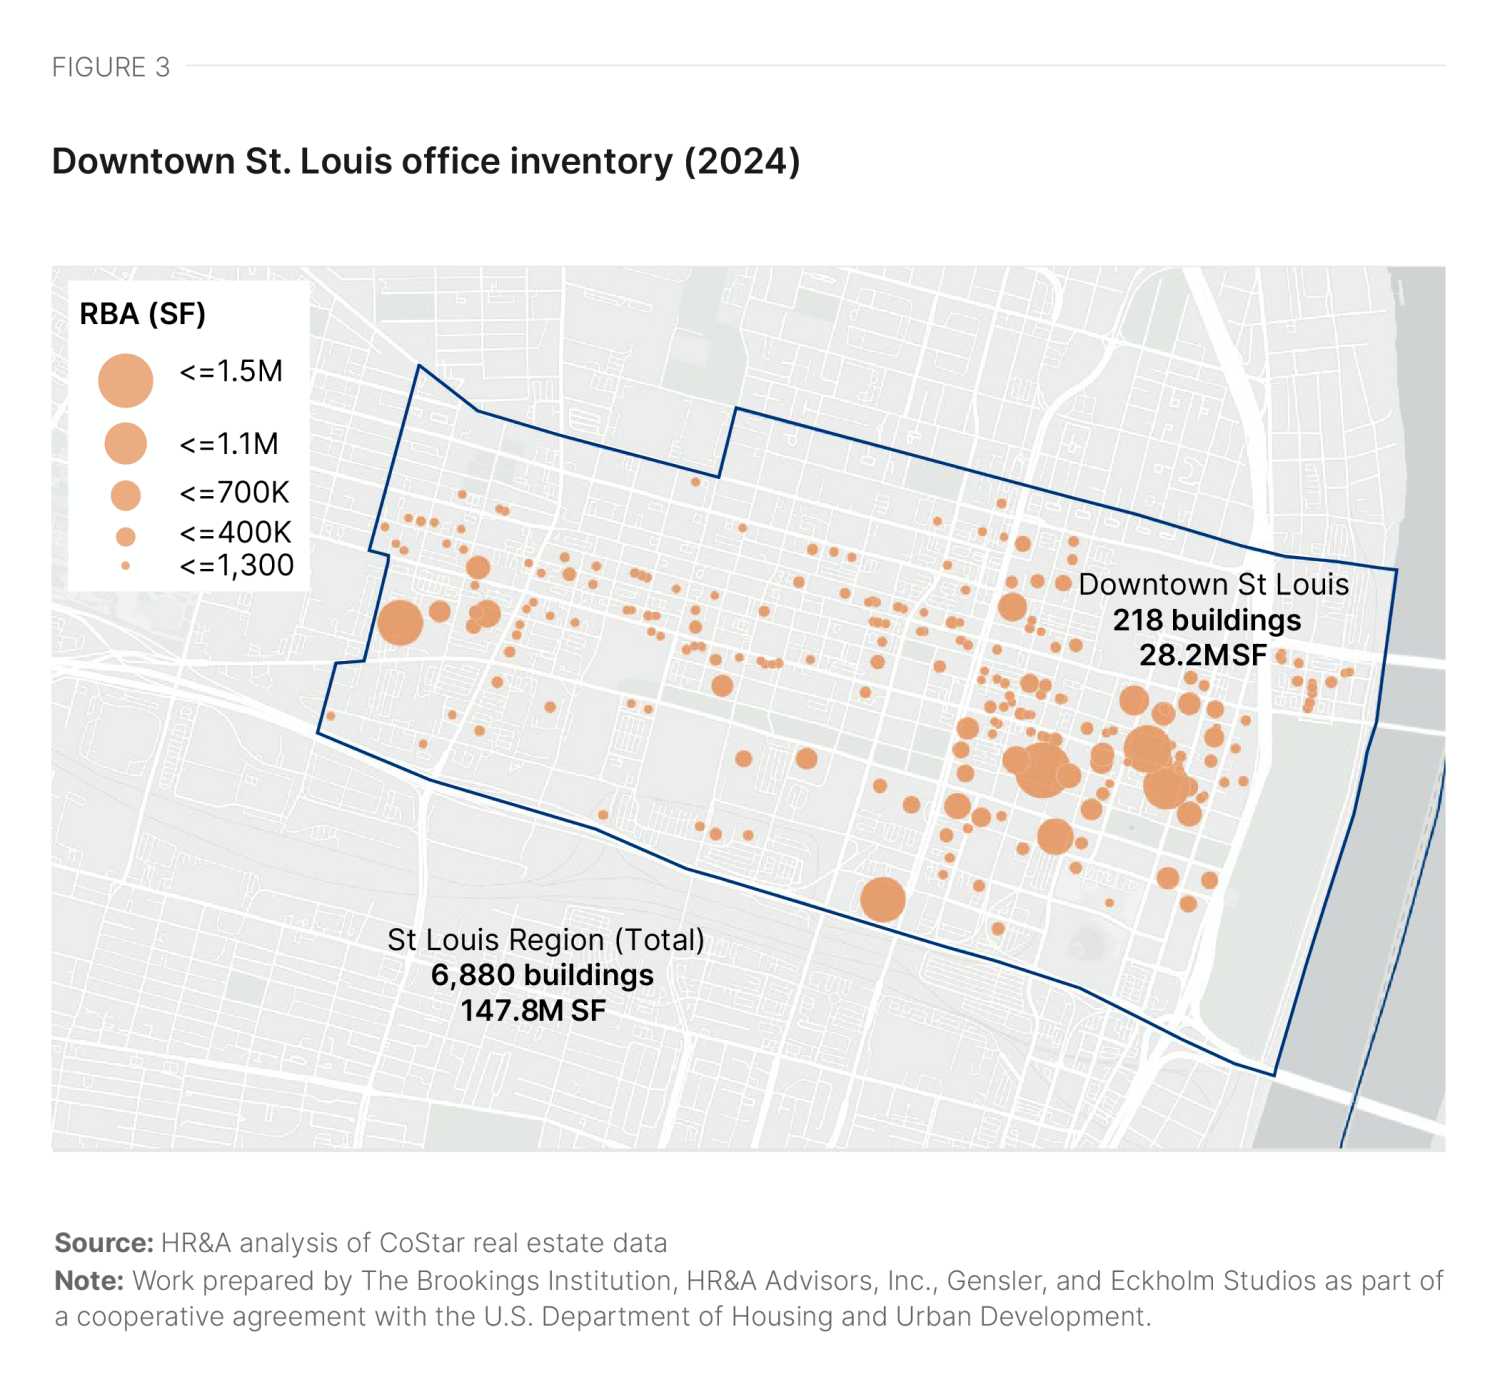
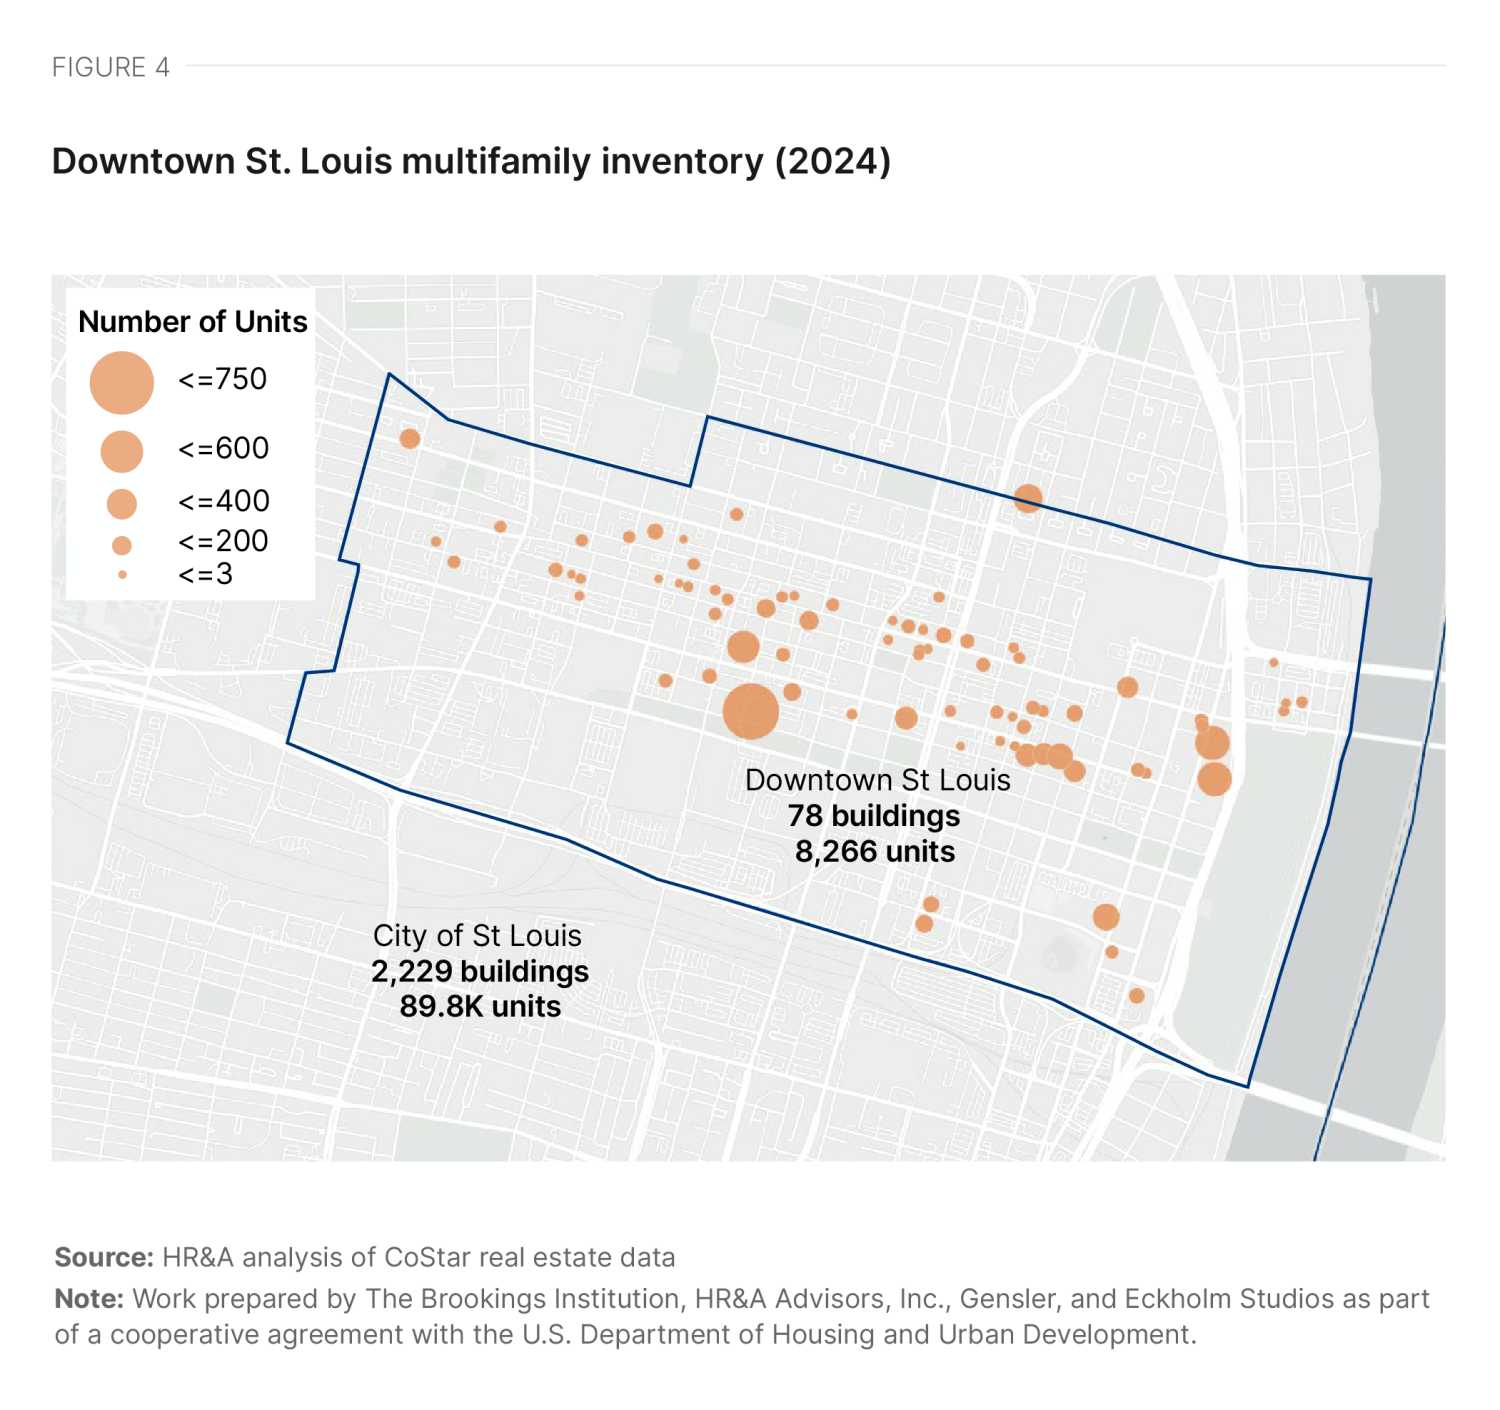
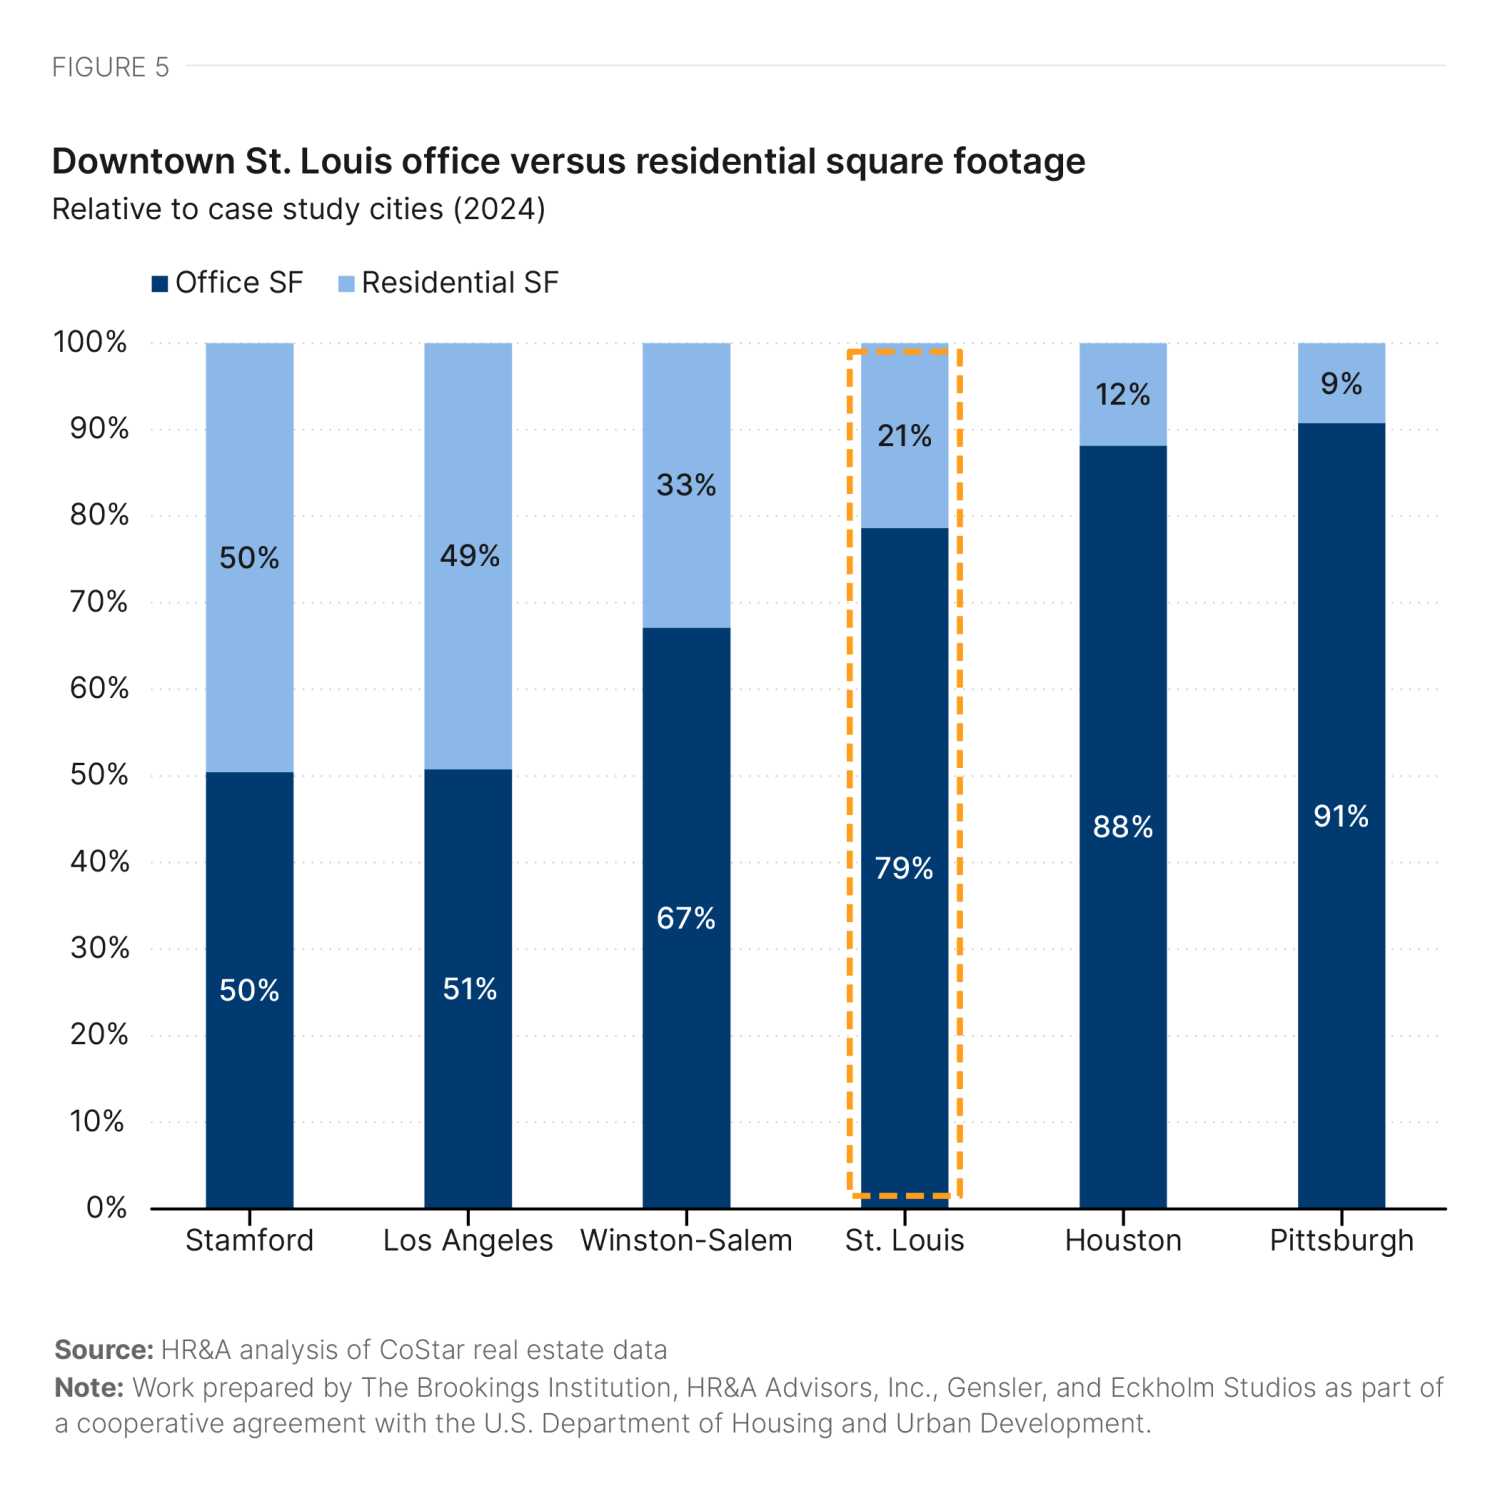
Downtown St. Louis contains a total of 218 office buildings, representing a substantial 19% of the region’s total office square footage (Figure 3). Downtown also contains 78 multifamily residential buildings, representing 9% of the city’s multifamily units (Figure 4). Office space downtown exceeds multifamily square footage by a ratio of almost 4-1. (Figure 5).
Although it is a major office center for the region, the office market in downtown St. Louis has been struggling relative to the St. Louis metropolitan statistical area since before the pandemic. Following the complete vacancy of AT&T Tower in 2017, there have only been two small office deliveries, totaling 129,000 square feet.2 The stagnating market and presence of several high-vacancy office buildings make residential conversions an appealing option to reposition the market to support its other office properties.
While the downtown residential market has also faced absorption challenges, it has continued to grow, adding more than 1,000 units across eight new buildings since 2019. In addition, 400 new units across five projects are in the pipeline.3
Office market conditions
The office market in downtown St. Louis has suffered from major vacancies over the last decade. Since the pandemic, multifamily vacancy in the downtown has also spiked. Some have described downtown as suffering from an “urban doom loop”—but one that can potentially be addressed by repurposing a few key downtown assets that impact overall perception of downtown vitality and safety.
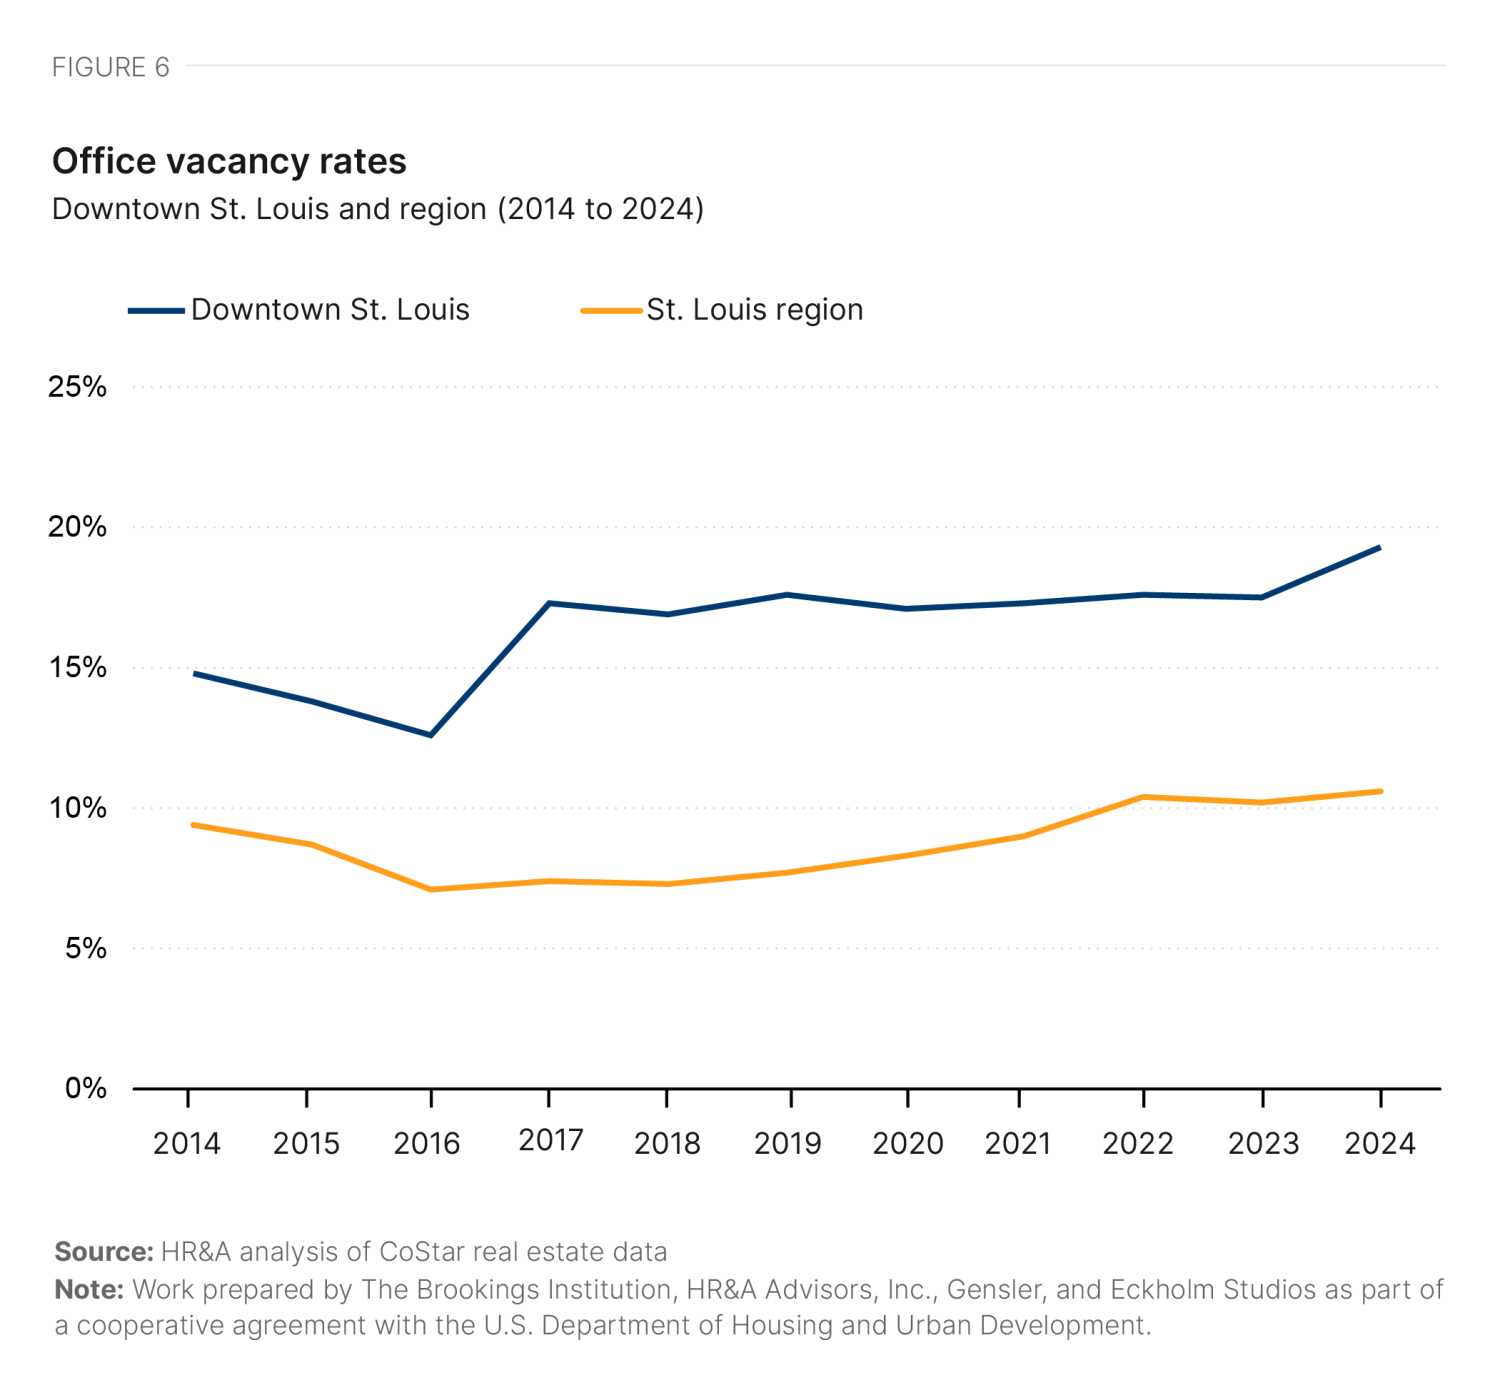
St. Louis’ office market metrics have been substantially influenced by two completely vacant buildings: the Railway Exchange Building (vacated 2014) and AT&T Tower (vacated 2017). Together, these buildings contain almost 2.7 million square feet of space—nearly half of all vacant office space in downtown St. Louis.4 Following the complete vacancy of AT&T Tower, downtown office vacancy rose from 13% in 2016 to 17% in 2017. It has continued to gradually increase (Figure 6), reaching the 19% national average office vacancy rate by the close of 2024.
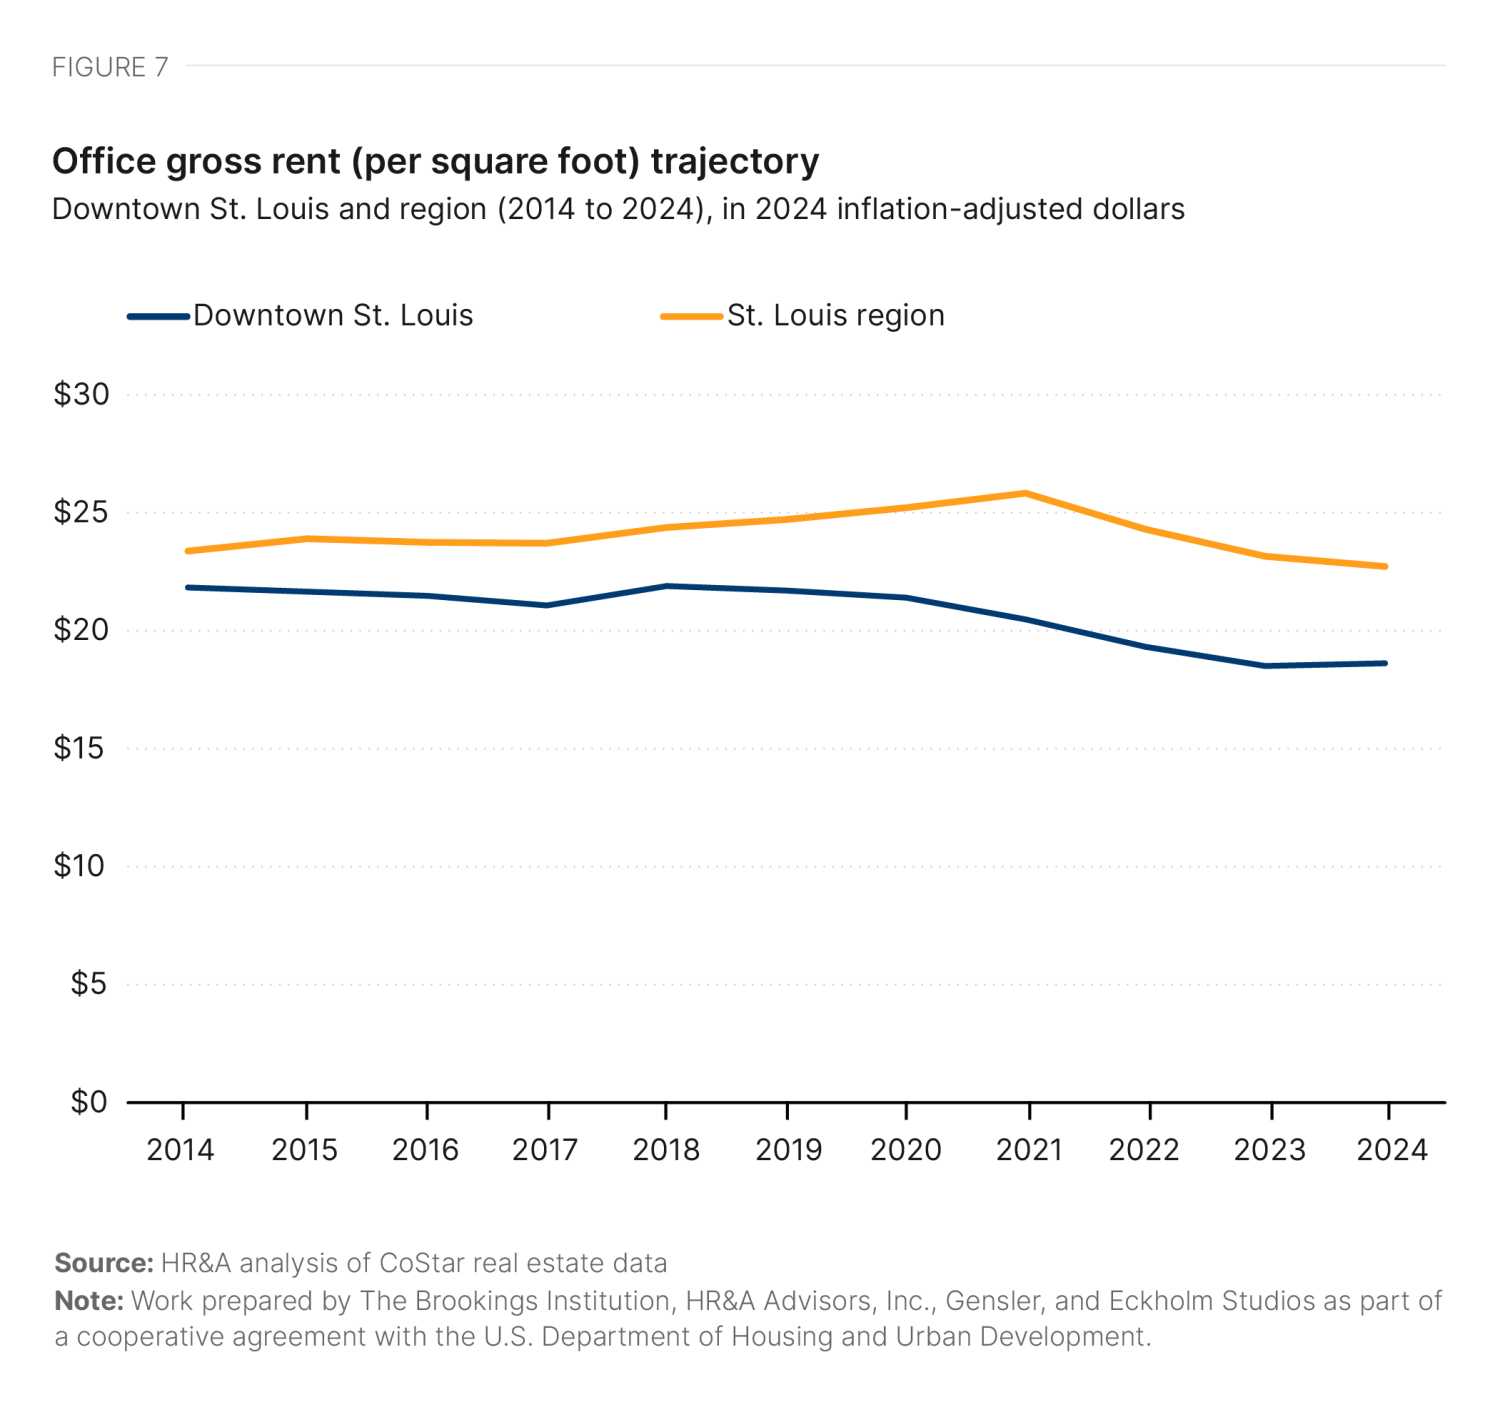
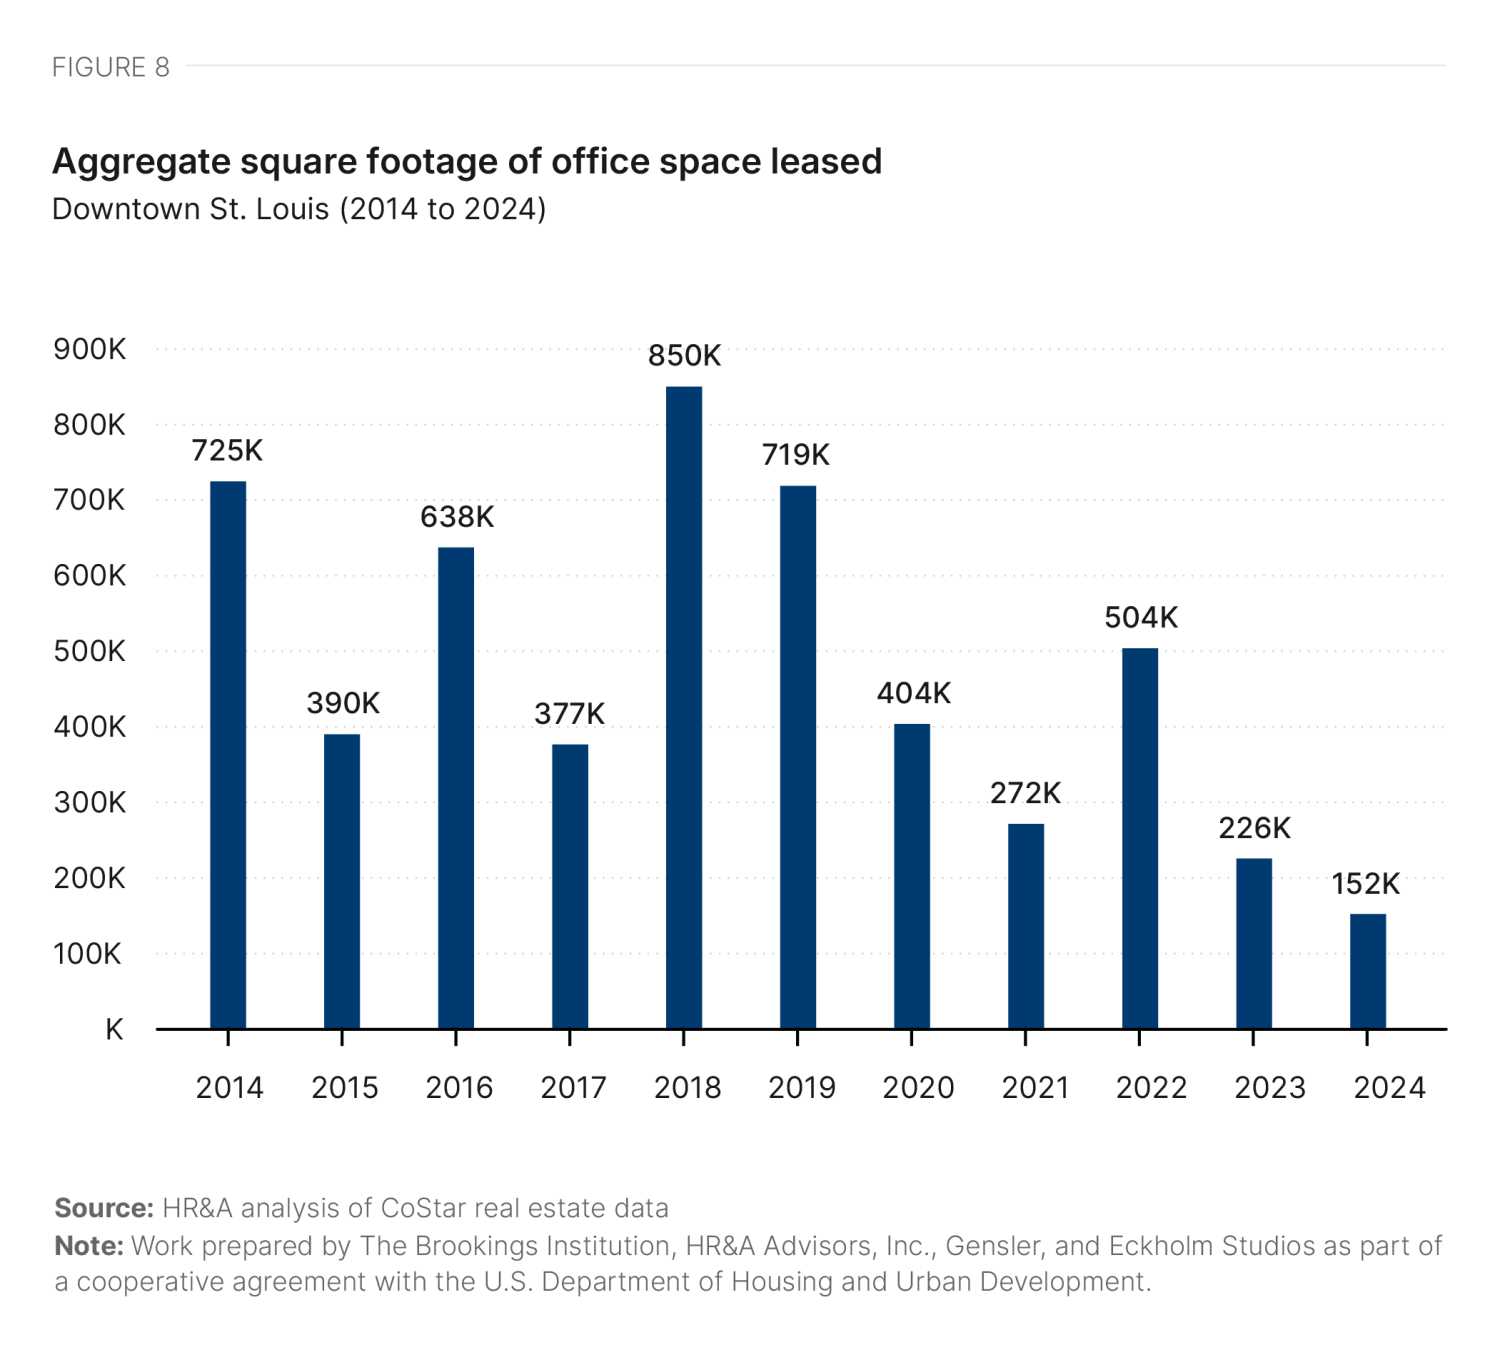
Unlike most downtowns, the average office rent in downtown St. Louis is lower than the regional average, with the gap widening since the pandemic due to downtown’s minimal rent growth. In 2024 inflation-adjusted terms, this has translated to a 14% decline in average downtown office rents since 2019 (Figure 7). Annual average leasing activity has decreased by almost half since the pandemic, declining from an average 616,000 square feet per year from 2014 to 2019 to only 334,000 square feet per year from 2021 to 2023 (Figure 8). This has made it challenging to fill existing vacancies, particularly in highly vacant properties.
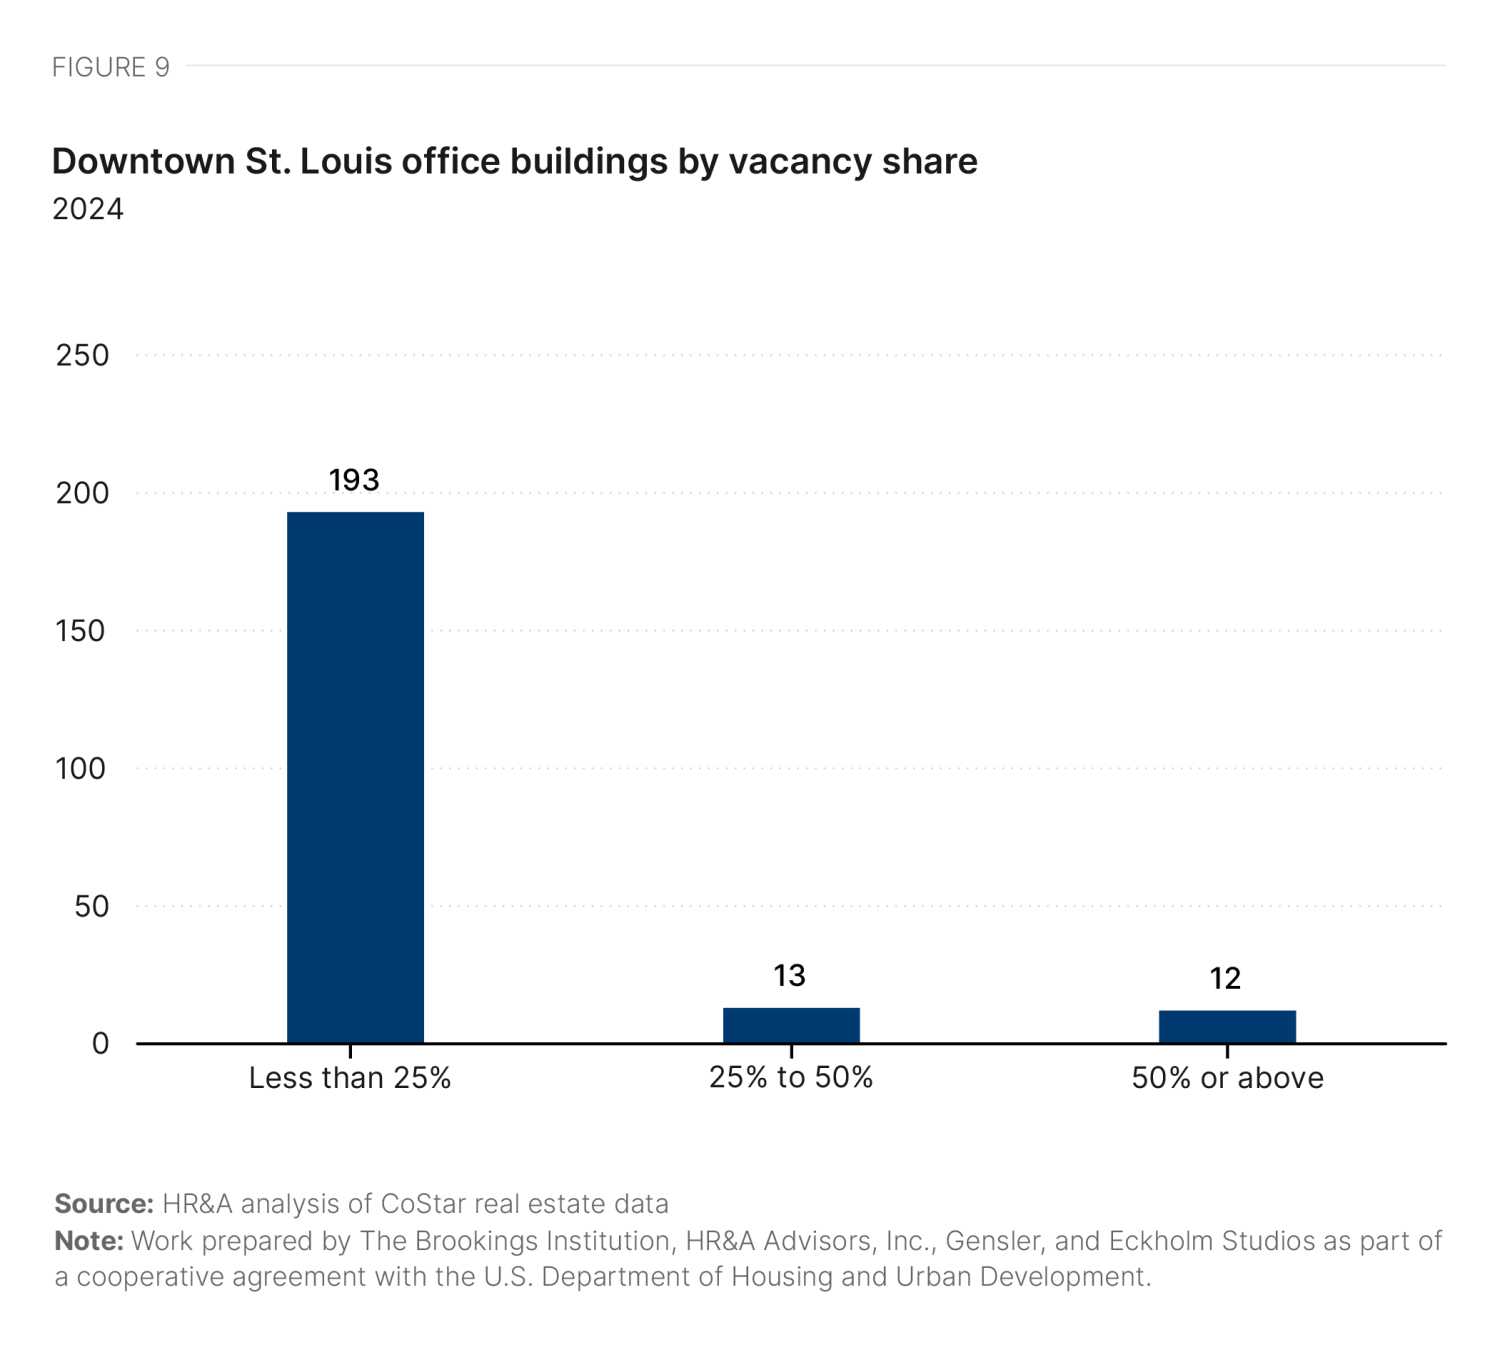
In total, 25 office buildings in downtown St. Louis are more than 25% vacant (Figure 9). Including the fully vacant Railway Exchange Building and AT&T Tower, 10 buildings account for 76% of all downtown vacancy. These buildings are all located within a quarter-mile radius in the central business district, and many are within a block of each other.5
Media headlines depict downtown—particularly the central business district—as experiencing an urban doom loop characterized by crime, vacancies, condemnation of historic buildings, and economic decline. However, just under 30% of daytime workers in the city are employed within the downtown corridor, and in 2023, foot traffic was estimated to be at 95% of pre-pandemic 2019 numbers (Table 11).6
These challenges, both real and perceived, make business attraction and retention difficult. Spurred by the pandemic, downtown lost over 500 businesses between 2019 and October 2022. Seeking Class A office spaces, a number of companies have relocated to nearby suburbs such as Clayton.
Residential market conditions
In a similar vein, the residential market has suffered net negative unit absorption over the past five years, while suburbs and downtown-adjacent areas have seen a rise in market activity.
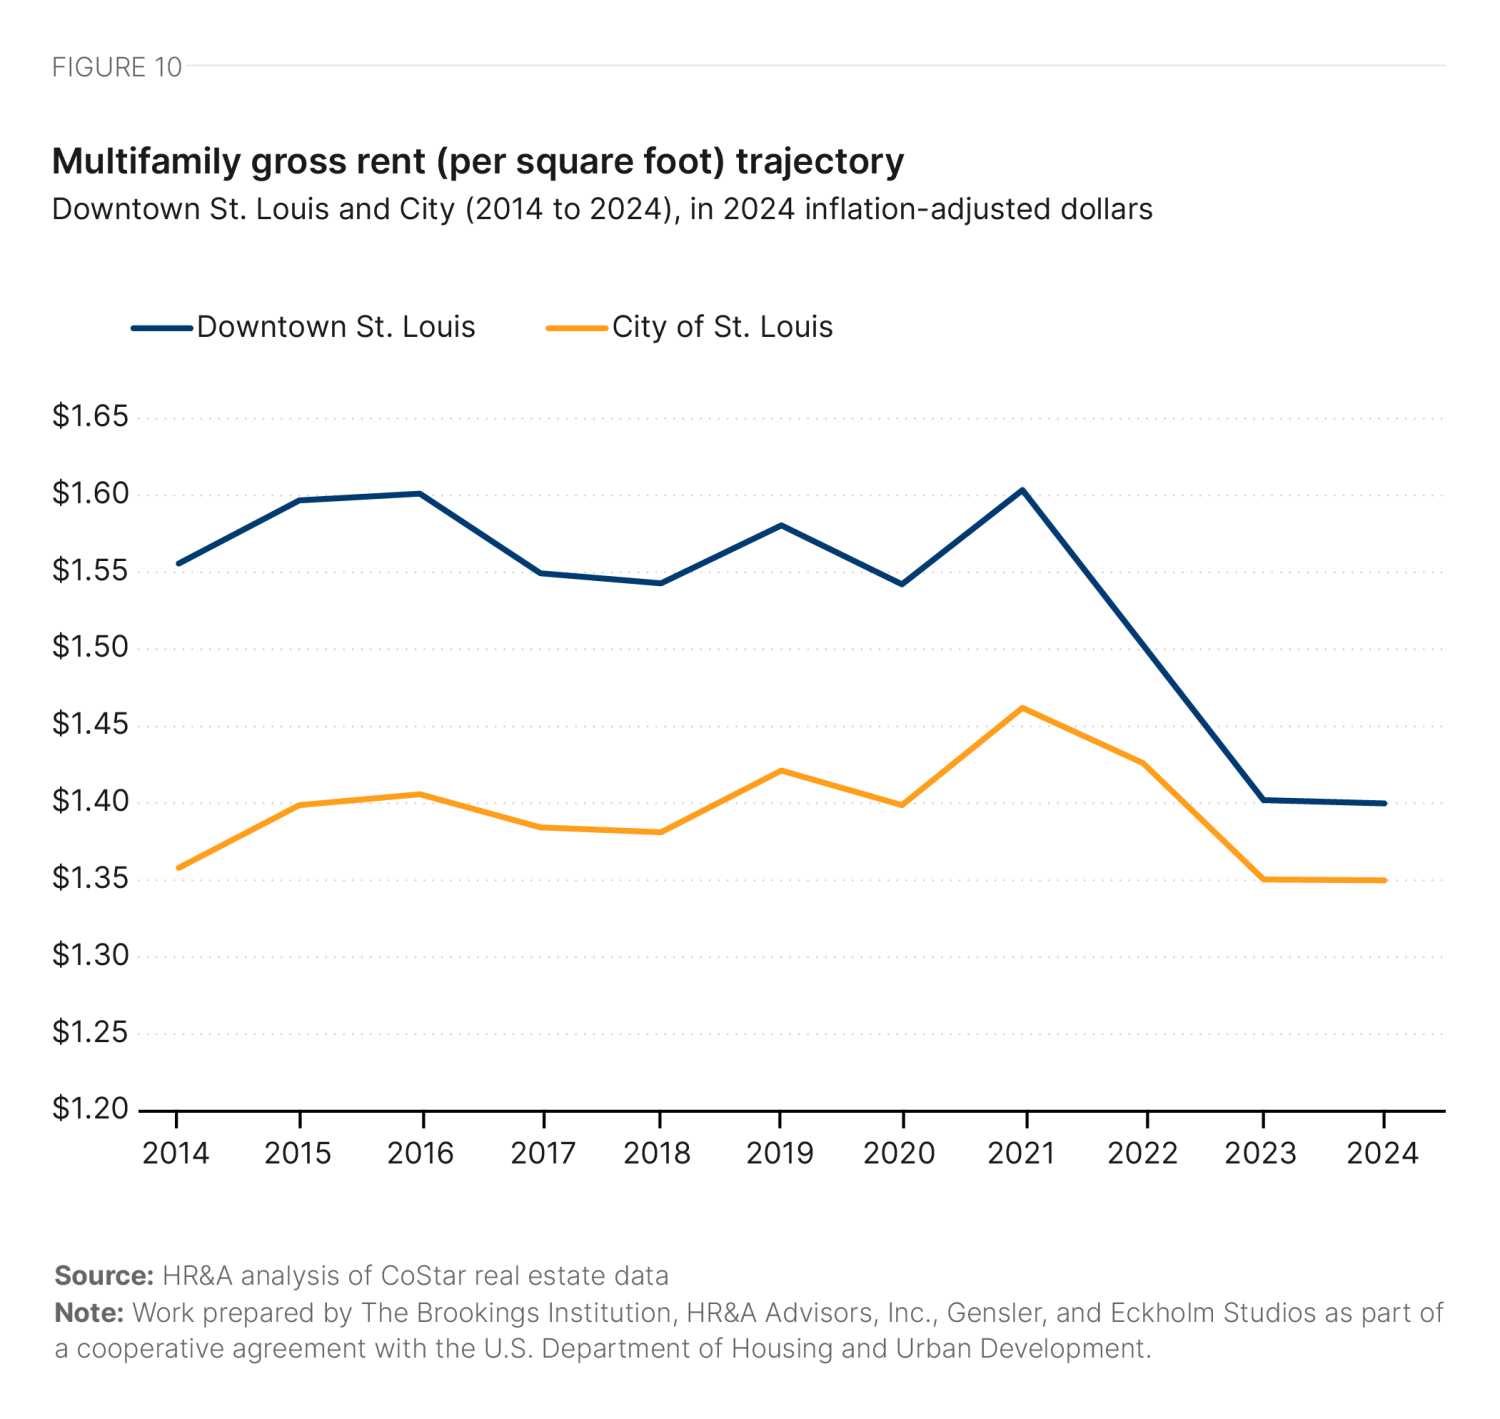
Rents in downtown St. Louis have grown at a consistent rate slightly above inflation for most of the past decade. However, higher inflation during the pandemic caused the inflation-adjusted value of rent to decrease by 9% between 2020 and 2024 (Figure 10). Citywide rents grew faster than downtown rents over the entire decade, decreasing the rent premium for a downtown multifamily unit from 15% in 2014 to just 4% in 2024.7 The multifamily inventory in downtown St. Louis has a high proportion of deeply affordable units, with 44% affordable to households earning 50% of St. Louis’ area median income (AMI) (Figure 11, Table 1).8


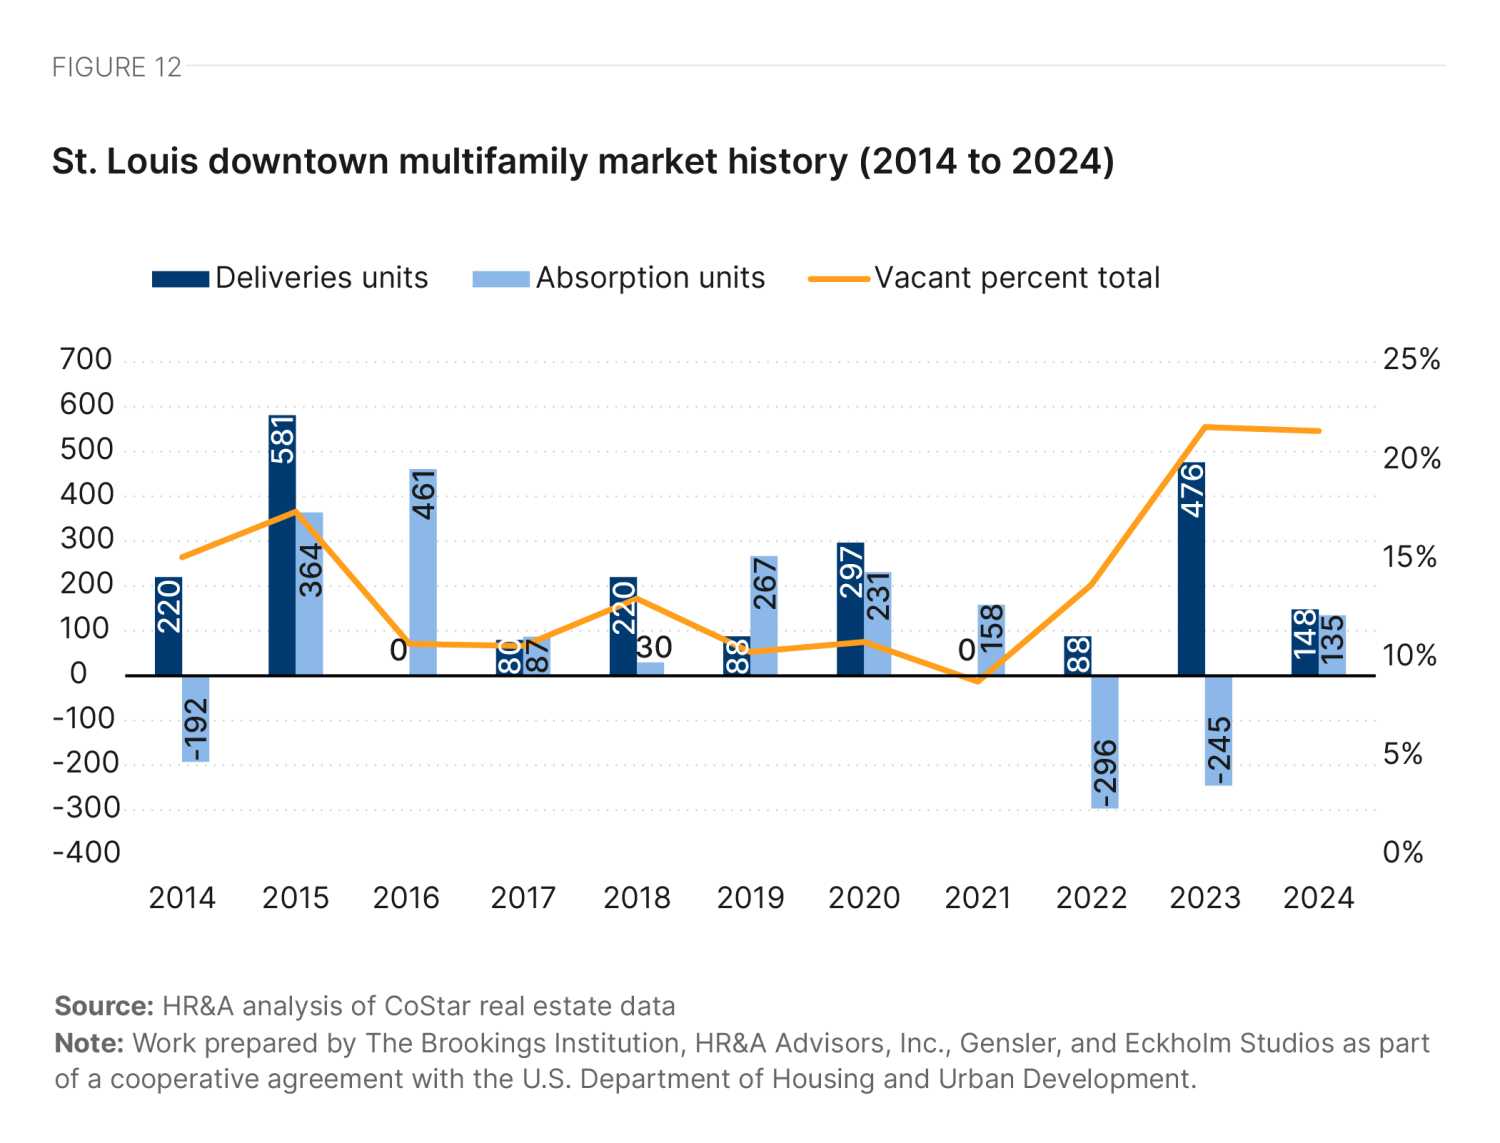
From 2014 to 2021, demand mostly kept pace with deliveries, leading to a general decrease in the vacancy rate from 15% to 9%. However, high negative absorption in 2022 and 2023—coupled with multiple new deliveries—has increased the downtown vacancy rate to 22% (Figure 12). Despite the struggling multifamily rental market in recent years, the downtown residential population nearly doubled between 2010 and 2020, consisting primarily of working-age professionals.
Downtown residents are just under half white, 38% Black, and 14% other people of color. These are comparable ratios to the city as a whole, but distinct from the state, where the population is 79% white and 11% Black (Table 2). Household wealth concentrates outside the city, with citywide median family income situated at $52,941, compared to $221,200 across the state as a whole.9 In the city, almost 32% of households are considered housing cost burdened (in that they spend more than 30% of their monthly income on direct housing costs), and approximately 20% of people within housing units have an income below the federal poverty level (Table 2).10
|
Submarket |
Citywide |
Statewide |
|||
|---|---|---|---|---|---|
|
Total population |
|||||
|
White alone population share |
48.6% |
46.3% |
79.4% |
||
|
Black alone population share |
37.9% |
43.9% |
11.3% |
||
|
Other Share (anything other than White or Black alone) |
13.6% |
9.9% |
9.4% |
||
|
Hispanic population share |
4.9% |
4.3% |
4.6% |
||
|
Population in housing units |
|||||
|
Poverty rate |
18.6% |
19.8% |
12.6% |
||
Source: Brookings analysis of ACS 2022 5-year estimates
Note: Poverty rate used here is defined as the share of people in housing units. Work prepared by The Brookings Institution, HR&A Advisors, Inc., Gensler, and Eckholm Studios as part of a cooperative agreement with the U.S. Department of Housing and Urban Development.
Political, policy, and financial conditions
St. Louis is governed by the Board of Aldermen, a legislative body made up of 14 elected members from each of the city’s wards and a president responsible for creating, passing, and amending local laws as well as annually approving the city’s budget. The city’s chief executive is the mayor. Notably, the city of St. Louis is independent from St. Louis County, which means that, among other powers and responsibilities, revenue collection (and thus economic development strategies), road maintenance, and the court system are separate between the jurisdictions, which can be a source of conflict, inefficiency, or inequity.
Within the city, several independent nonprofit entities also collaborate on economic development. The St. Louis Development Corporation (SLDC), while incorporated as an independent nonprofit, has many formal ties to the city. The mayor appoints its leadership, and its board consists of two alderpeople and other city appointees leading the city’s various development boards. The business community supports Greater St. Louis, Inc., another major player in revitalization and growth. Downtown St. Louis is also served by a community improvement district and the Gateway Arch Park Foundation, a very well-capitalized nonprofit organization with approximately $100 million in assets and a mission to steward the Gateway Arch and surrounding public spaces.
Unlike most major cities, St. Louis’ planning and zoning departments are housed separately. Located under the building division, the Zoning Section administers and enforces the city’s Zoning Code Ordinance by reviewing building and occupancy permits and processing rezonings and zoning overlay districts. The Zoning Section also oversees Conditional Use Hearings and the Board of Adjustment. In terms of the regulatory process, petitioners may go to three boards depending on whether a permit, conditional use, or rezoning is required. The Board of Adjustment and Planning Commission—which oversees zoning adjustments, ordinances, and petitions—are appointed by the mayor and confirmed by the Board of Aldermen, and are generally favorable to adaptive reuse.
Downtown St. Louis is home to a cluster of very large and highly distressed office buildings and associated assets (such as parking structures), which will require extraordinary financial interventions in order to return to productive use. The city and state have created a policy environment that is generally favorable to conversion, and have deployed a standard range of fiscal measures—including tax abatements and credits—to bring down the cost of converting individual buildings, which has been effective for the conversion of smaller properties. Now, the state is considering deploying larger tools—such as tax increment financing and tax-exempt revenue bonds—to handle highly challenged assets such as the Railway Exchange Building. To get there, there is a need for political alignment around the value of investing in downtown, relative to adjacent neighborhoods in the broader St. Louis metropolitan statistical area.
Watchers of downtown St. Louis—such as Greater St. Louis. Inc. and SLDC—are all aligned on the need to devote substantial public resources toward promoting office-to-residential conversion to deal with challenged vacant assets that have damaged perceptions of downtown safety. Top motivations cited for conversion include:
- Eliminating blight caused by the reduced size of the city and region from historic levels, and thus reduced demand for residential and commercial space downtown.
- Placemaking downtown.
- The preservation of the exteriors of iconic historic assets.
However, at the city and county level, there is some controversy over the level of public resources that should be invested in downtown relative to other neighborhoods. When the NFL team that had been located in St. Louis relocated to Los Angeles (the Rams), the city, county, and regional sports authority filed a lawsuit against the team for breach of contract, among other claims. The suit was settled in 2021, and in 2022, the city of St. Louis received $280 million as part of the settlement. As part of deciding what to do with these resources, the city ran an ideas contest in which residents could comment and vote on possibilities. Two of the six shortlisted ideas involved investing in downtown. However, as the mayor and Board of Aldermen now consider how much money to allocate to which idea, there is no cross-sector consensus on what amount is right for downtown.
Since the onset of the pandemic, the state, city, and their affiliated nonprofit entities have attempted or made a number of policy changes to promote the revitalization of downtown.
For example, the state has streamlined its historic preservation tax credit application process, which is helpful for all forms of historic preservation, including office-to-residential conversions. Further, in 2024, Greater St. Louis, Inc. helped introduce to the state legislature SB 792/HB 1935, the Revitalizing Missouri Downtowns and Main Streets Act, which, in addition to supporting small Main Street projects, bolsters incentives for office conversions downtown. The bill proposes to allow 25% tax credits for conversions of nonresidential real estate property from office use to residential, retail, or other commercial use. The program would have a $50 million cap for building conversions over $750,000, with the opportunity to combine with the state historic preservation tax credit program. Tax credits would be able to be carried back three years and forward 10 years. The bill did not pass in the most recent legislative session due to political polarization that was unrelated to the bill itself. However, Greater St. Louis, Inc. will likely reintroduce the bill in the next legislative session, and has built a meaningful coalition of statewide support.
At the city level, in 2024, St. Louis initiated a comprehensive overhaul of its zoning code and strategic land use plan using reallocated American Rescue Plan Act funds. The city adopted the zoning code and land use plan in the 1950s and 2005, respectively, and the overhaul aims to rezone downtown and facilitate new development. The zoning rewrite plans to permit housing by-right and reduce parking requirements by rezoning parts of downtown and the fashion district from industrial use to a central business district.
Lastly, transit-oriented development is a timely policy priority the city is pursuing through zoning. Led by Bi-State Development, the MetroLink Green Line 5.8-mile expansion will extend the Jefferson Avenue alignment station northwest, connecting historically underinvested neighborhoods to downtown. In August 2024, the mayor signed Board Bill 13, which amended the zoning code to allow for additional density and reduced parking requirements for properties within a half-mile of a transit station. Specifically, the text amendment reduces minimum lot sizes by 40% and parking requirements by 25%, and increases height maximums from three to four floors—changes that could reduce upfront costs and maximize return on investment for developers.
The state, city, and their affiliated nonprofit entities have deployed a wide range of financial mechanisms to bring down the cost of conversion in recent years:
- SLDC—which administers local development incentive programs—decides the size and term of incentive offerings on a building-by-building basis using an Inclusive Growth Incentives Scorecard. Tools it commonly deploys include:
- Property tax abatements, which partially freeze the tax assessment of properties undergoing renovation or new construction at predevelopment levels for five to 10 years. SLDC estimates that tax abatements resulted in the creation of 4,200 new residential units between 2017 and 2022. Projects typically received 80% to 90% in abatements over 10 years, depending on their structure and benefit to the community.
- Property tax exemption and reduced or zero state and local sales taxes on construction materials purchased to make improvements.
- The Missouri Department of Economic Development has a Historic Preservation Tax Credit Program (HTC) that is notably generous relative to other states. The credit can be up to 25% of total qualified rehabilitation costs, and can carry back as far as three years and forward up to 10 years. This credit can also apply to income, bank, insurance premium, and other financial institution taxes, and is stackable with the federal historic preservation tax credit.
While SLDC has also utilized tax increment financing and tax-exempt revenue bonds in the past, neither has been in common use in recent years. They are now being discussed as tools to revitalize highly challenged office assets.
To drive value downtown, Greater St. Louis, Inc. offers retail incentive programs. It is also working to combat the downtown doom loop through improvements to public space, business rent guarantees, and improvement grants—particularly along the central commercial corridor of Washington Boulevard, which has many vacancies—as a part of an overarching downtown revitalization plan, Design Downtown STL.
An overview of all the main state and local tools available to support conversion in St. Louis is shown in Table 3.
|
Type |
Name |
Details |
|
|---|---|---|---|
|
Grant |
|||
|
Guaranteed landlord rent for businesses within, moving to, or expanding within downtown. |
|||
|
Tax abatement |
|||
|
Freeze of tax assessments at up to 100%. |
|||
|
Property tax exemption and reduced or zero state and local sales taxes on construction materials purchased to make improvements. |
|||
|
Loan |
|||
|
SLDC tax increment financing |
Tax revenues from construction or rehab of multifamily residential, infrastructure, or community-use projects fund public benefit projects. |
||
|
SLDC tax-exempt revenue bonds |
Tax-exempt revenue bonds are a financing method for major projects, providing long-term capital over a 20-to-30-year amortization period. |
||
|
Tax credit |
|||
|
The statewide annual cap is over $100 million. |
|||
Note: Work prepared by The Brookings Institution, HR&A Advisors, Inc., Gensler, and Eckholm Studios as part of a cooperative agreement with the U.S. Department of Housing and Urban Development.
Past and future conversion activity
In this political, policy, and economic environment, at least five office-to-residential conversion projects have been completed since March 15, 2020, and at least three more are in the planning process (Figure 13).11

The Victor
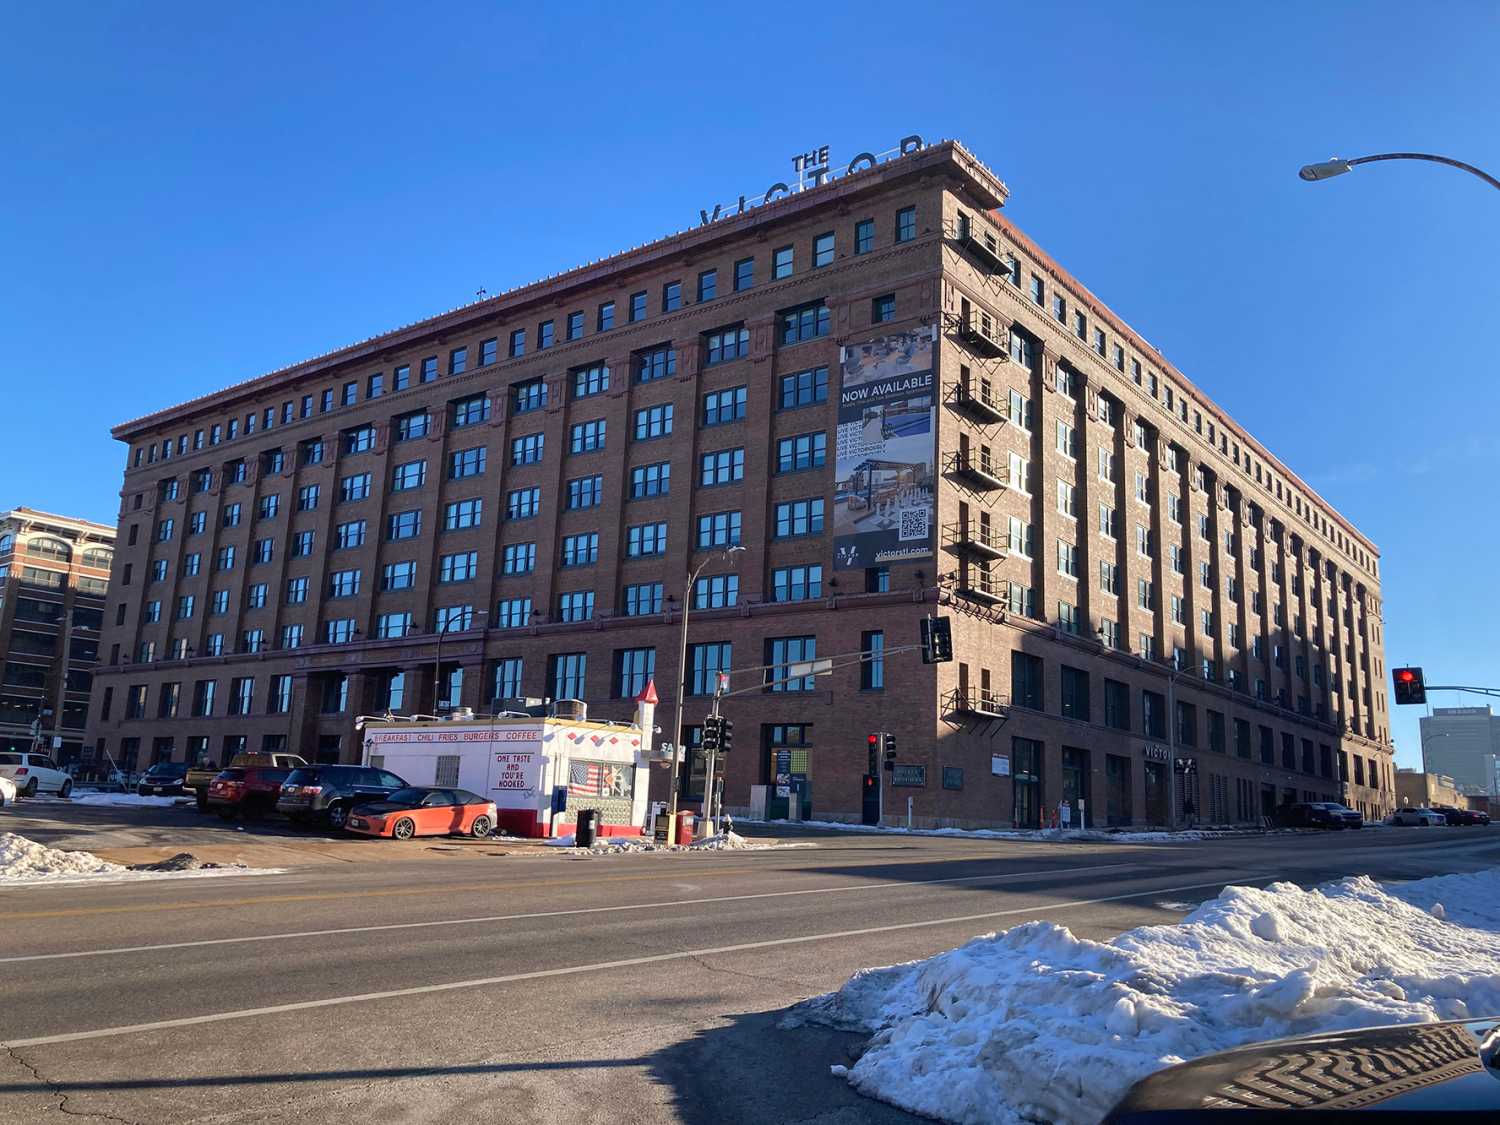
The Victor | Photo credit: Gensler
The Victor was formerly home to a warehouse for Butler Brothers, a mail-order catalog wholesaler that used the space to hold inventory and host a showroom on the ground floor. The building—which spans a full city block—sat vacant for 20 years before it was acquired during the pandemic. It changed hands twice before it was ultimately converted into 348 units by Development Services Group, a developer that specializes in adaptive reuse.
|
Name |
The Victor |
|---|---|
|
Address |
1717 Olive St. |
|
Owner |
Development Services Group |
|
Gross square feet |
735,000 |
|
Building history |
Former retail and warehouse |
|
Year built |
1906 |
|
Year converted |
2023 |
|
Number of converted floors |
8 |
|
Average floor plate size |
18,846 |
|
Number of units |
384 |
|
Unit mix by type |
18 x BA , 248 x 1BR ,118 x 2BR |
|
Average rent |
$2,647 |
|
Average rent per square foot |
$2.64 |
|
Affordability |
20% workforce housing |
|
Acquisition price |
N/A |
Source: Authors’ analysis of CoStar real estate market data and interviews with local stakeholders
Note: Work prepared by The Brookings Institution, HR&A Advisors, Inc., Gensler, and Eckholm Studios as part of a cooperative agreement with the U.S. Department of Housing and Urban Development.
The conversion was financed with the following capital stack:
|
Financing type |
|---|
|
Traditional financing |
|
Developer equity |
|
Senior construction loan |
|
City |
|
St. Louis Development Corporation real estate tax abatement |
|
State |
|
State historic preservation tax credit |
|
Federal |
|
Federal historic preservation tax credit |
Source: Authors’ interviews with local stakeholders
Note: Work prepared by The Brookings Institution, HR&A Advisors, Inc., Gensler, and Eckholm Studios as part of a cooperative agreement with the U.S. Department of Housing and Urban Development.
The Marquette
The Marquette building was the headquarters for Boatmen’s Bank from its construction in 1913 through the 1980s, when the bank vacated the building. The building then served as home for the downtown St. Louis branch of the YMCA. After a failed attempt to develop the building in 2006, the developer gifted the building to the YMCA, which then approached New + Found to assist with redevelopment. New + Found converted the building to residential use and renovated the YMCA space during the conversion process. As of November 2024, the building is now being marketed as the St. Louis Premier Lofts.
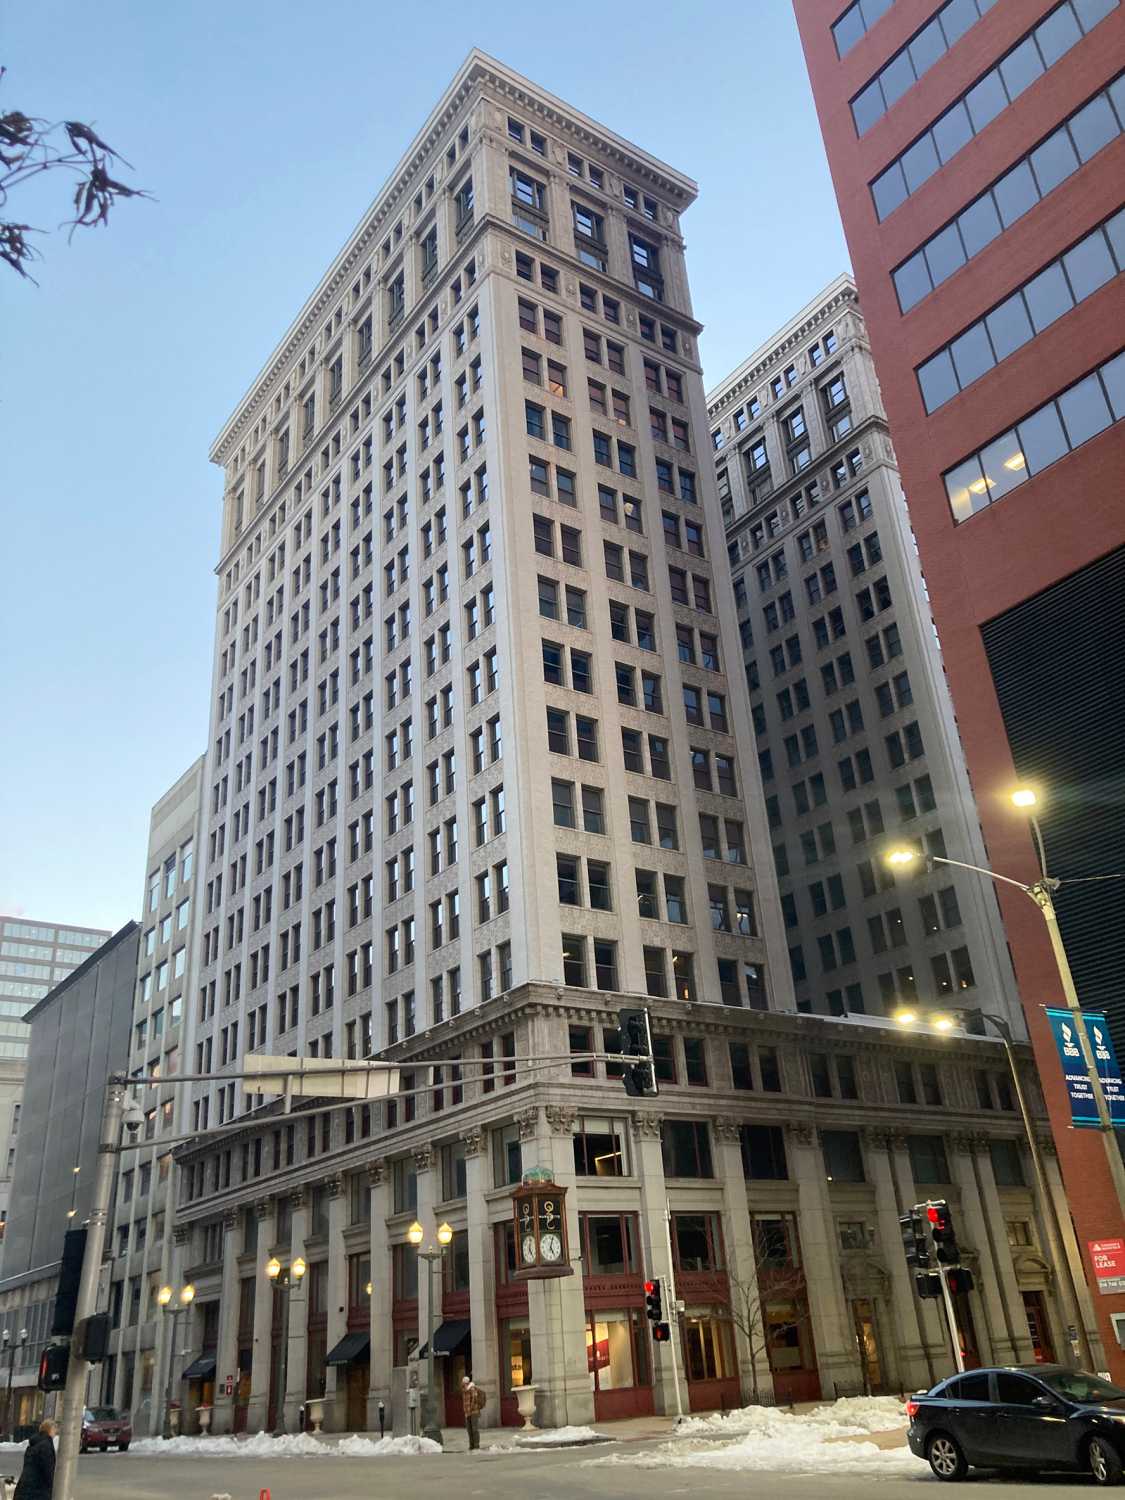
The Marquette | Photo credit: Gensler
|
Name |
The Marquette |
|
Address |
300-314 N. Broadway |
|
Owner |
TLG Marquette |
|
Gross square feet |
227,000 |
|
Building history |
Former office: Boatmen's Bank HQ, YMCA |
|
Year built |
1913 |
|
Year converted |
2006 |
|
Number of converted floors |
18 |
|
Average floor plate size |
11,000 |
|
Number of units |
119 |
|
Unit mix by type |
83 X Studio, 21 X 1BR, 5 X 2BR |
|
Average sales price |
$155,000 to $239,000 |
|
Average sales price per square foot |
$160 |
|
Affordability |
N/A |
|
Acquisition price |
N/A |
Source: Authors’ analysis of CoStar real estate market data and interviews with local stakeholders
Note: Work prepared by The Brookings Institution, HR&A Advisors, Inc., Gensler, and Eckholm Studios as part of a cooperative agreement with the U.S. Department of Housing and Urban Development.
The conversion was financed with the following capital stack:
|
Financing type |
|---|
|
Traditional financing |
|
Developer equity |
|
Senior construction loan |
|
City |
|
St. Louis Development Corporation real estate tax abatement |
|
State |
|
State historic preservation tax credit |
|
Federal |
|
Federal historic preservation tax credit |
Source: Authors’ interviews with local stakeholders
Note: Work prepared by The Brookings Institution, HR&A Advisors, Inc., Gensler, and Eckholm Studios as part of a cooperative agreement with the U.S. Department of Housing and Urban Development.
Future conversion potential
We assessed the architectural conversion viability of 25 high-vacancy buildings in downtown St. Louis. To select these buildings, we used CoStar data to identify buildings with vacancy rates in excess of 20%. The CoStar data were then triangulated with input from qualitative interviews about potential conversion candidates and additional factors such as year built, building area, number of stories, and office class in order to identify the buildings best suited to make up a representative set of properties for architectural conversion viability analysis. Finally, three buildings were selected for detailed architectural studies based on results from the initial analysis and input from interview participants.
We assigned buildings a percentage score to denote their architectural compatibility for conversion, and grouped them into the following categories:
- Properties that score above 80% can likely convert without design compromises.
- Properties that score between 70% and 80% can likely convert with some design compromises.
- Properties that score under 70% can likely convert only with major design compromises.
From the analysis, we then projected out the number of units that would be created by converting all the scored buildings. We also projected the greenhouse gas savings associated with unit creation via conversion rather than new build activity. A full explanation of our calculation methodology is included in Appendix A.
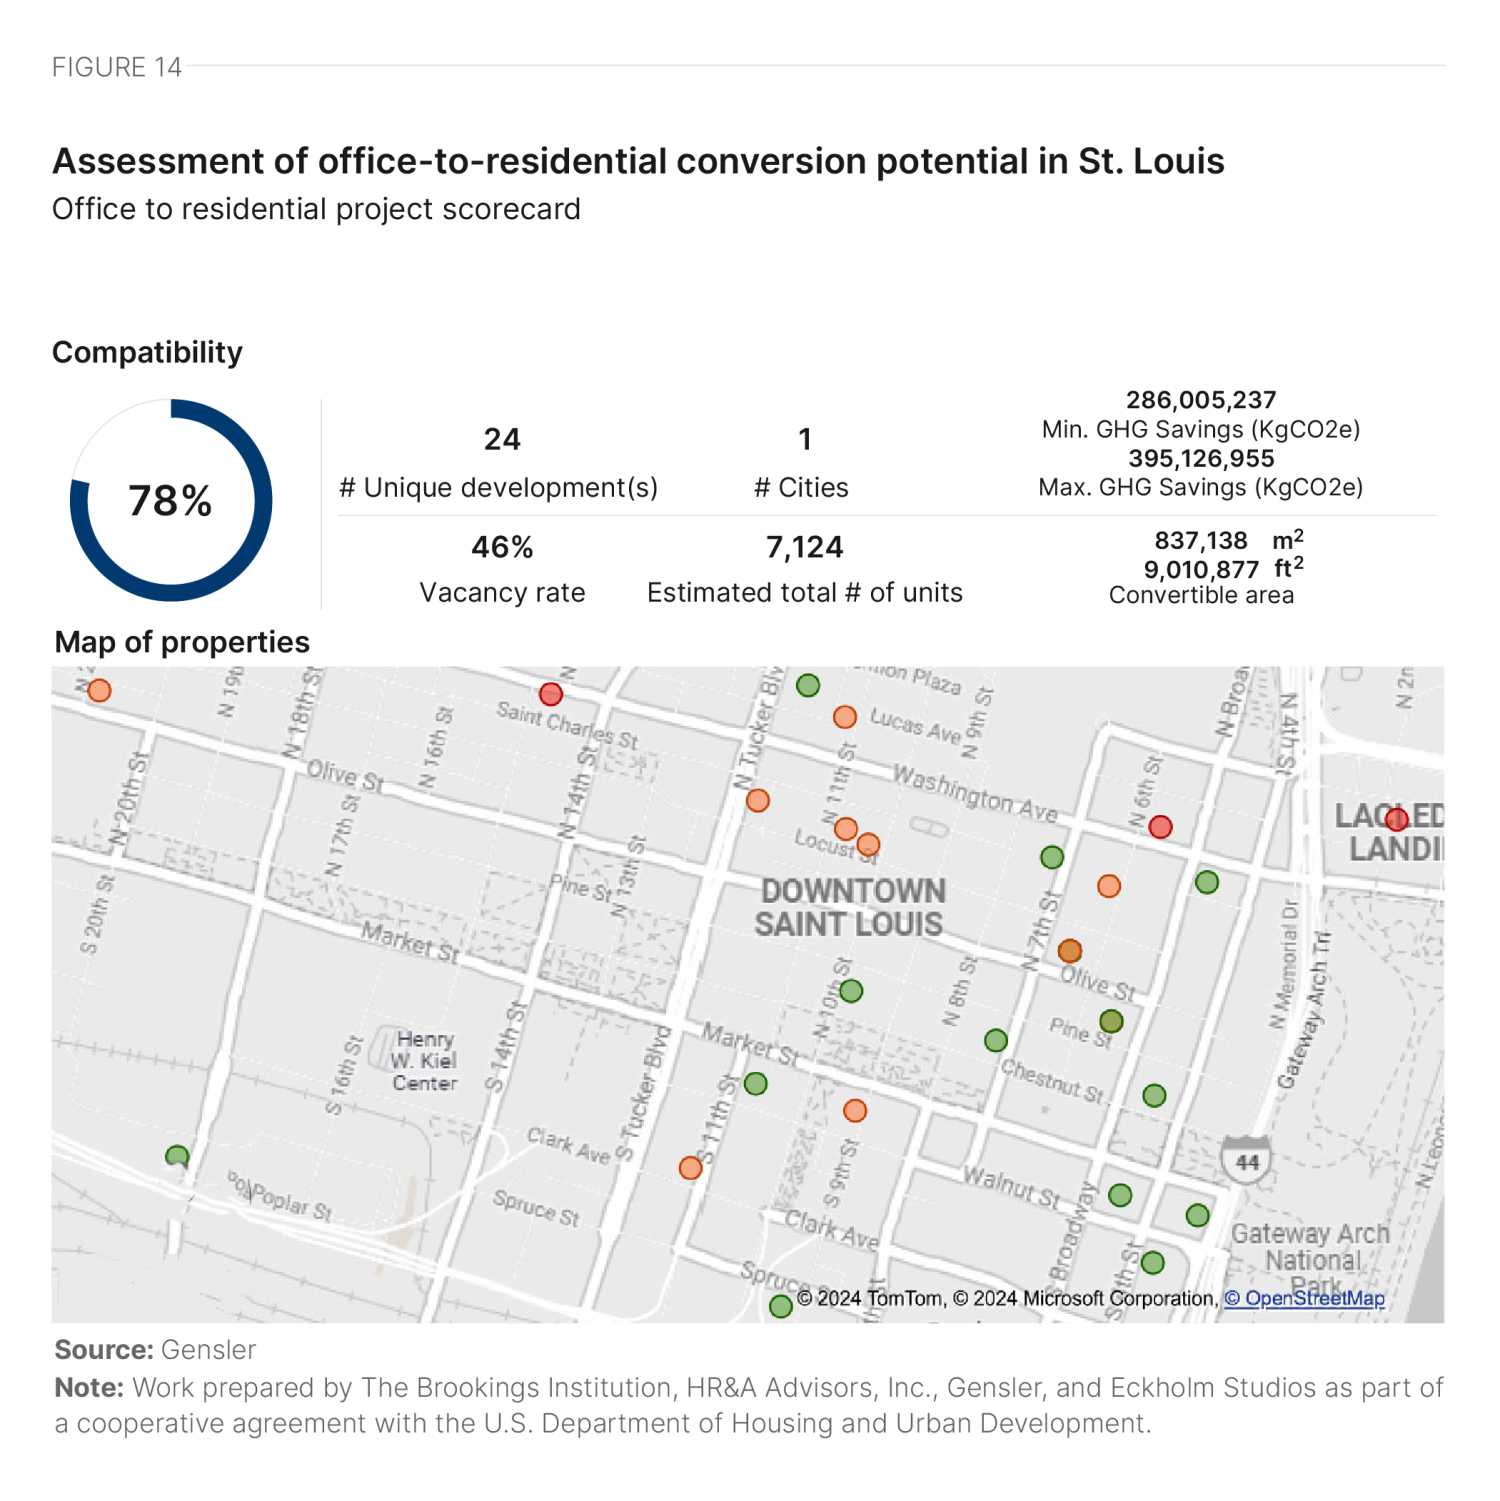
In St. Louis, we analyzed some buildings in multiple parts, resulting in a total of 29 distinct parts studied. Of these 29 parts, 15 accounted for 67% of the total building area analyzed, each scoring over 80%. Another 10 parts, making up 24% of the area, scored over 70%. Overall, the average compatibility score of buildings studied in St. Louis is slightly higher than the average score of over 1,400 buildings Gensler has studied on behalf of various clients.
Most of the buildings have the desired rectangular form for conversion, but floor plate sizes vary significantly, posing challenges for some properties. For instance, 710 N. Tucker Blvd. and some floors of 601-615 Olive St. have very large floor plates, with deep space that is difficult to utilize. On the other hand, buildings such as 111 N. Seventh St. and 412 N. Tucker Blvd. have smaller-than-ideal floor plates, negatively impacting their score, as their smaller floor plates would likely result in a constrained unit mix and lower floor plate efficiency.
The majority of the buildings we studied have punched window openings, which impacted the overall city score positively. A minority of buildings we studied have a curtain wall façade or ribbon windows, which generally score lower as they have an elevated chance of needing replacement. Most buildings with ribbon windows or curtain wall façades—such as 800 Market St. and 1010 Market St.—were built in the 1970s and 1980s.
Floor-to-floor height was a disadvantage for many properties in St. Louis. Buildings such as 555 Washington Ave. and 1015 Locust St. have lower floor-to-floor height, which is not a desired feature for conversion and therefore scores lower. Other buildings such as 710 N. Tucker Blvd. and 1424 Washington Ave. have higher floor-to-floor heights, which could potentially increase the cost of construction.
Good walkability, supported by bus and light rail service by Metro St. Louis, had a positive impact on the scores of all buildings analyzed.
601-615 Olive Street: The Railway Exchange Building
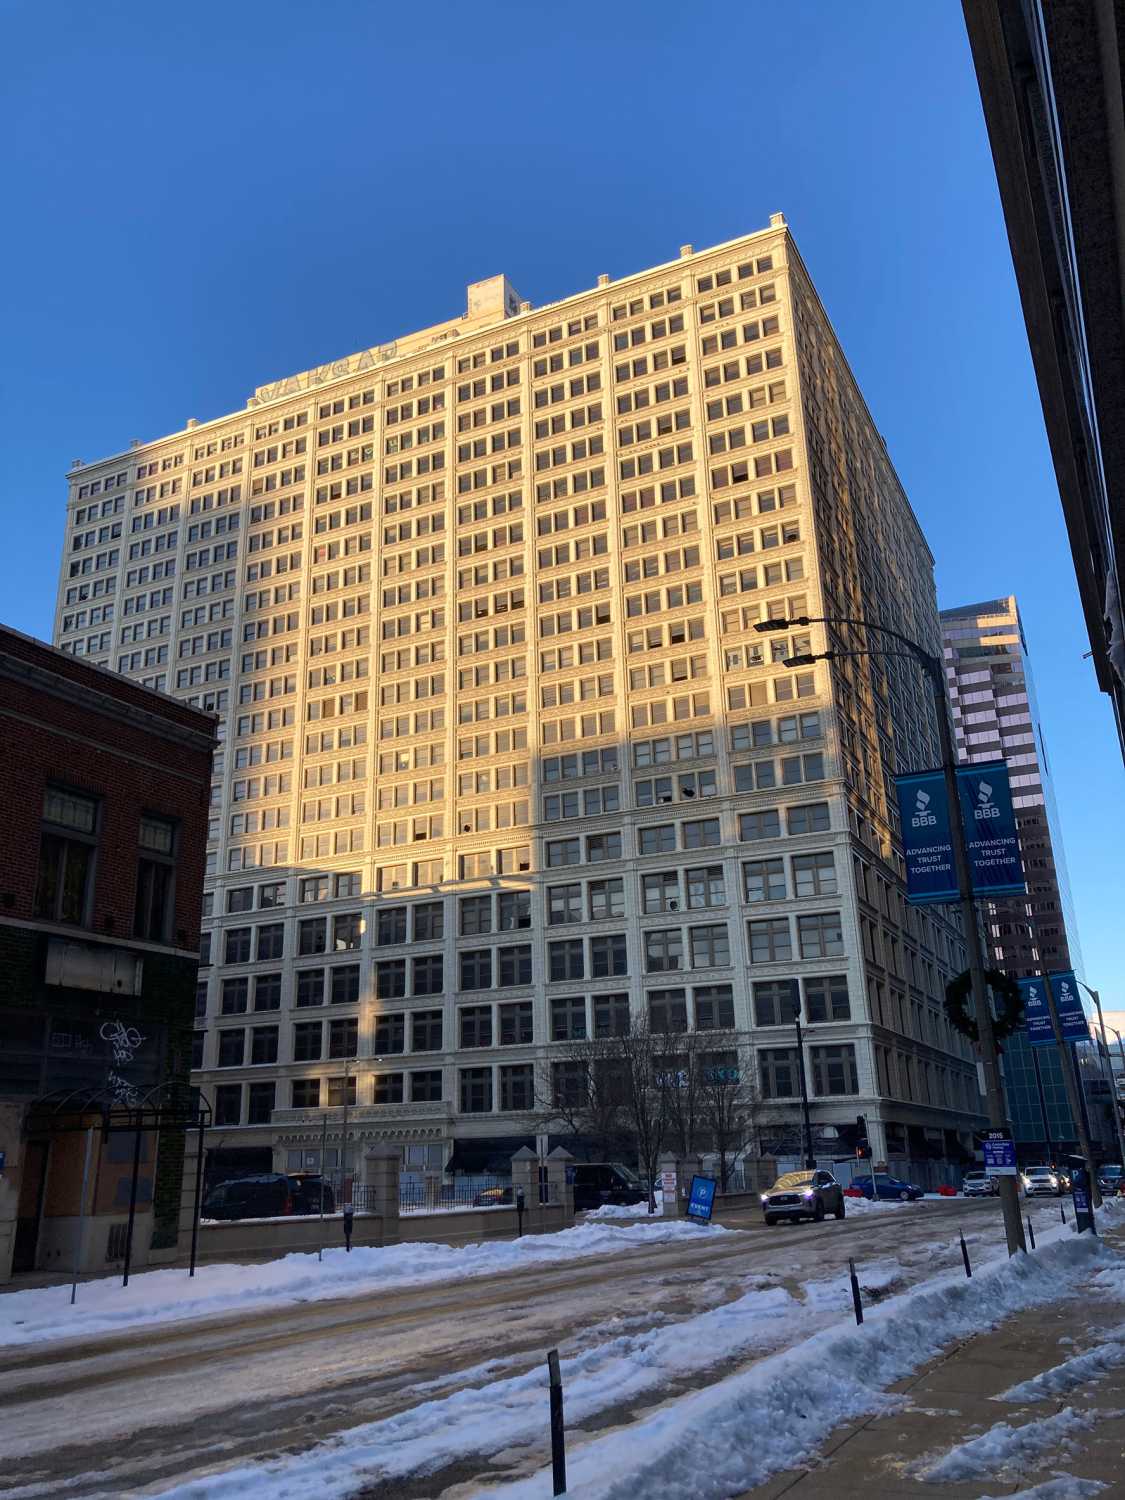
The Railway Exchange Building | Photo credit: Gensler
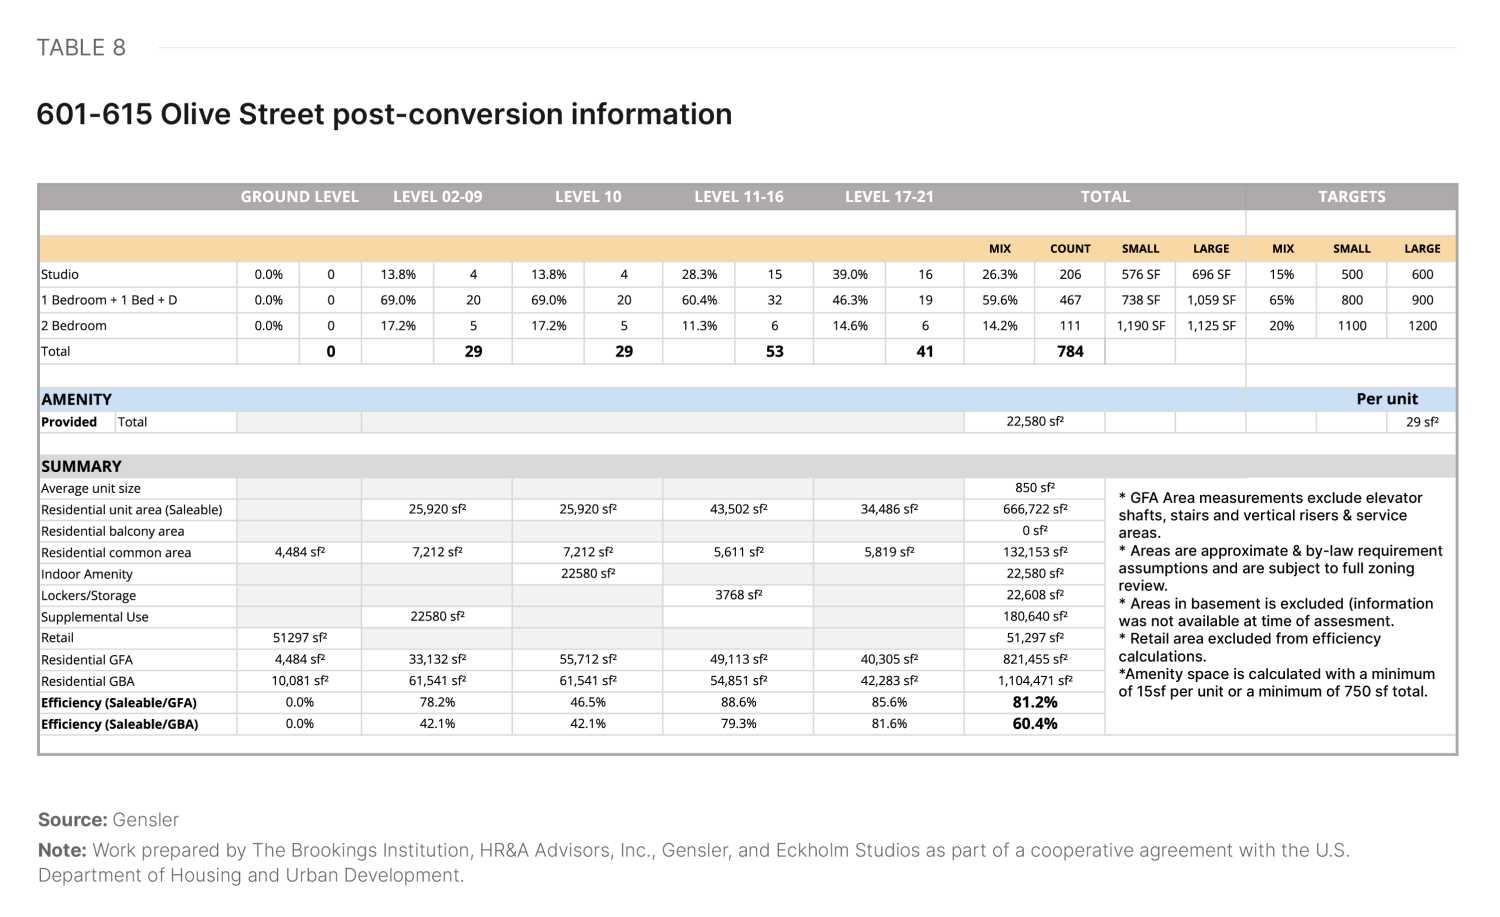
601-615 Olive St. sits centrally in the block between Locust Street/Olive Street and N. Seventh Street/N. Sixth Street. Built in 1913, it is a 21-story structure with a gross area of 1,153,995 square feet. Due to its varying floor plate sizes and different features, the building is studied in three parts.
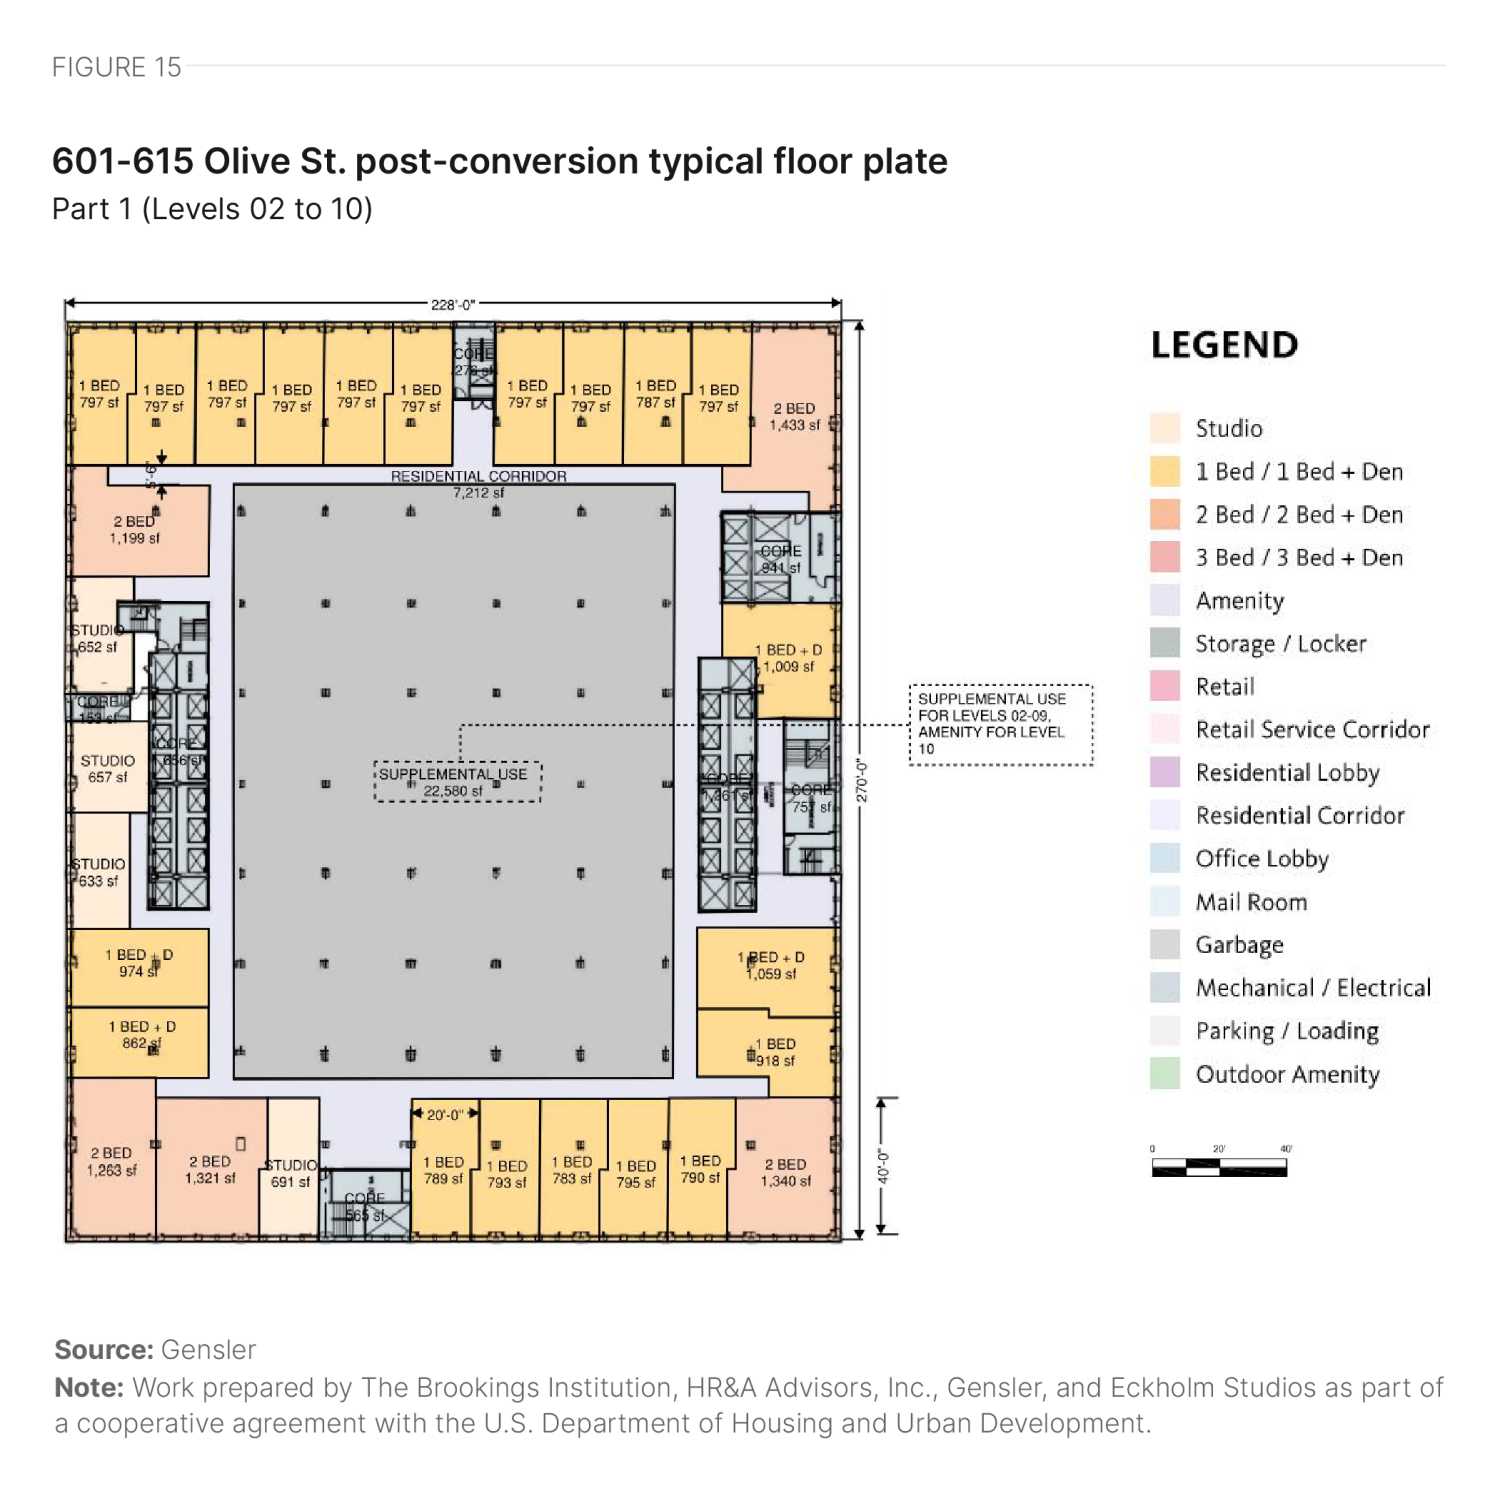
Levels 02 to 10 comprise Part 1. These levels feature a very large floor plate and core-to-window depth, with two distinct cores located on the sides. Due to the size of the floor plate, there is a significant amount of deep space that cannot be used for units. The developer could introduce a supplemental use, such as self-storage, to utilize this space and improve floor plate efficiency. The building has punched windows on all sides, providing good access to views and daylight. The ground floor is expected to be designated for retail, with part of it allocated to the residential lobby and service areas.
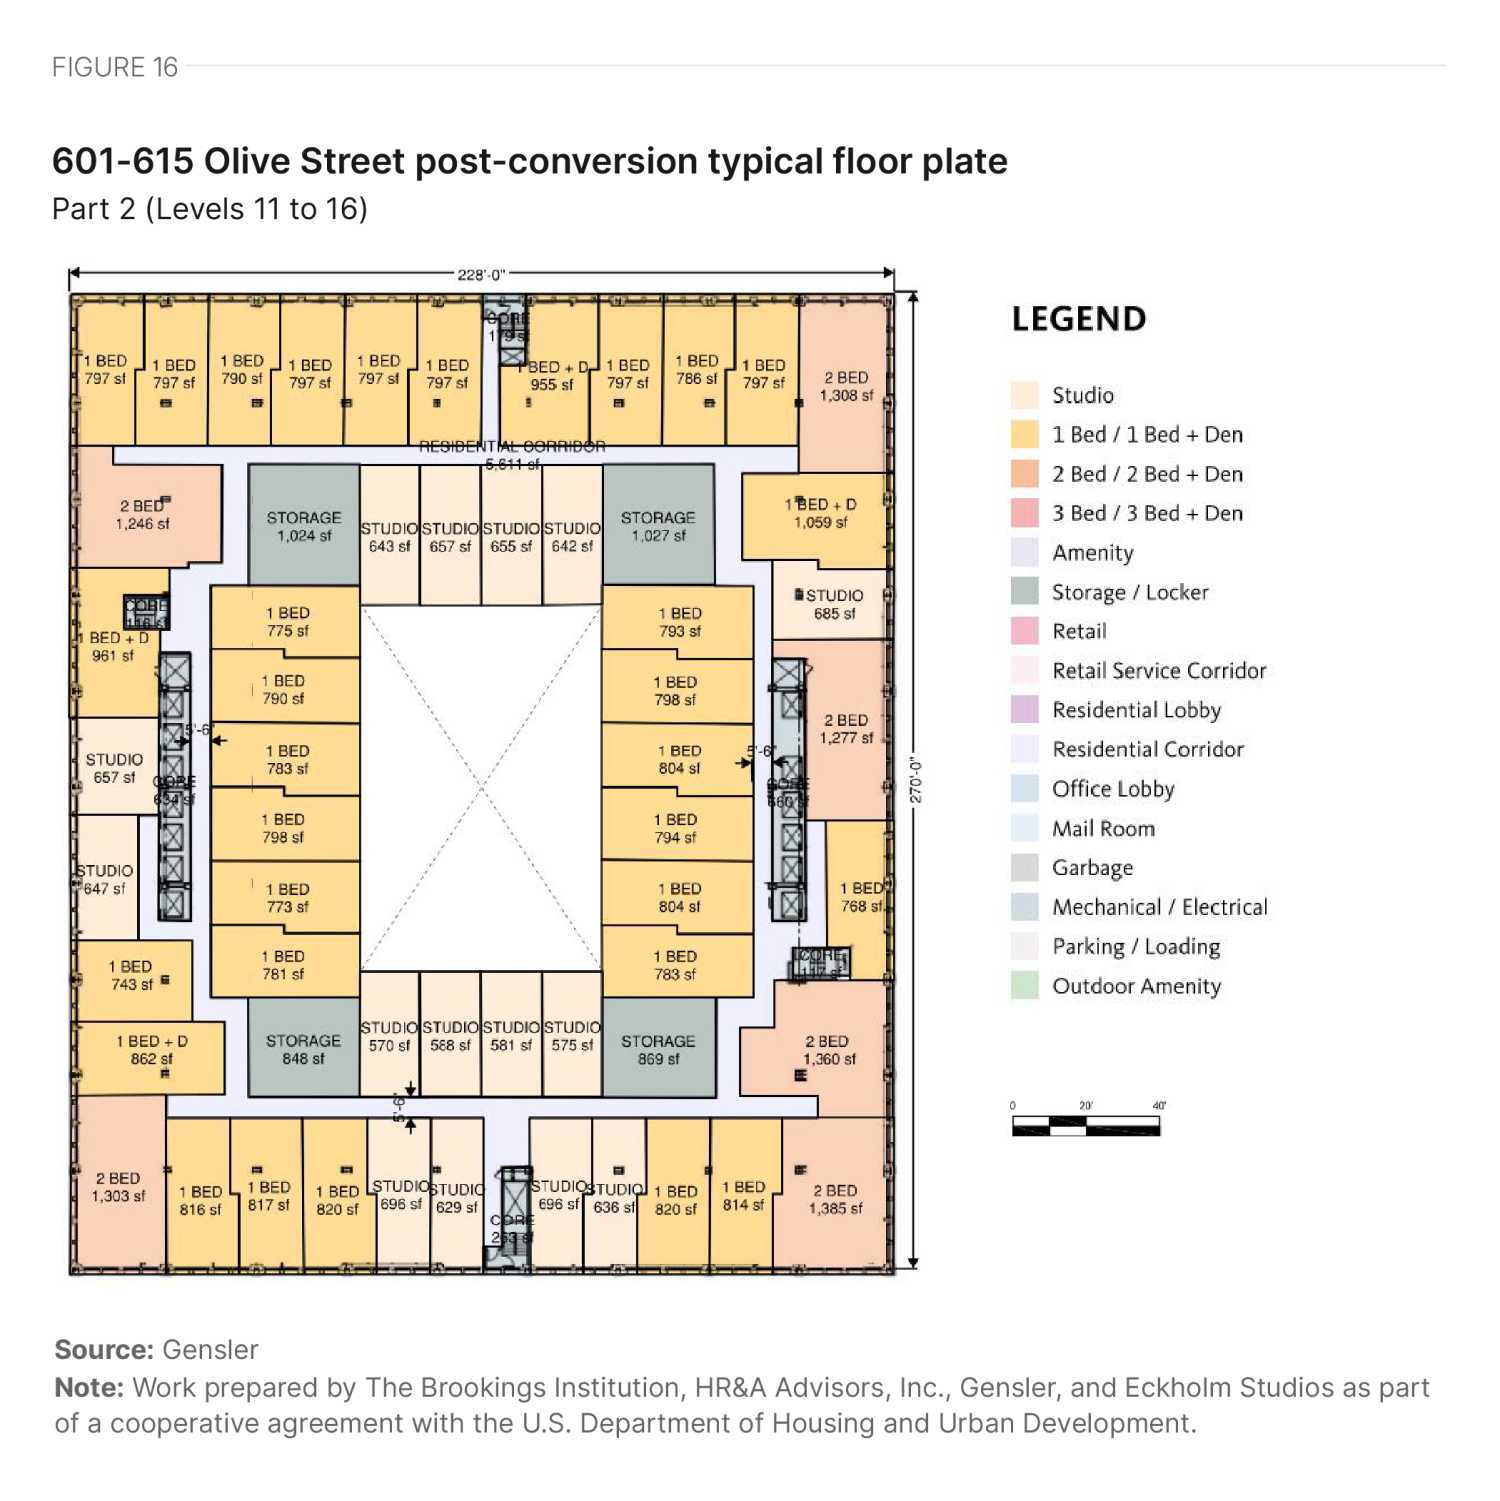
Levels 11 to 16 comprise Part 2. These levels feature a courtyard in the center of the floor plate, which reduces the overall floor plate size and decreases the amount of deep space. Given the size of the courtyard and the floor plate depth, the developer can introduce a double-loaded corridor with some interior-facing units, resulting in a reasonable level of floor plate efficiency. Punched windows on all sides, including the courtyard side, provide excellent access to views and daylight.
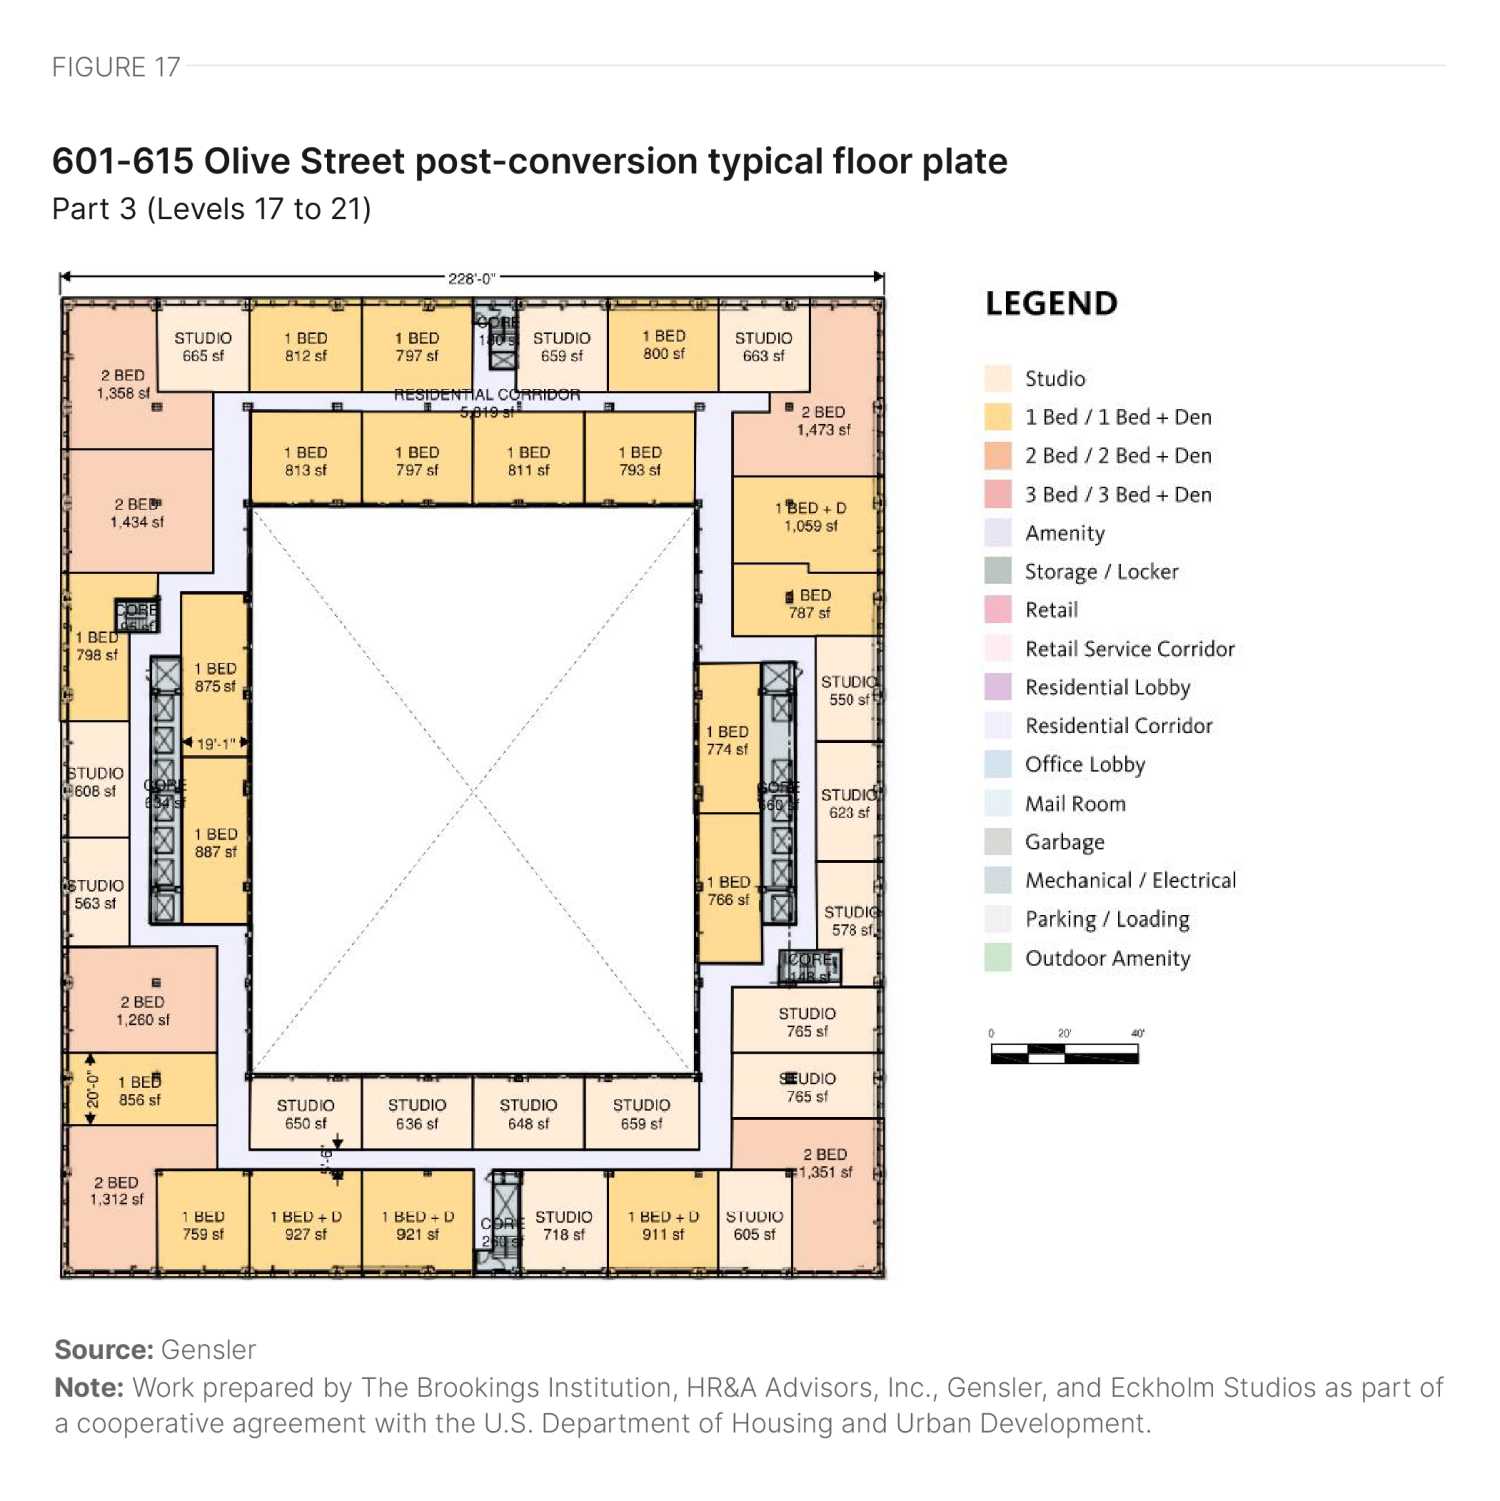
Levels 17 to 21 comprise Part 3. These levels feature a larger courtyard in the middle of the floor plate, further reducing the floor plate size. Given the size of the courtyard and depth of the floor plate, the developer can introduce a double-loaded corridor with some smaller units facing inside and others facing outside, maintaining a reasonable level of floor plate efficiency. The building has punched windows on all sides, including the courtyard side, providing excellent access to views and daylight.
Given the varying physical features of the three parts, a developer could consider mixed-use development with residential space in the upper portions. However, Table 8 summarizes the hypothetical residential yield of a housing-only conversion, while Figures 15 to 17 illustrate hypothetical floor plans for the three level-groupings of the building.
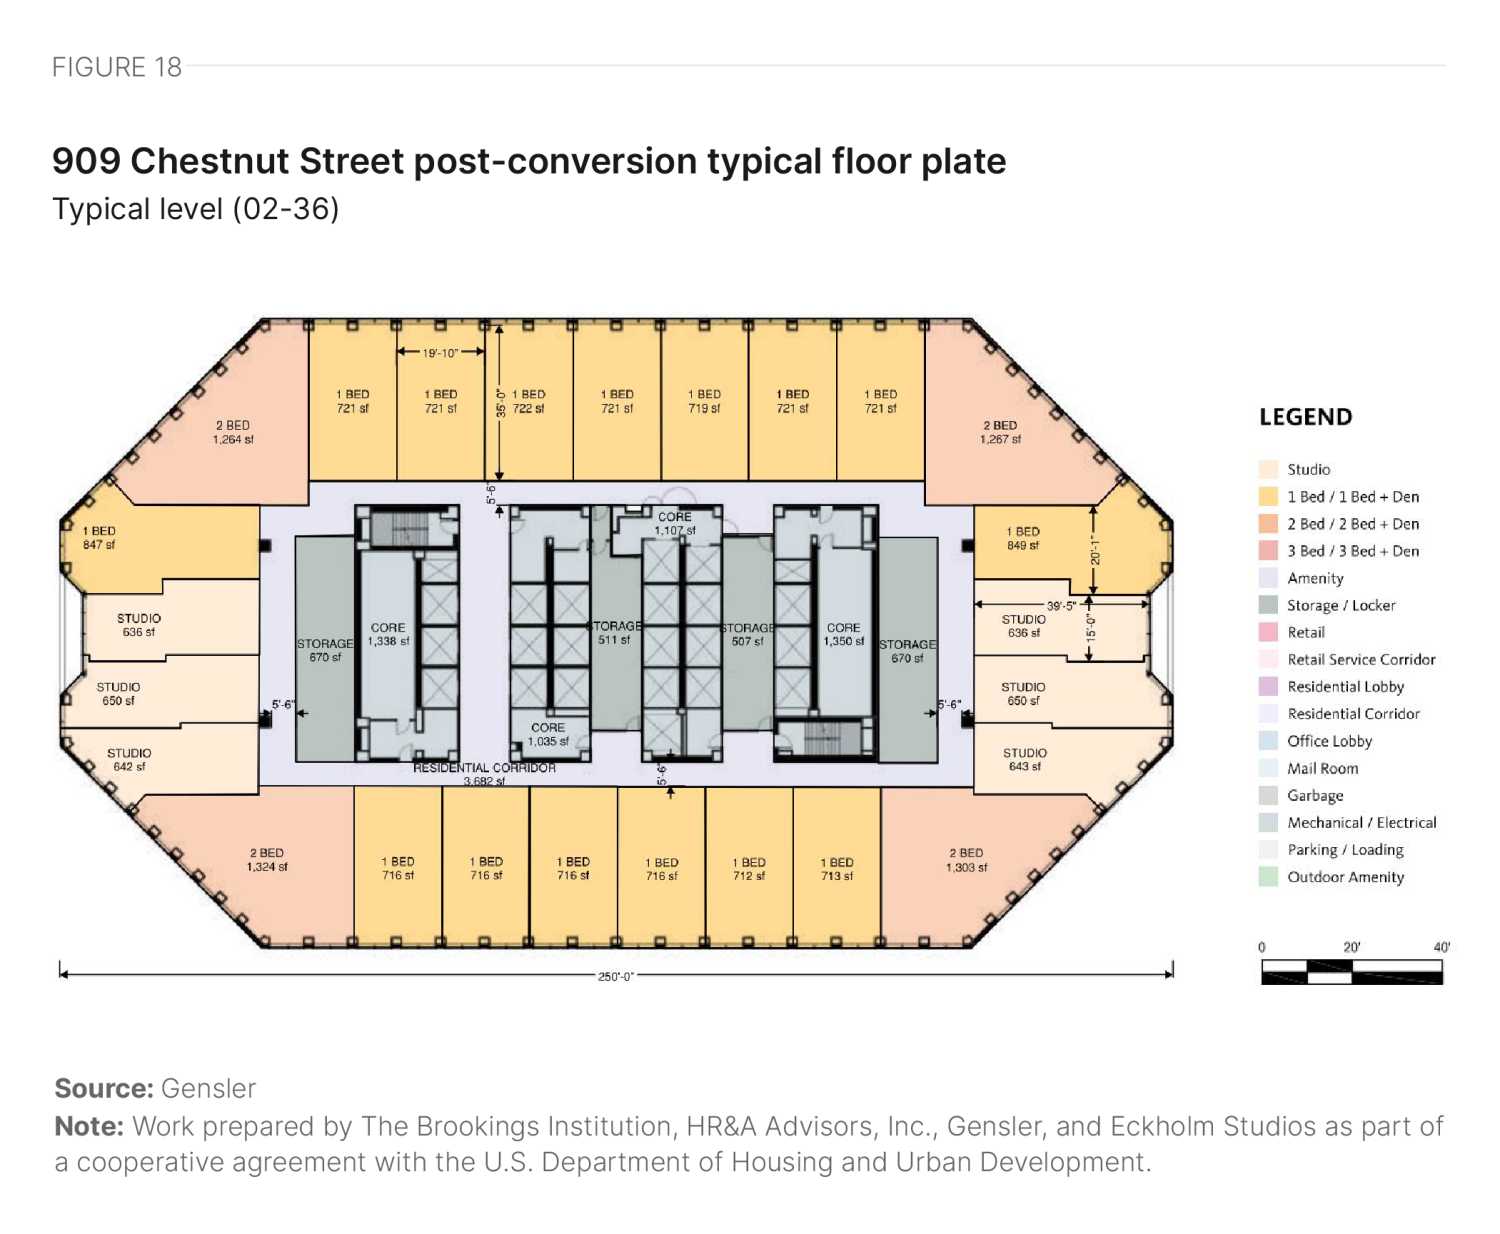
909 Chestnut Street: AT&T Tower
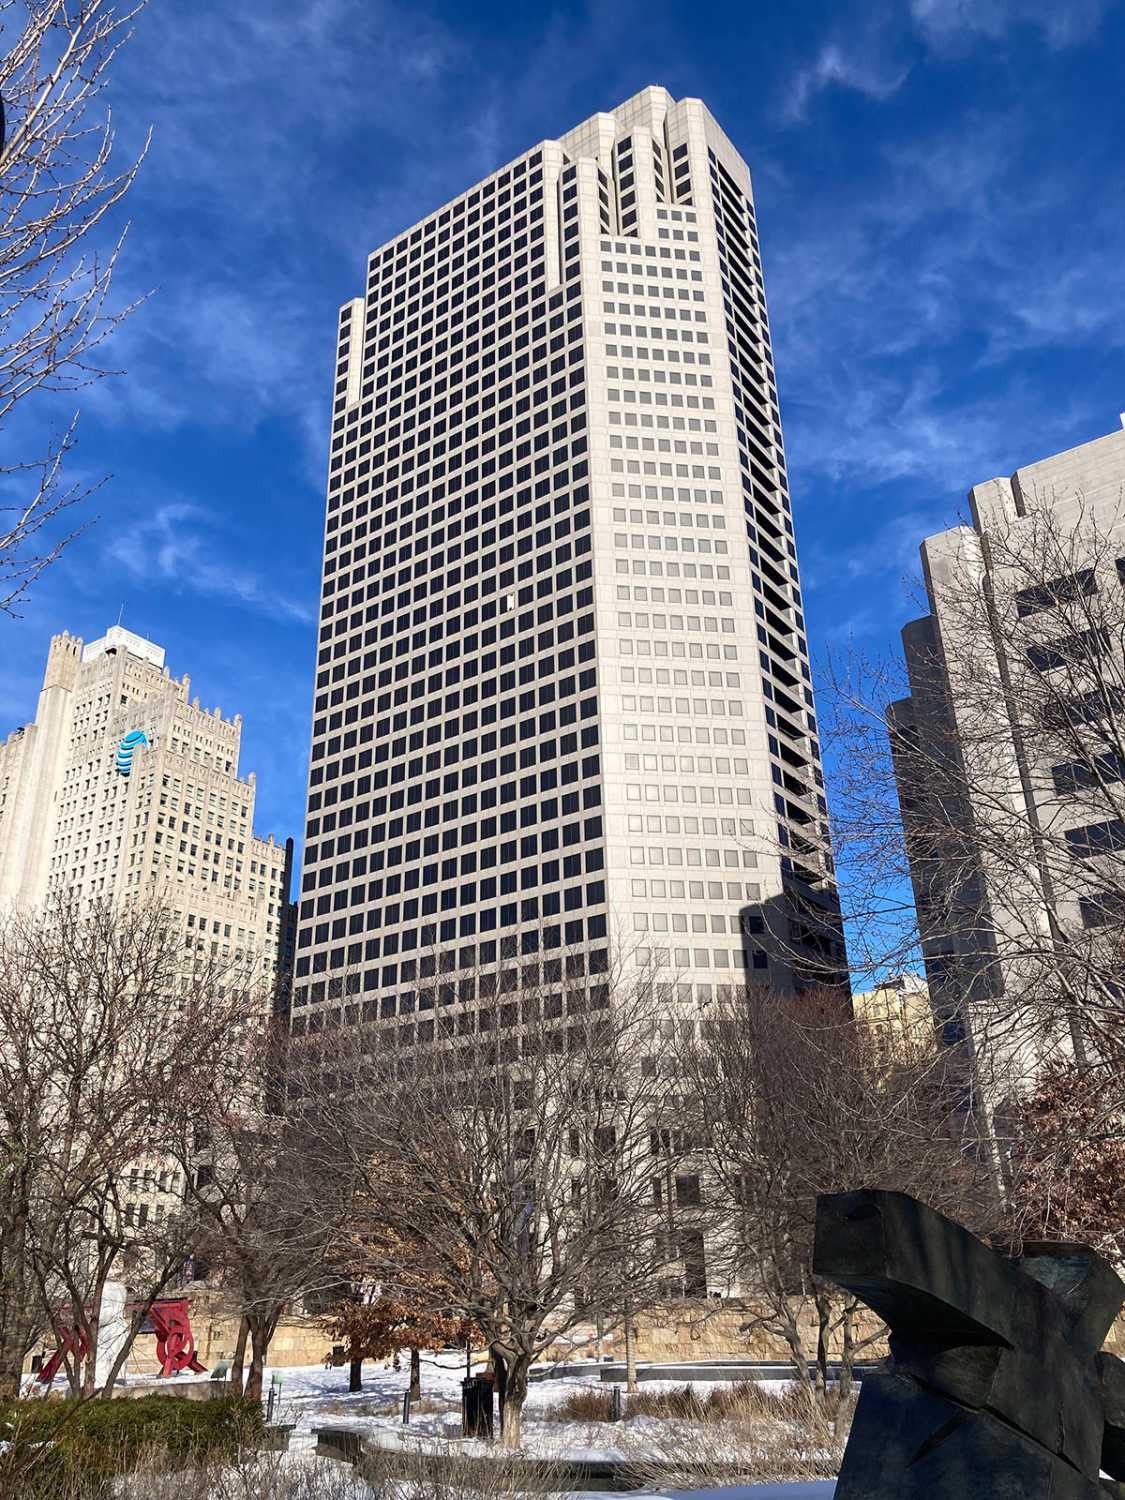
909 Chestnut Street: AT&T Tower | Photo credit: Gensler
909 Chestnut St. sits centrally in the block between Pine Street/Chestnut Street and N. 10th Street/N. Ninth Street. Built in 1986, it is a 42-story structure with a gross area of 1,461,274 square feet.
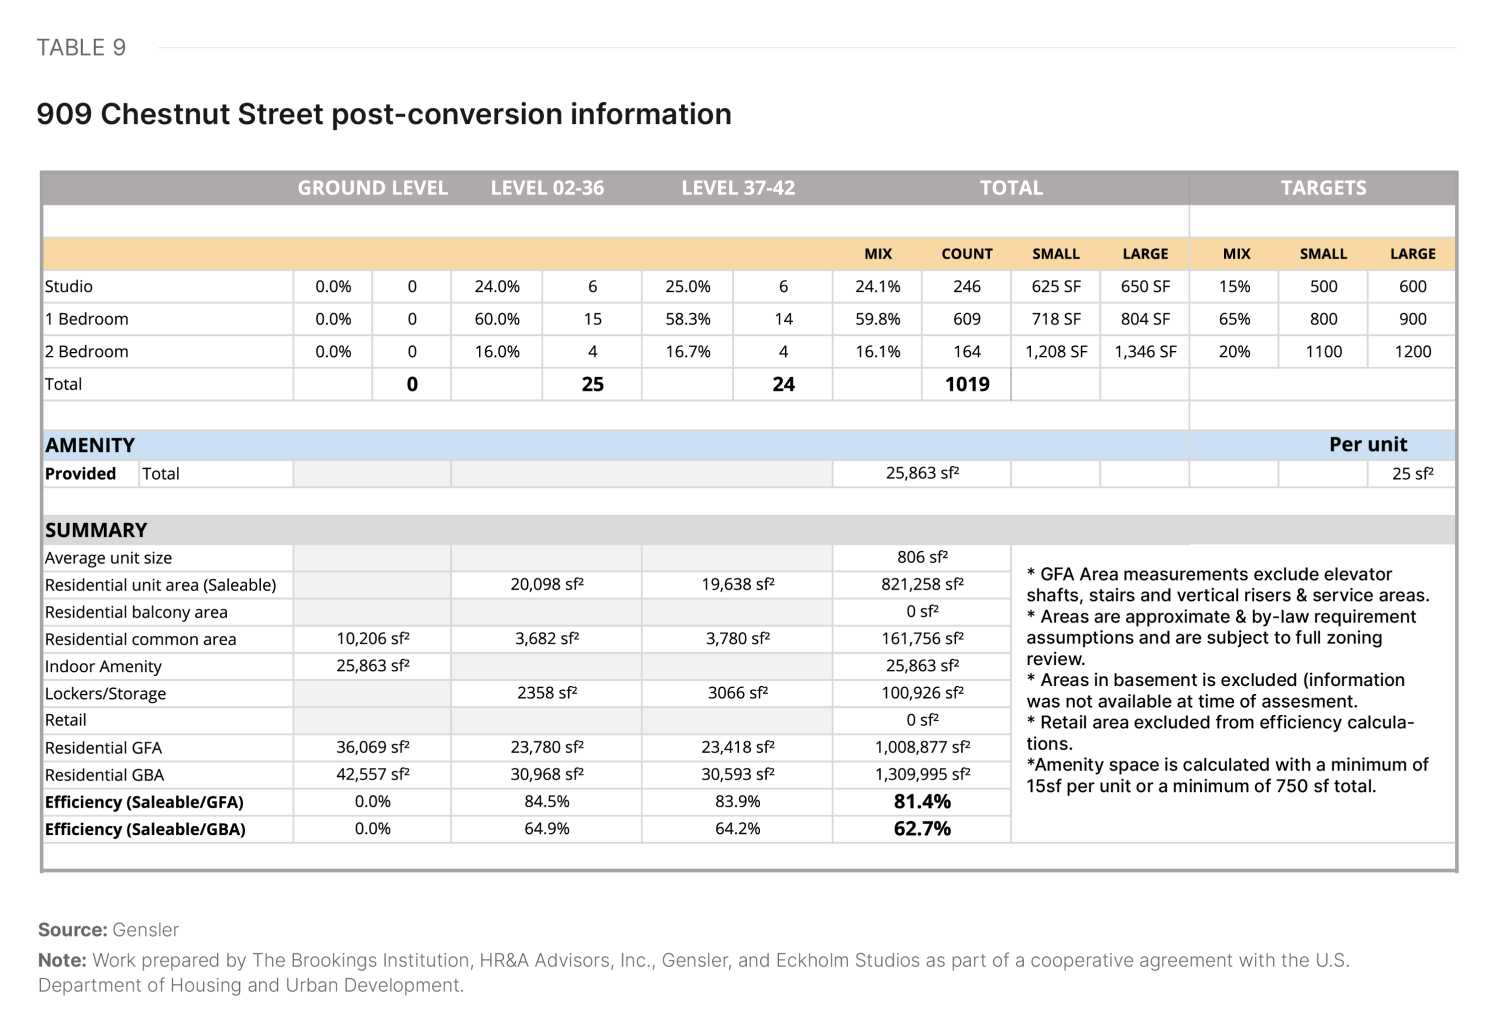
The building features an elongated octagonal floor plate with a centrally located core. Although the floor plate size is larger than ideal, the core-to-window depth is close to ideal, resulting in a reasonable level of floor plate efficiency and units close to market size. Due to the size of the building, multiple elevator banks create interstitial space that can be used for storage but negatively impact the overall efficiency. The punched windows provide excellent access to views and daylight. In a conversion, the ground floor would support residential use on the upper floors, with areas dedicated to the residential lobby, amenities, and service spaces. Table 9 summarizes the hypothetical residential yield, while Figure 18 illustrates the hypothetical floor plan of an upper floor.
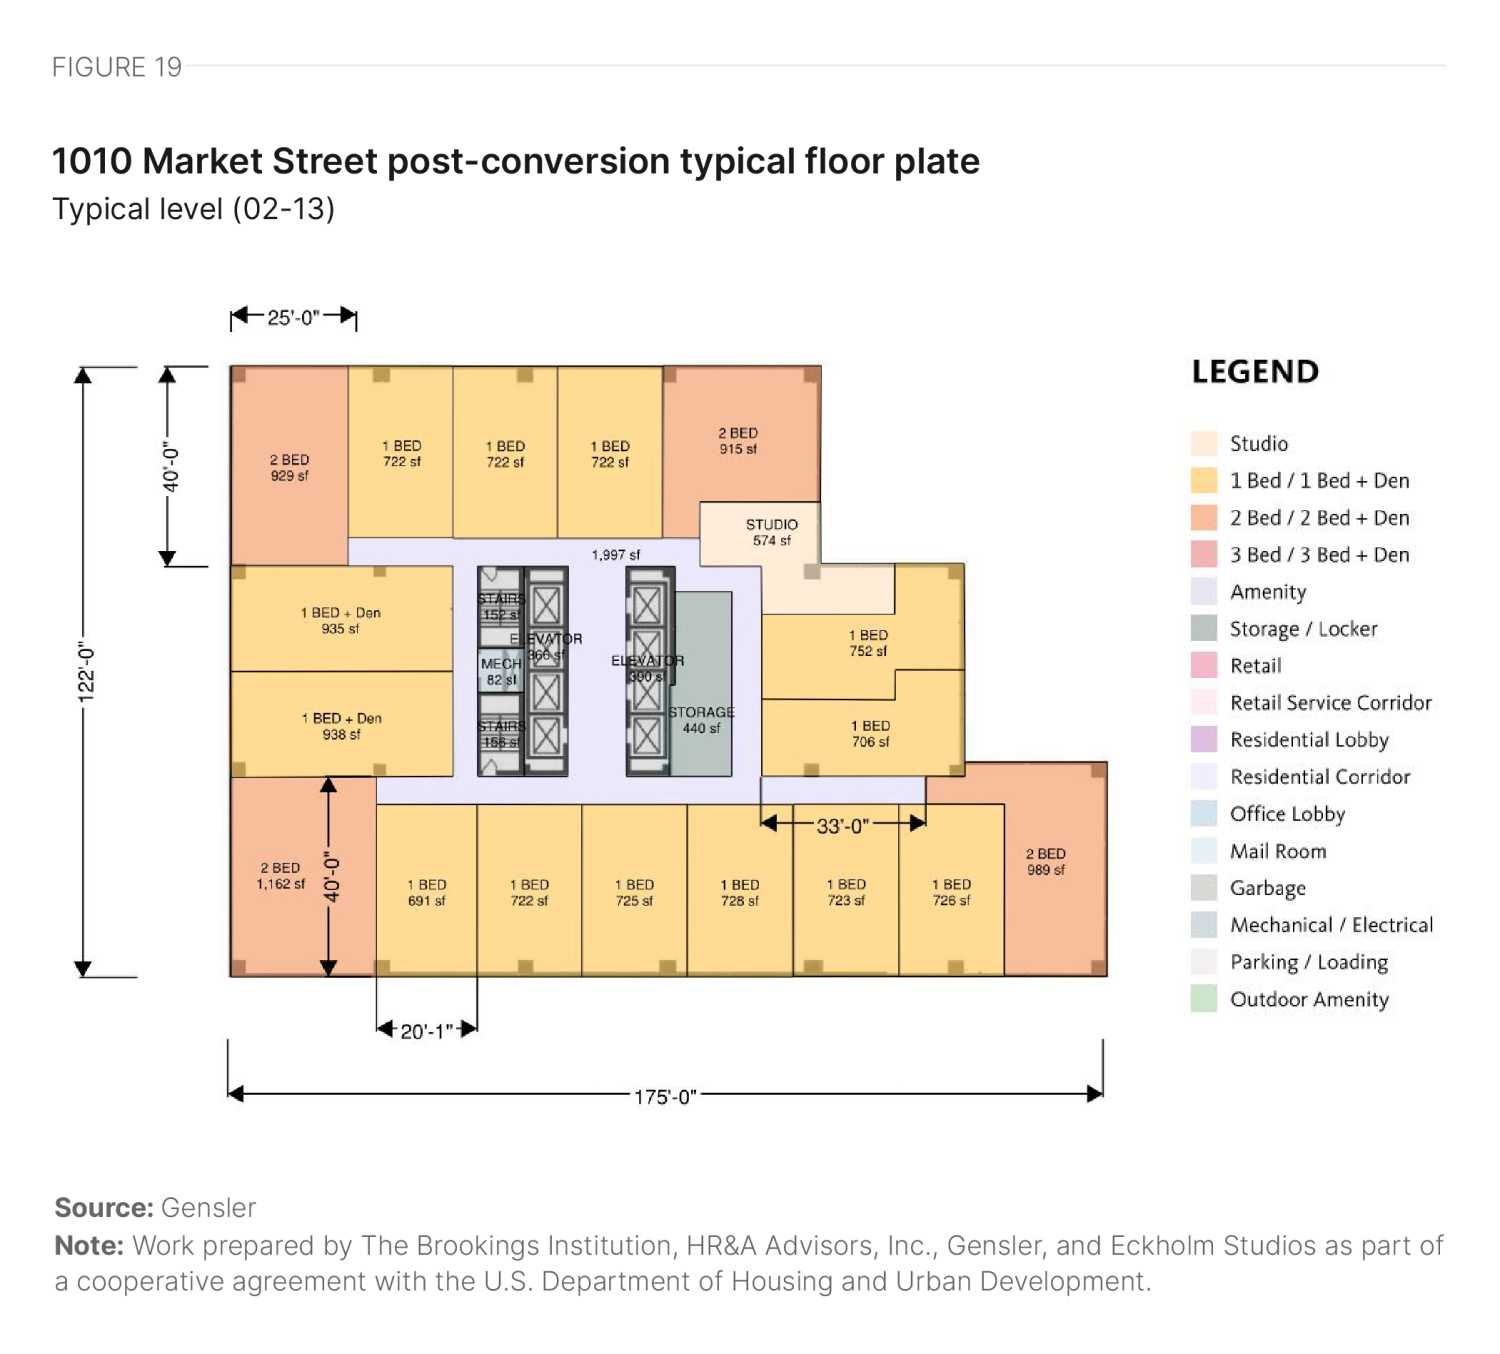
1010 Market Street
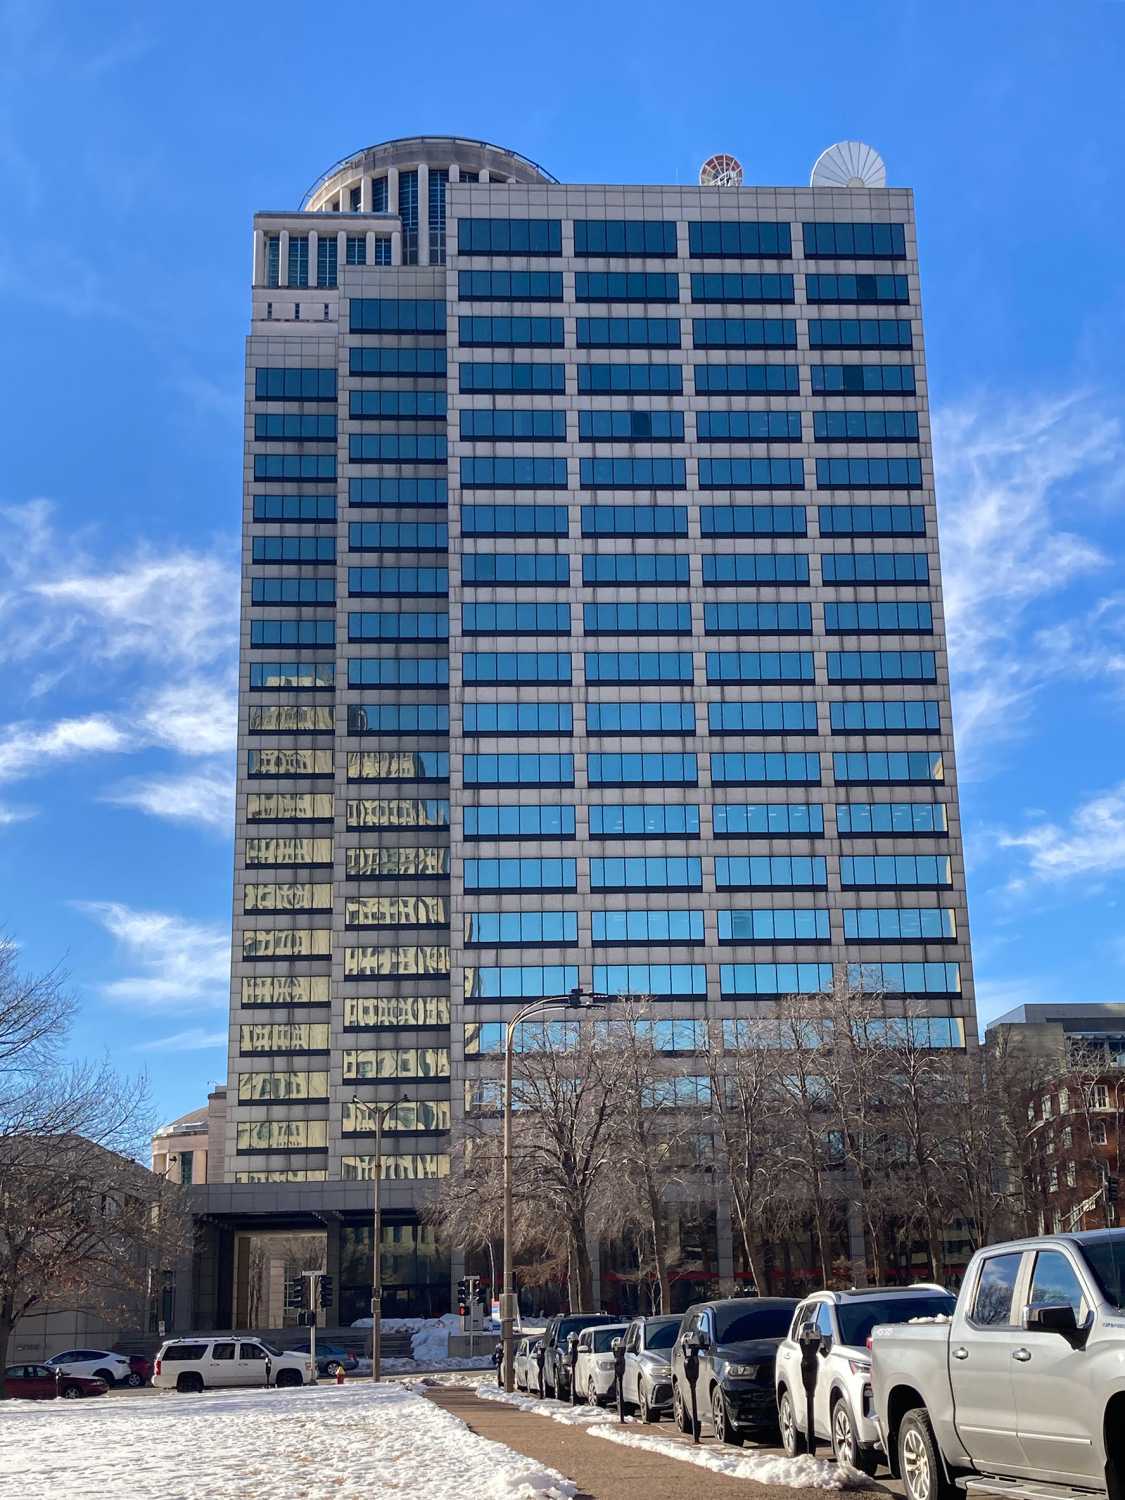
1010 Market Street | Photo credit: Gensler
1010 Market St. sits centrally at the intersection of Market Street and S. 11th Street. Built in 1979, it is a 20-story structure with a gross area of 396,940 square feet.
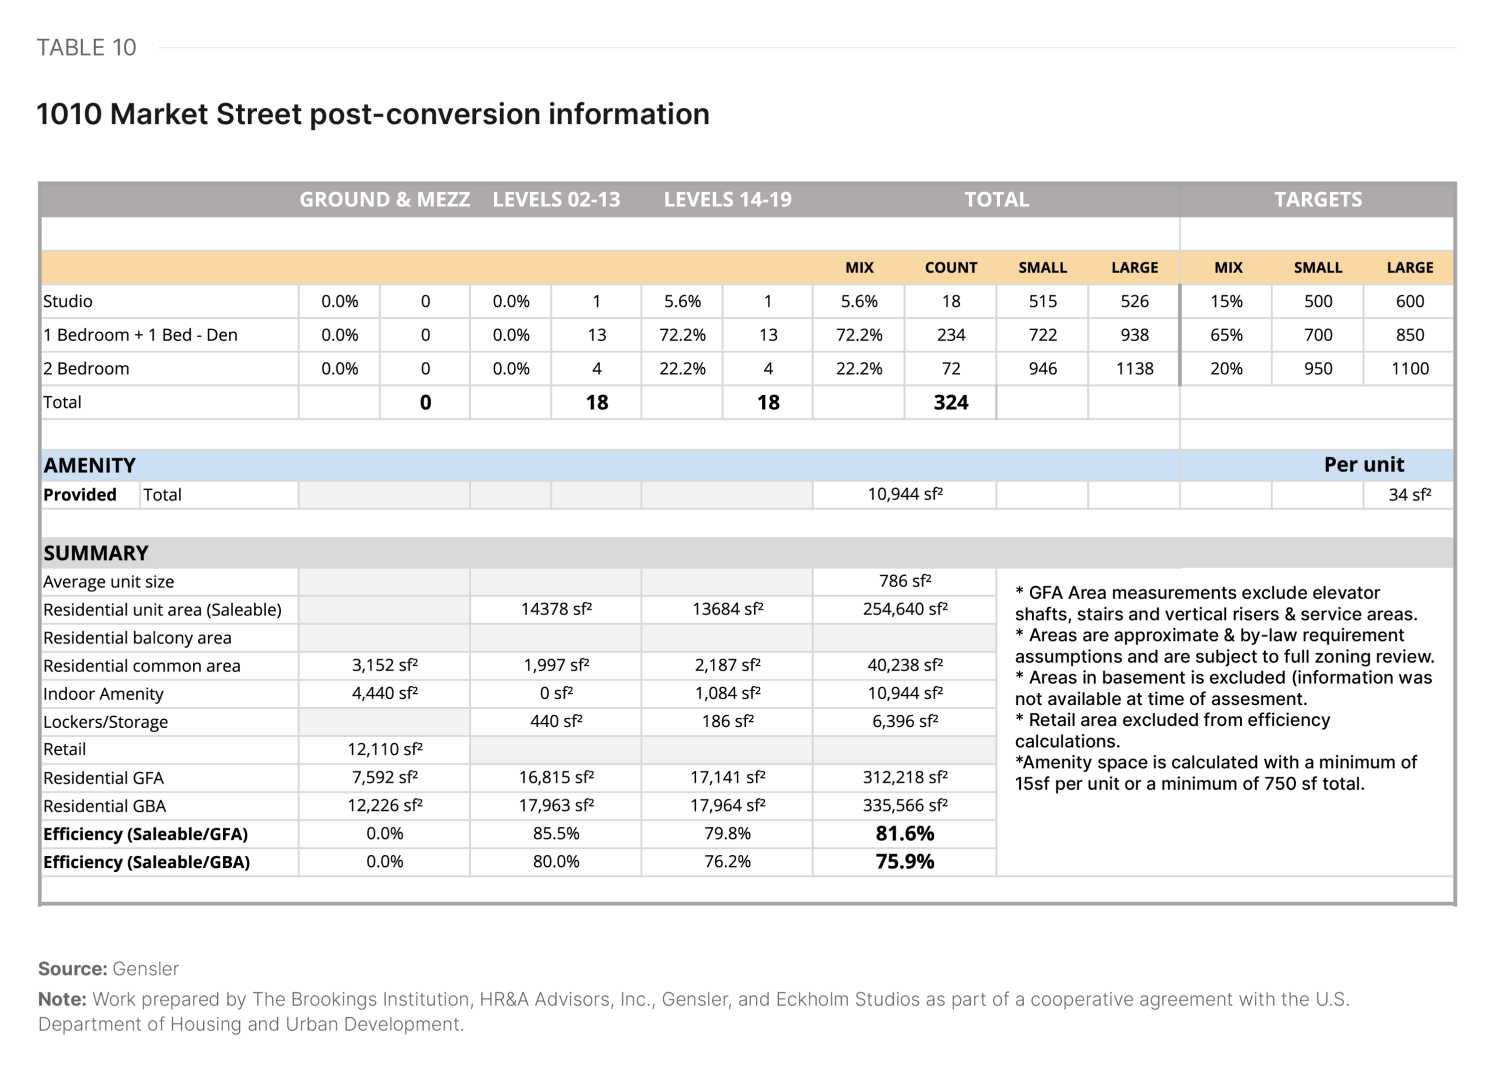
The building features a rectangular floor plate with substantial steps in the façade and a centrally located core. Although the floor plate size is slightly larger than ideal, the core-to-window depth is close to ideal, resulting in a reasonable level of floor plate efficiency. In areas with deep space, the developer can introduce storage. The ribbon windows provide excellent access to views and daylight, but if the developer retains the façade, they may need to add operable sections. In a conversion, the ground floor could accommodate retail in addition to some areas dedicated to the residential lobby, amenities, and service spaces. Table 10 summarizes the hypothetical residential yield, while Figure 19 illustrates a hypothetical floor plan for an upper story.
Future outlook
The Wall Street Journal memorably called downtown St. Louis a “nightmare.” However, local stakeholders expressed that much of the perception of downtown as a site of decline and urban decay is related to the stagnation of a few key buildings and parcels, especially the Railway Exchange and Millennium Hotel, while other parts of the district, such as Laclede’s Landing along the waterfront, are experiencing growing vibrancy. In fact, the National Park Service reports that visitation at the Gateway Arch in 2023 was 18% higher than in 2019, the last calendar year before the pandemic. Using cell phone location tracking data, Table 11 estimates the number of unique visitors on a typical Thursday downtown and citywide in the fall of 2019 and 2023. Overall downtown unique visits in 2023 (measured as estimated trips into downtown) are only 6% below the 2019 level (Table 11).
|
Winston-Salem |
St. Louis |
Pittsburgh |
Houston |
Los Angeles |
Stamford |
||||||
|---|---|---|---|---|---|---|---|---|---|---|---|
|
Citywide |
|||||||||||
| Fall 2019 | 972,648 | 1,139,210 | 1,042,281 | 10,416,616 | 13,082,015 | 427,544 | |||||
| Fall 2023 | 1,083,344 | 1,224,894 | 1,269,712 | 10,732,698 | 13,265,515 | 523,890 | |||||
| Percent Change | 11% | 8% | 22% | 3% | 1% | 23% | |||||
|
Downtown |
|||||||||||
| Fall 2019 | 46,014 | 119,880 | 120,850 | 275,304 | 793,111 | 102,939 | |||||
| Fall 2023 | 45,570 | 113,112 | 106,773 | 242,267 | 747,974 | 124,271 | |||||
| Percent Change | -1% | -6% | -12% | -12% | -6% | 21% | |||||
Source: Replica data
Note: Work prepared by The Brookings Institution, HR&A Advisors, Inc., Gensler, and Eckholm Studios as part of a cooperative agreement with the U.S. Department of Housing and Urban Development.
Locals expressed the belief that repositioning key problem parcels would mark a substantial shift in downtown as a whole and attract more residents. While St. Louis already has a large range of downtown tax incentives available for individual properties relative to other cities, more significant intervention may be required, possibly in the form of issuing tax increment financing or tax-exempt revenue bonds.
We believe in the future of downtown St. Louis, but we are not converting [right now] because we need downtown to turn [around]. We are already giving a month rent-free to tenants. We can't have more [residential buildings] come online.
A St. Louis stakeholder
Recently, the Gateway Arch Park Foundation acquired the massive, vacant Millenium Hotel—a property positioned between the Arch and the city’s baseball stadium, with 780 dormant hotel rooms on 4.2 acres. The foundation’s stated goal is to reposition the parcel for infill redevelopment. In addition, the city has filed to seize the Railway Exchange Building by eminent domain after condemning the property last year.
The future of downtown St. Louis is clearly not stagnant, and significant capital is already moving within the submarket. The Design Downtown STL Master Plan envisions a downtown of “equity and opportunity” with even more new residents—and this vision is within reach with the right city, state, and federal support.
Office-to-residential conversion case studies


Authors
Authors listed in alphabetical order


-
Acknowledgements and disclosures
This research was supported by the U.S. Department of Housing and Urban Development under a cooperative agreement.
The authors thank Hanna Love for her review of this piece.
The authors also thank the following contributors for their invaluable assistance on this project:
HR&A:
- Stefan Korfmacher – Research analyst
- Joe Speer – Analyst
- Gensler:
- Diksha Jain – Architect
- Ingmar Buchner – Designer
- Lisa Matthews – Intern
- Nancy Yeh – Designer
- Jose Segura – Architect
Turner Construction:
- Reinaldo Rodriguez
All remaining errors and omissions are those of the authors themselves.
The work that provided the basis for this publication was supported by funding under an award with the U.S. Department of Housing and Urban Development. The substance and findings of the work are dedicated to the public. The author and publisher are solely responsible for the accuracy of the statements and interpretations contained in this publication. Such interpretations do not necessarily reflect the views of the Government.
-
Footnotes
- Brookings analysis of American Community Survey 2022 5-Year Estimates.
- HR&A analysis of CoStar real estate market data from 2017 to Q3 2024.
- HR&A analysis of CoStar real estate market data from 2019 to Q3 2024 and authors’ interviews with local stakeholders.
- HR&A analysis of CoStar real estate market data for Q3 2024.
- HR&A analysis of CoStar real estate market data for Q3 2024.
- Brookings analysis of U.S. Census Bureau Longitudinal Employer-Household Dynamics origin-destination data.
- HR&A analysis of inflation–adjusted rents using CoStar real estate market data from 2014 to Q3 2024.
- Area median income (AMI) is a key metric used in assessing housing affordability. It is defined as the median (midpoint) of a specific geography’s income distribution (such as a metropolitan area) for different household sizes. It is calculated each year by the U.S. Department of Housing and Urban Development (HUD). According to HUD, households should pay no more than 30% of their gross income on housing, and households that pay more than 30% are considered “housing cost burdened”. HR&A’s analysis of the percentage of units by AMI category in a market begins by establishing “affordable rent levels,” which are equivalent to 30% of income at AMI for different household sizes; e.g., for a one-person household in an area with an AMI of $X, the “affordable monthly rent level” would be ($X * 30%) / 12. With those rent levels established, the analysis compares unit rent levels to AMI levels at the household sizes that correspond to the number of bedrooms in a unit; e.g., a one-bedroom unit’s rent is compared against 30% of the AMI of a one-person household, and so on.
- Brookings analysis of American Community Survey 2022 5-Year Estimates.
- Brookings analysis of American Community Survey 2022 5-Year Estimates.
- HR&A analysis of CoStar real estate market data from 2020 to Q3 2024.
The Brookings Institution is committed to quality, independence, and impact.
We are supported by a diverse array of funders. In line with our values and policies, each Brookings publication represents the sole views of its author(s).