This publication is part of a broader series examining the potential of office-to-residential conversions across six U.S. case studies. The project is part of a cooperative agreement with the US Department of Housing and Urban Development, and the research team is composed of contributors from Gensler, HR&A Advisors, Brookings, and Eckholm Studios.
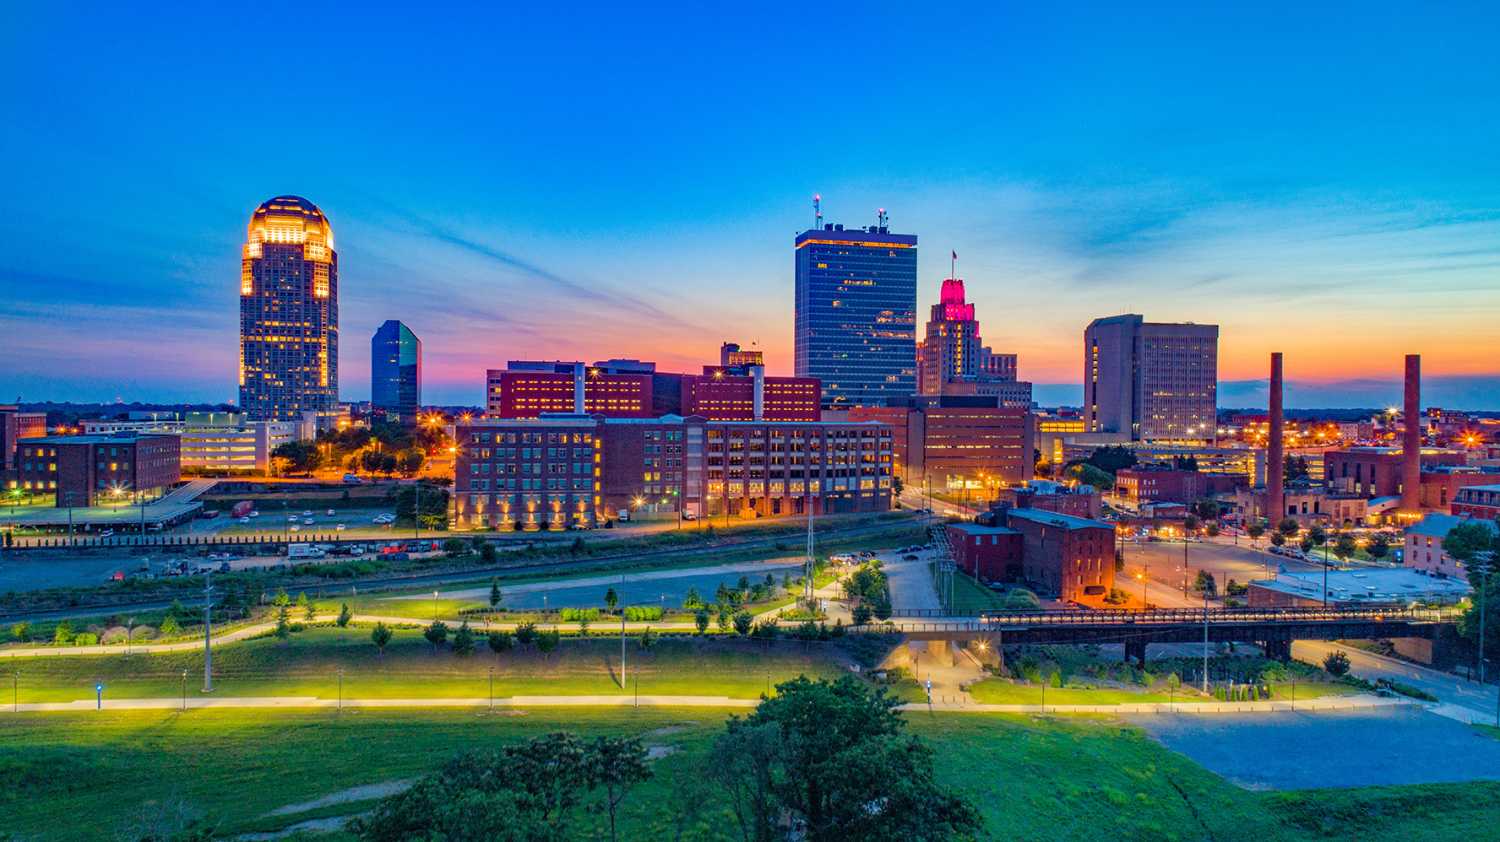
Beginning in the early 2000s, Winston-Salem, N.C. reversed decades of population decline stemming from the departure of its major industries. It is presently a growing midsized city with a strong property tax base and a well-preserved historic business district local leaders see as an asset for the city’s continued growth. While few new offices have been built downtown in recent years, residential deliveries in the area have grown despite the COVID-19 pandemic. Three marquee projects—the conversion of the Nissen Building in 2003, the R.J. Reynolds Building in 2016, and the Wachovia Bank and Trust Building in 2023—have proven the viability of office-to-residential conversions in contributing to ongoing revitalization efforts.
These efforts have benefited from centralized oversight and a commitment to achieving preservation through walkable, mixed-use development that encourages residential use. However, the availability of industrial buildings for adaptive reuse (supported by strong state tax credits) has caused some to question the need for office-to-residential conversions. Further financial tools (some presently being considered by local authorities) may be necessary to spur further conversions.
Winston-Salem history and context
Modern Winston-Salem was created in 1913 by the merger of the colonial-era Moravian religious settlement of Salem and the Forsyth County seat of Winston—two towns known for their prominence in the cotton and tobacco industries.
Through the antebellum period, Salem industrialized through the textile and mill industry, with the Hanes company emerging as a major employer. While the majority of workers and overall population were white, the Moravian church enslaved a number of African American people, with this number increasing until emancipation in 1863.
The arrival of the R.J. Reynolds Tobacco Company in 1874 and the Salem Branch Rail Line from Greensboro in 1873 helped usher in rapid economic and population growth, though prosperity was inequitably distributed. The tobacco industry’s success was based on the labor of Black workers living in subpar housing conditions to the east side of the city—a spatial and economic divide that persists.
By 1890, Winston was the wealthiest city in North Carolina, and by 1920, after the merger, Winston-Salem was the state’s largest city. The Wachovia Bank and Trust played a pivotal role in supporting the city’s growth, and would go on to become the Southeast’s largest bank. Downtown emerged as the heart of the tobacco industry, with factories, warehouses, and commercial buildings. Hometown titans such as R.J. Reynolds, Wachovia, and Nissen built prominent headquarters that still define Winston-Salem’s cityscape, and now have a new life as luxury rental properties.
The mid-20th century witnessed the redevelopment of downtown and urban renewal projects that revitalized neighborhoods left empty by white flight, while demolishing Black neighborhoods. The 1957 construction of U.S. Highway 52, running north-south just east of downtown, decimated Black neighborhoods and historical landmarks, further physically isolating East Winston from the rest of the city. Today, households in East Winston tend to have higher poverty rates and lower rates of homeownership compared to Winston-Salem as a whole and Forsyth County.
The 1980s ushered in economic challenges with the relocation or loss of local control over major corporations, some of which had helped build the city. The Sara Lee Corporation’s purchase of Hanes in 1979 preceded a string of consolidations and closures. Research highlighting the adverse health effects of cigarettes and increasing competition threatened Winston-Salem’s tobacco industry. Following failed attempts to establish a modern higher-tech factory—“Tobaccoville”—outside of downtown, the Reynolds Company relocated to Atlanta in 1987 and closed the last of its Winston-Salem downtown offices by 1990. In 2001, Wachovia merged with Charlotte, N.C.-based First Union Bank, and was later absorbed by Wells Fargo following the 2008 financial crisis.
These disruptions created a renewed focus on diversifying the local economy and downtown land use. Downtown property is only 3% of the city’s property tax base, and both commercial and residential property are taxed at the same rate. The city has never pursued a strategy of capturing the value of jobs and commercial activity through direct property taxes. Economic development in the central business district and adjacent neighborhoods is instead about maintaining their attractiveness and competitiveness as job and activity locations, which then strengthens the value of housing nearby, ultimately accruing to the city through a very strong residential tax base. Therefore, the fiscal case for investing in downtown—perhaps through converting offices into housing—is not just about rehabilitating that hyperlocal tax base, but rather the aggregate shared value of the whole city.
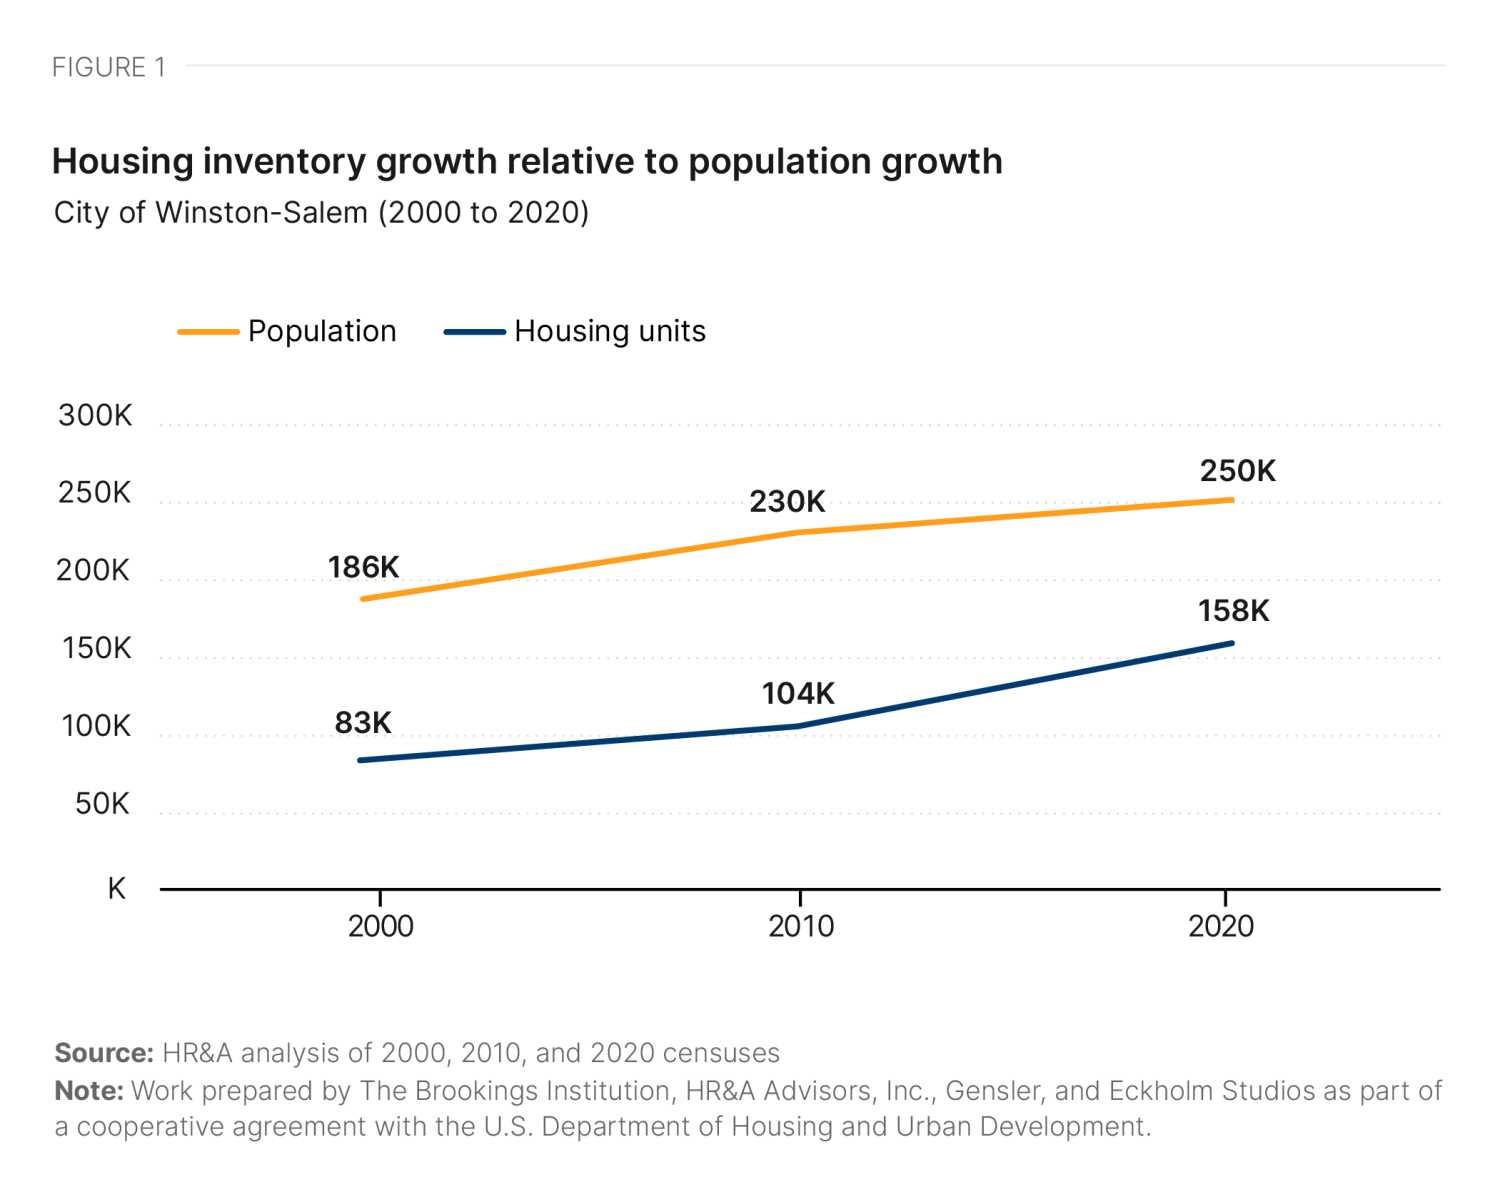
Over the last two decades, Winston-Salem added more housing units than residents, growing by 64,000 residents and 75,000 units, leading to a relatively increased availability of housing in the city (Figure 1). Winston-Salem has seen particular success spurring the conversion of its historic manufacturing and office assets into housing. Coming out of the pandemic, in 2023, the city council adopted a new downtown plan that highlights residential development as the top success of the last 10 years and identifies growth of affordable and for-sale housing options downtown as key elements of the plan’s strategic framework.
Downtown footprint and demand
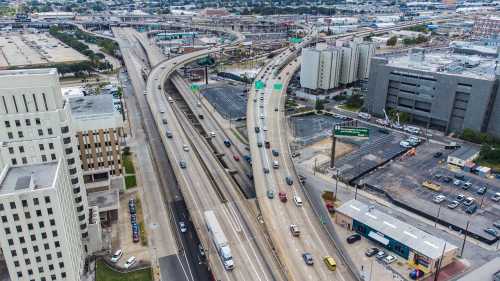
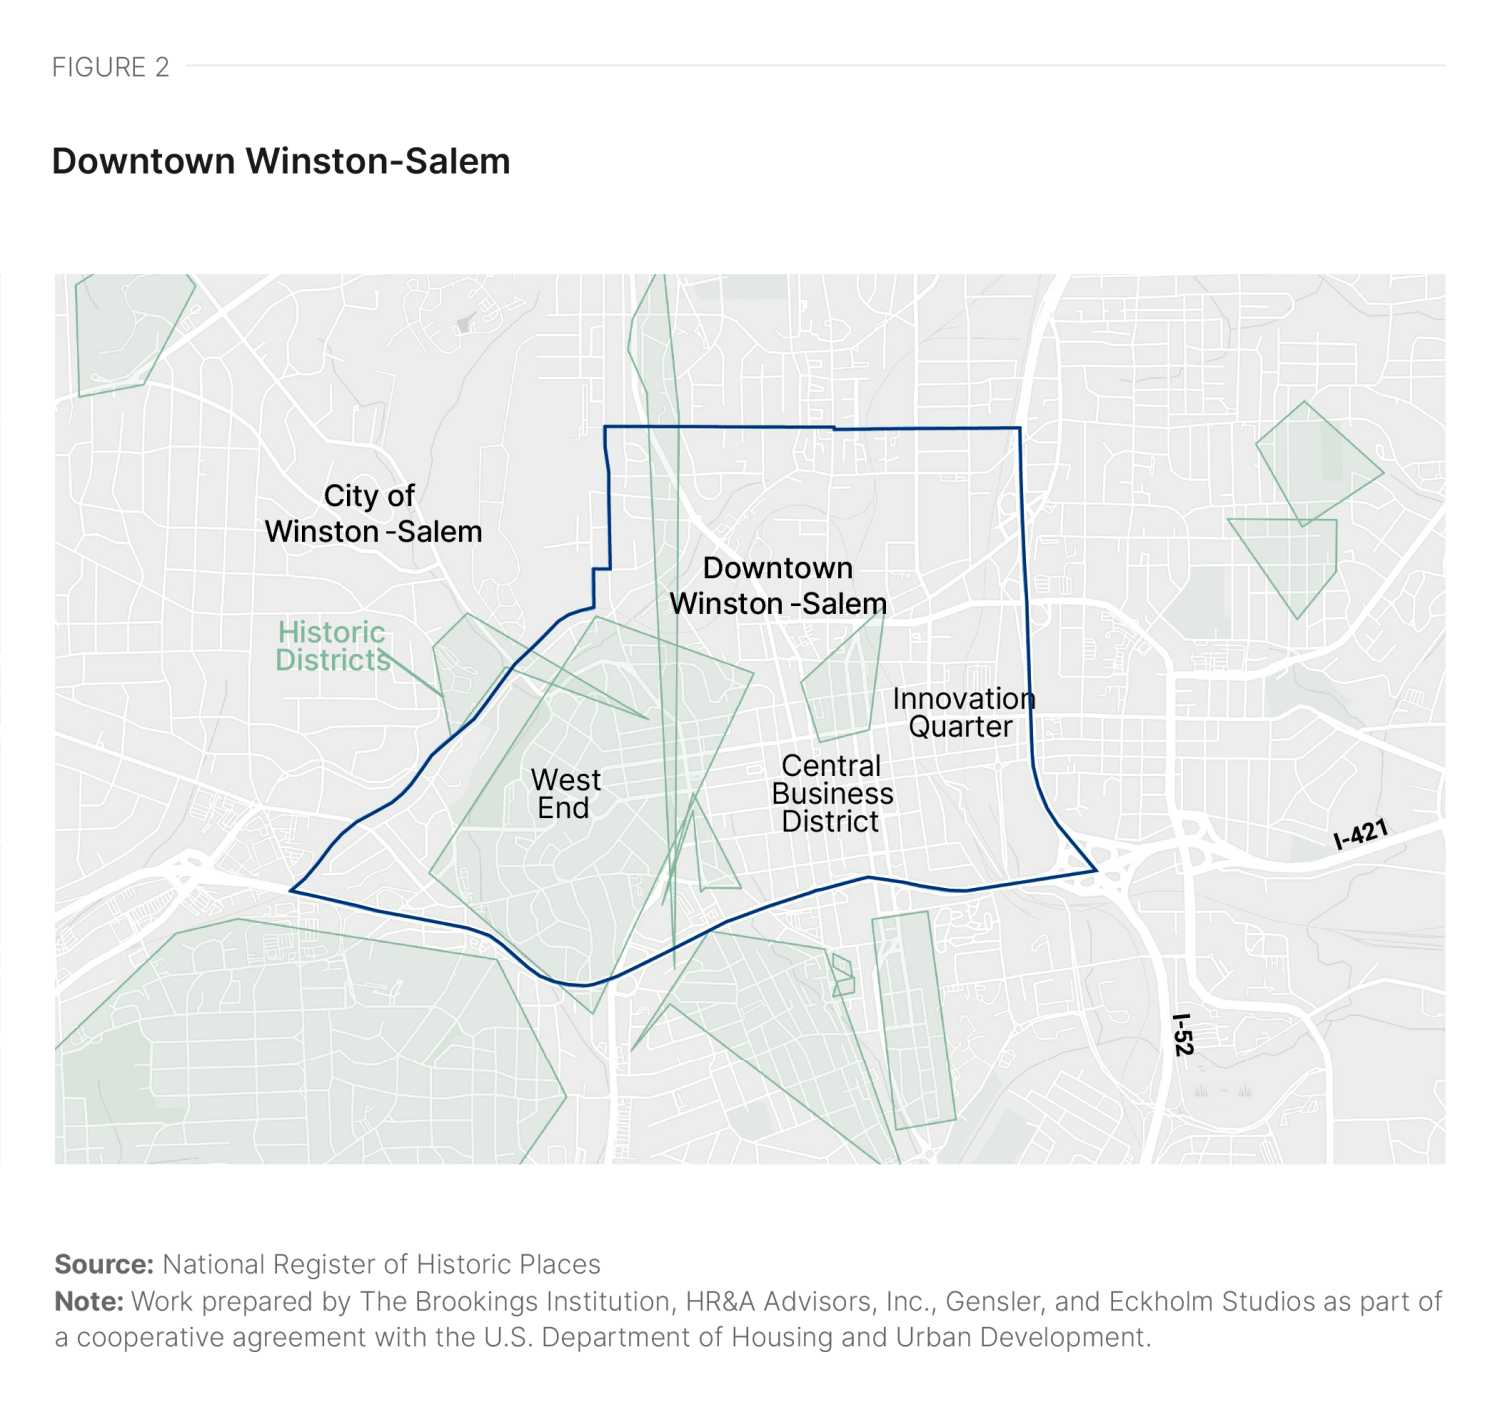
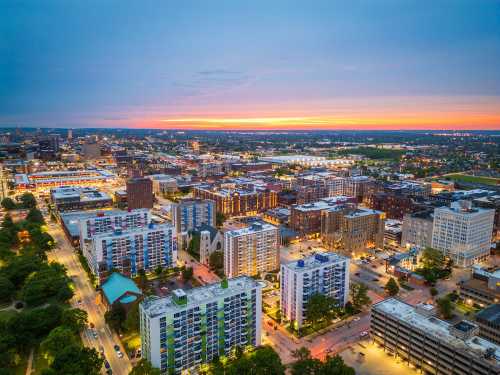
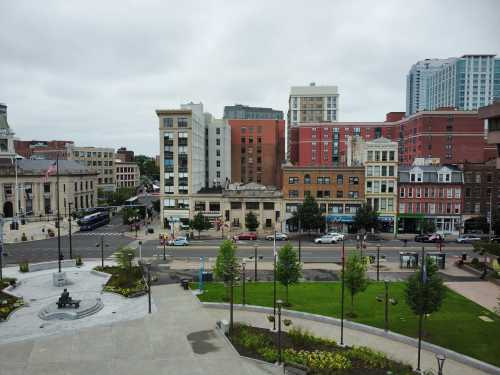
Downtown Winston-Salem covers a 2.25-square-mile area northwest of the interchange between Interstate Routes 421 and 52 (Figure 2). Downtown’s high-rise central business district only takes up a few blocks within a quarter-mile radius, and is surrounded by and overlaps with several historic neighborhood districts listed on the National Register of Historic Places.
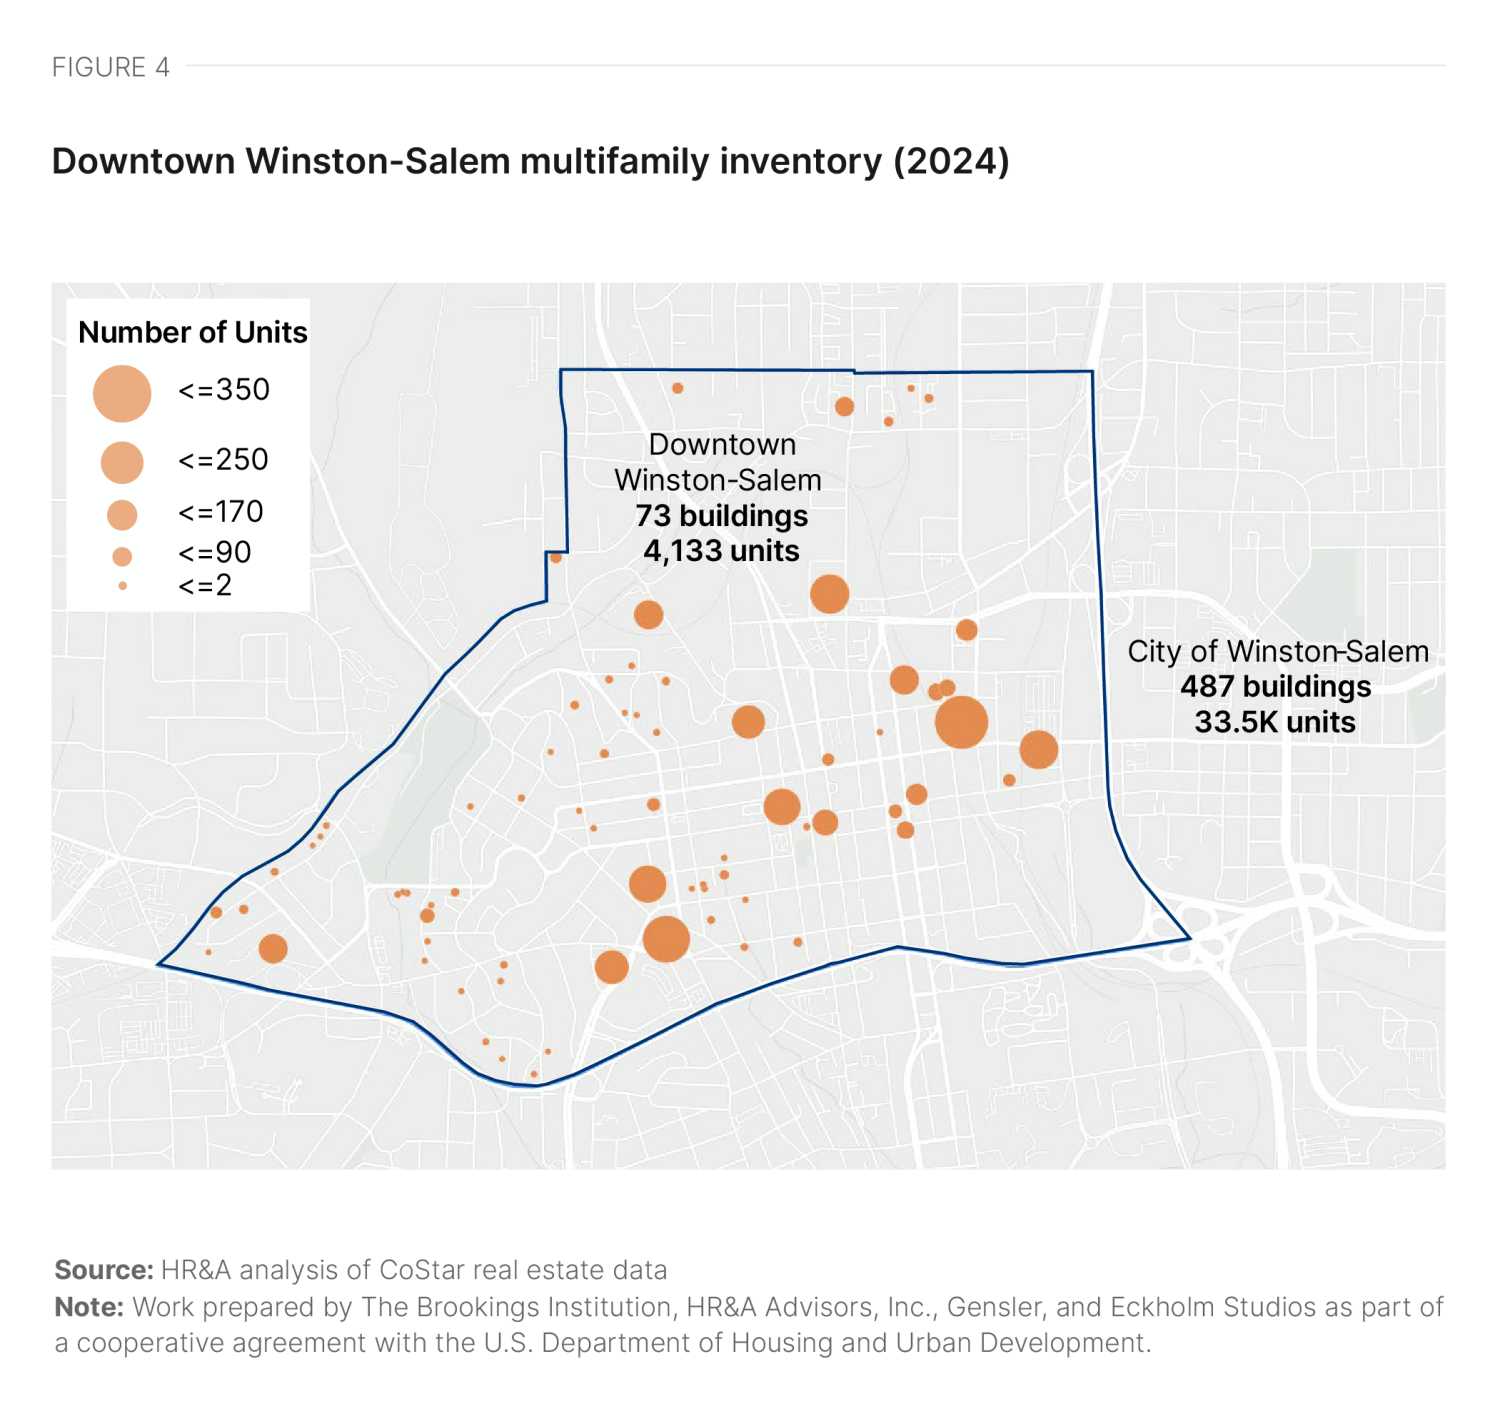
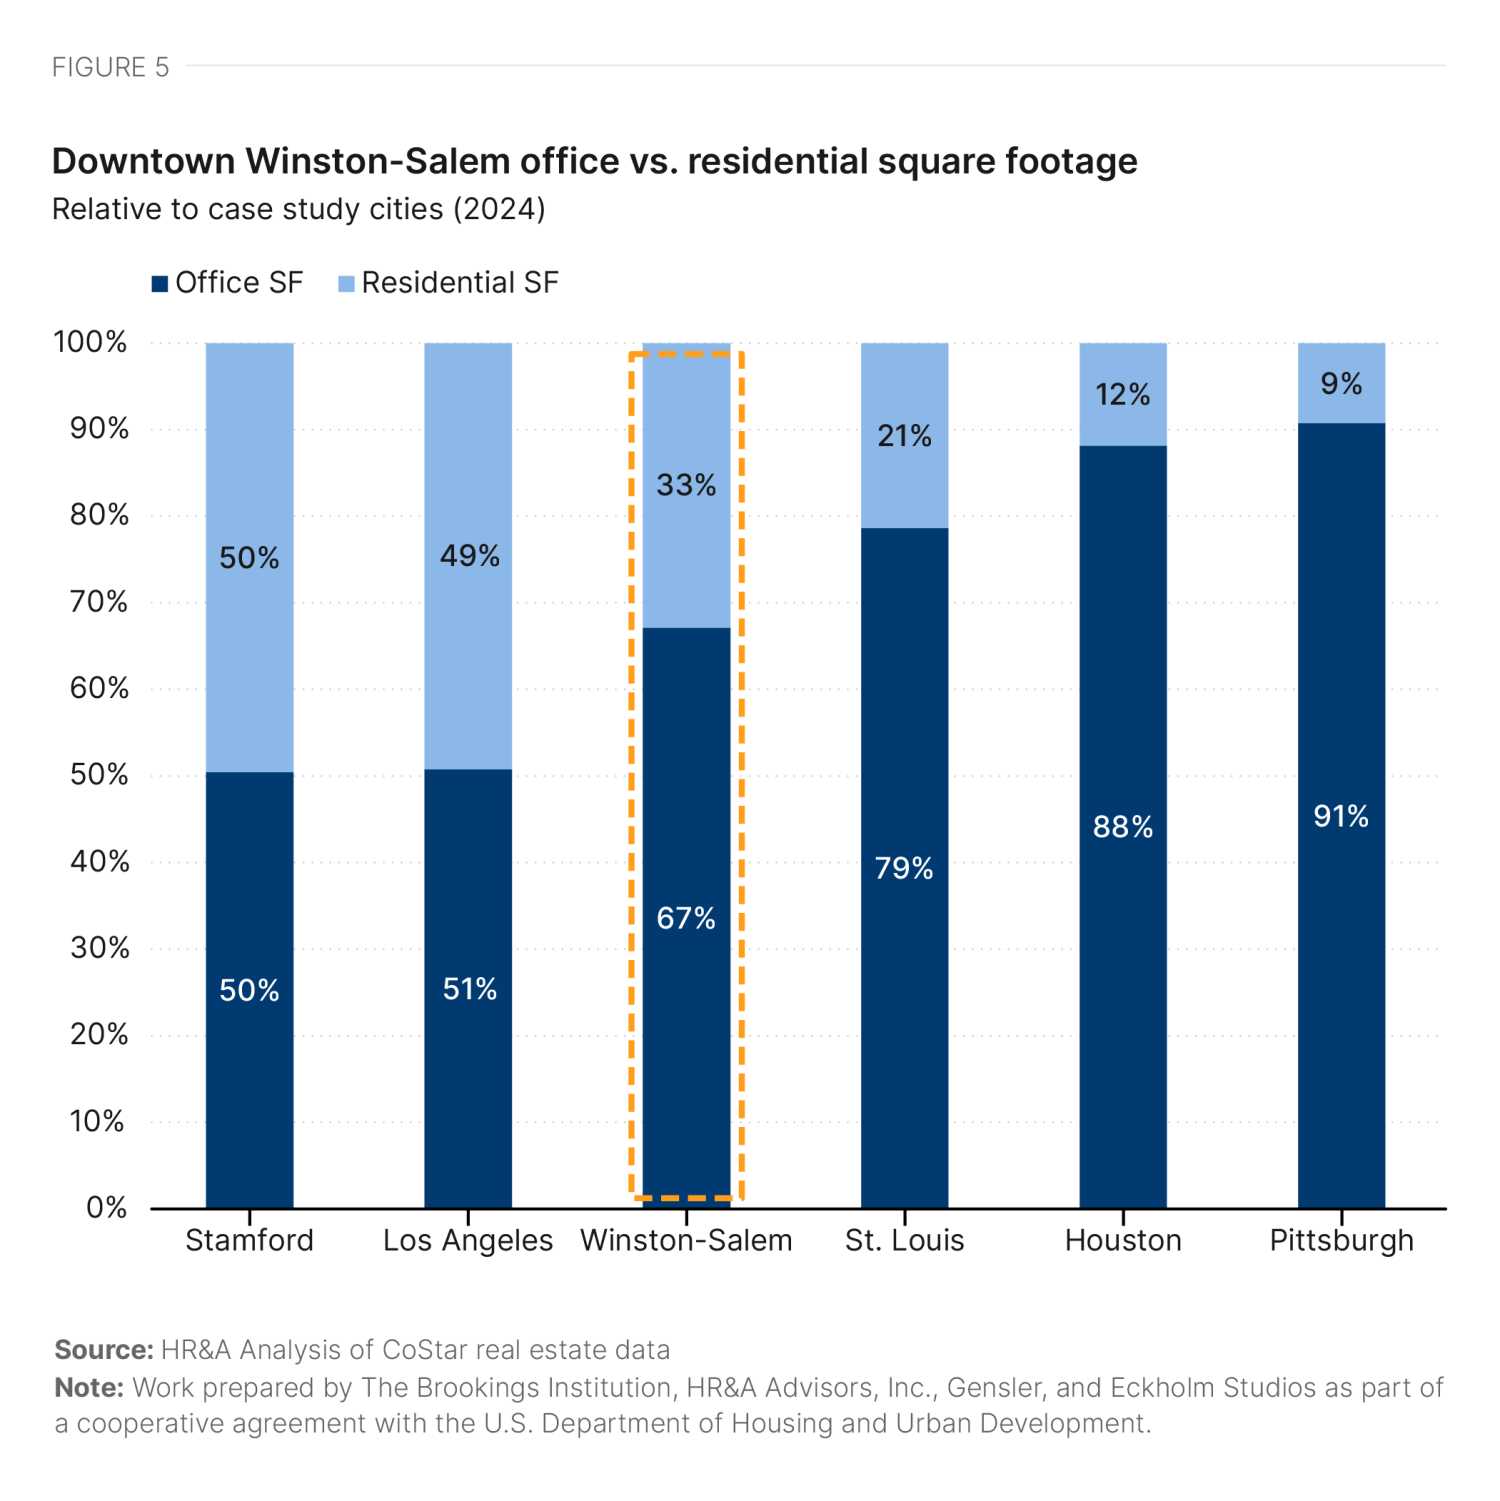
Downtown Winston-Salem contains 215 office buildings (Figure 3) and 73 multifamily buildings containing 4,133 units (Figure 4). Winston-Salem is less dominated by office space than many downtowns, with a roughly 2-1 ratio of office to multifamily square footage (Figure 5).
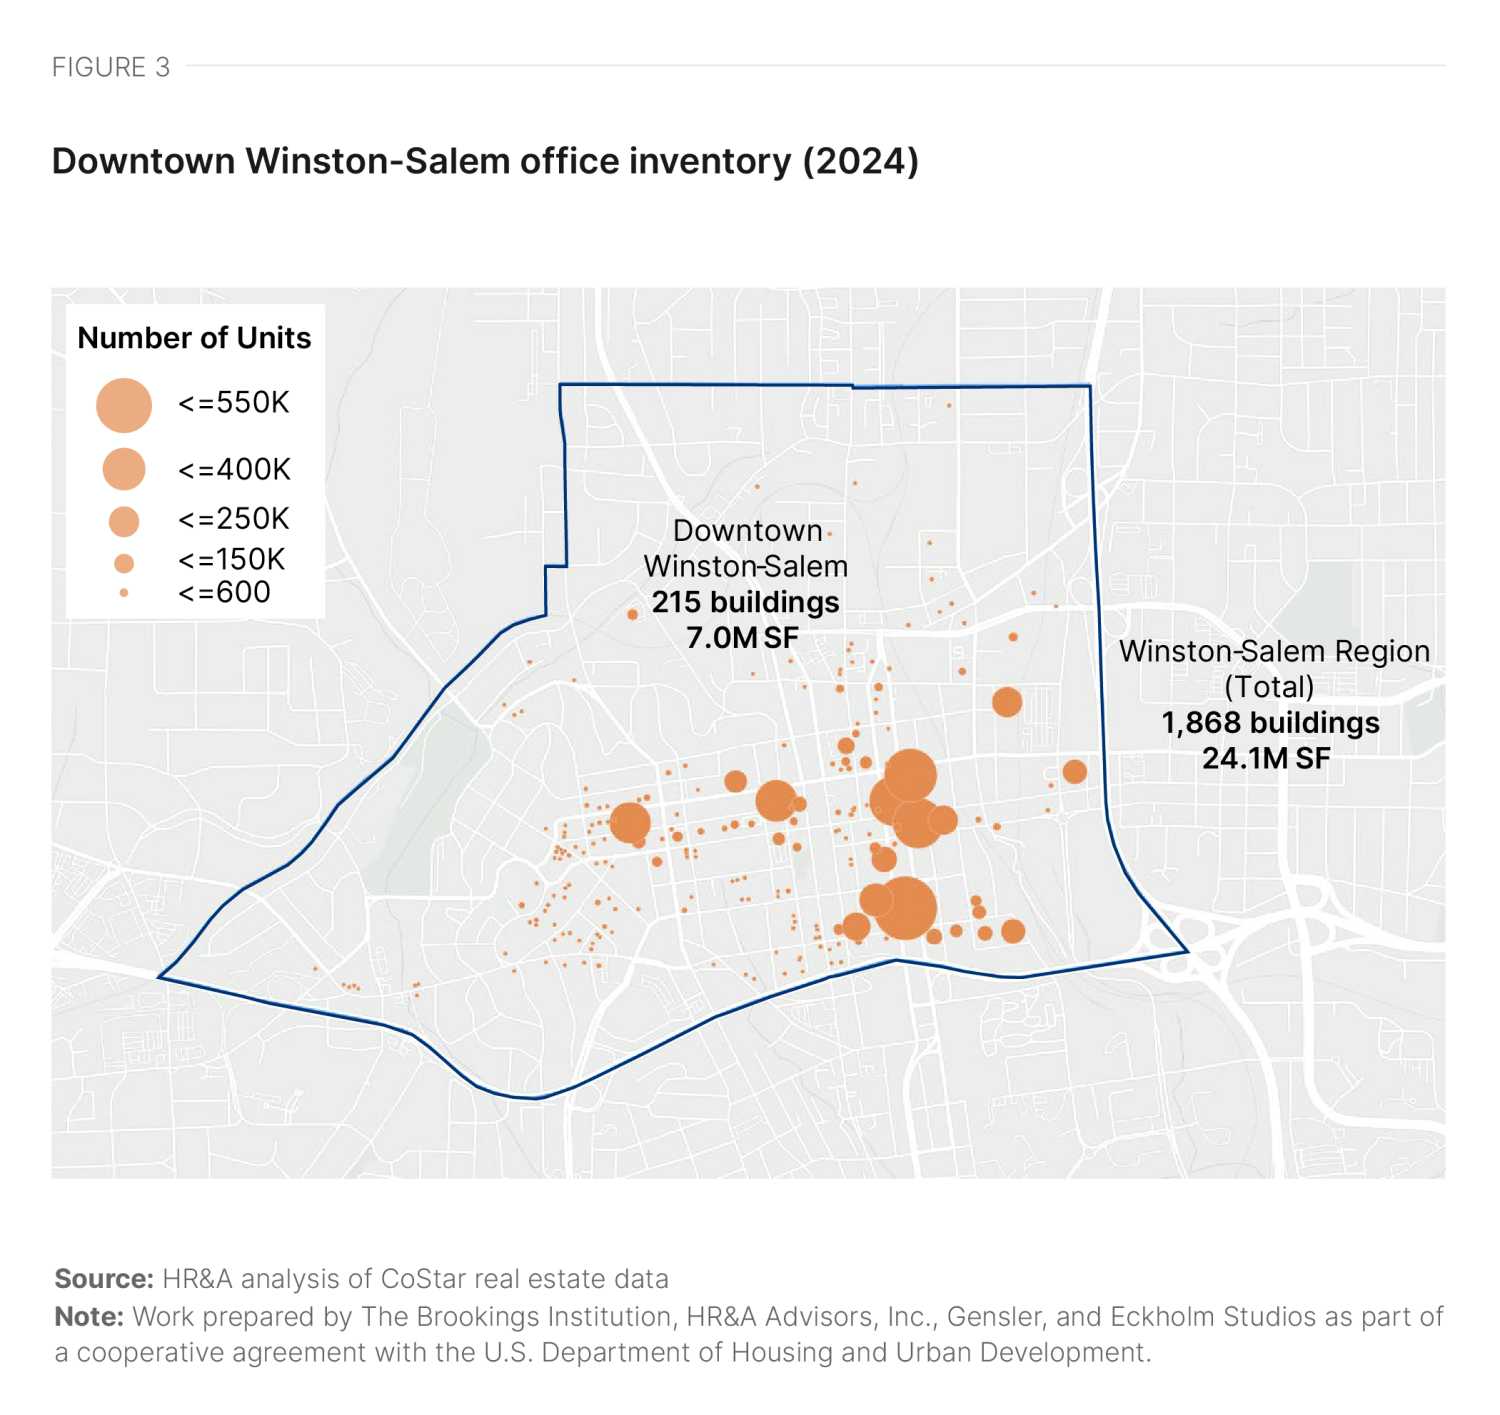
Reflecting the small size of the central business district and the datedness of the office stock, only seven buildings (or 3%) have been built within the last 15 years.1 Winston-Salem has seen almost no new office construction over the past decade, but it has experienced sporadic redevelopment activity in the Innovation Quarter with the repurposing of former warehouse and factory buildings as research and office space in the decades since Wake Forest University School of Medicine built its Department of Physiology and Pharmacology there in 1993.
Winston-Salem’s downtown multifamily residential market has seen much more new construction activity, with four deliveries adding 852 units between 2020 and the third quarter of 2024, and two more projects in the pipeline. Much of the existing multifamily inventory is located in older low-rise buildings in the West End Historic District west of Broad Street, with recent development occurring in higher-density areas in and adjacent to downtown’s high-rise central business district.
Office market conditions
Downtown Winston-Salem has a stable office market that has met demand over the past decade through its existing inventory. Its residential market has seen stable growth that was slightly accelerated by the pandemic.
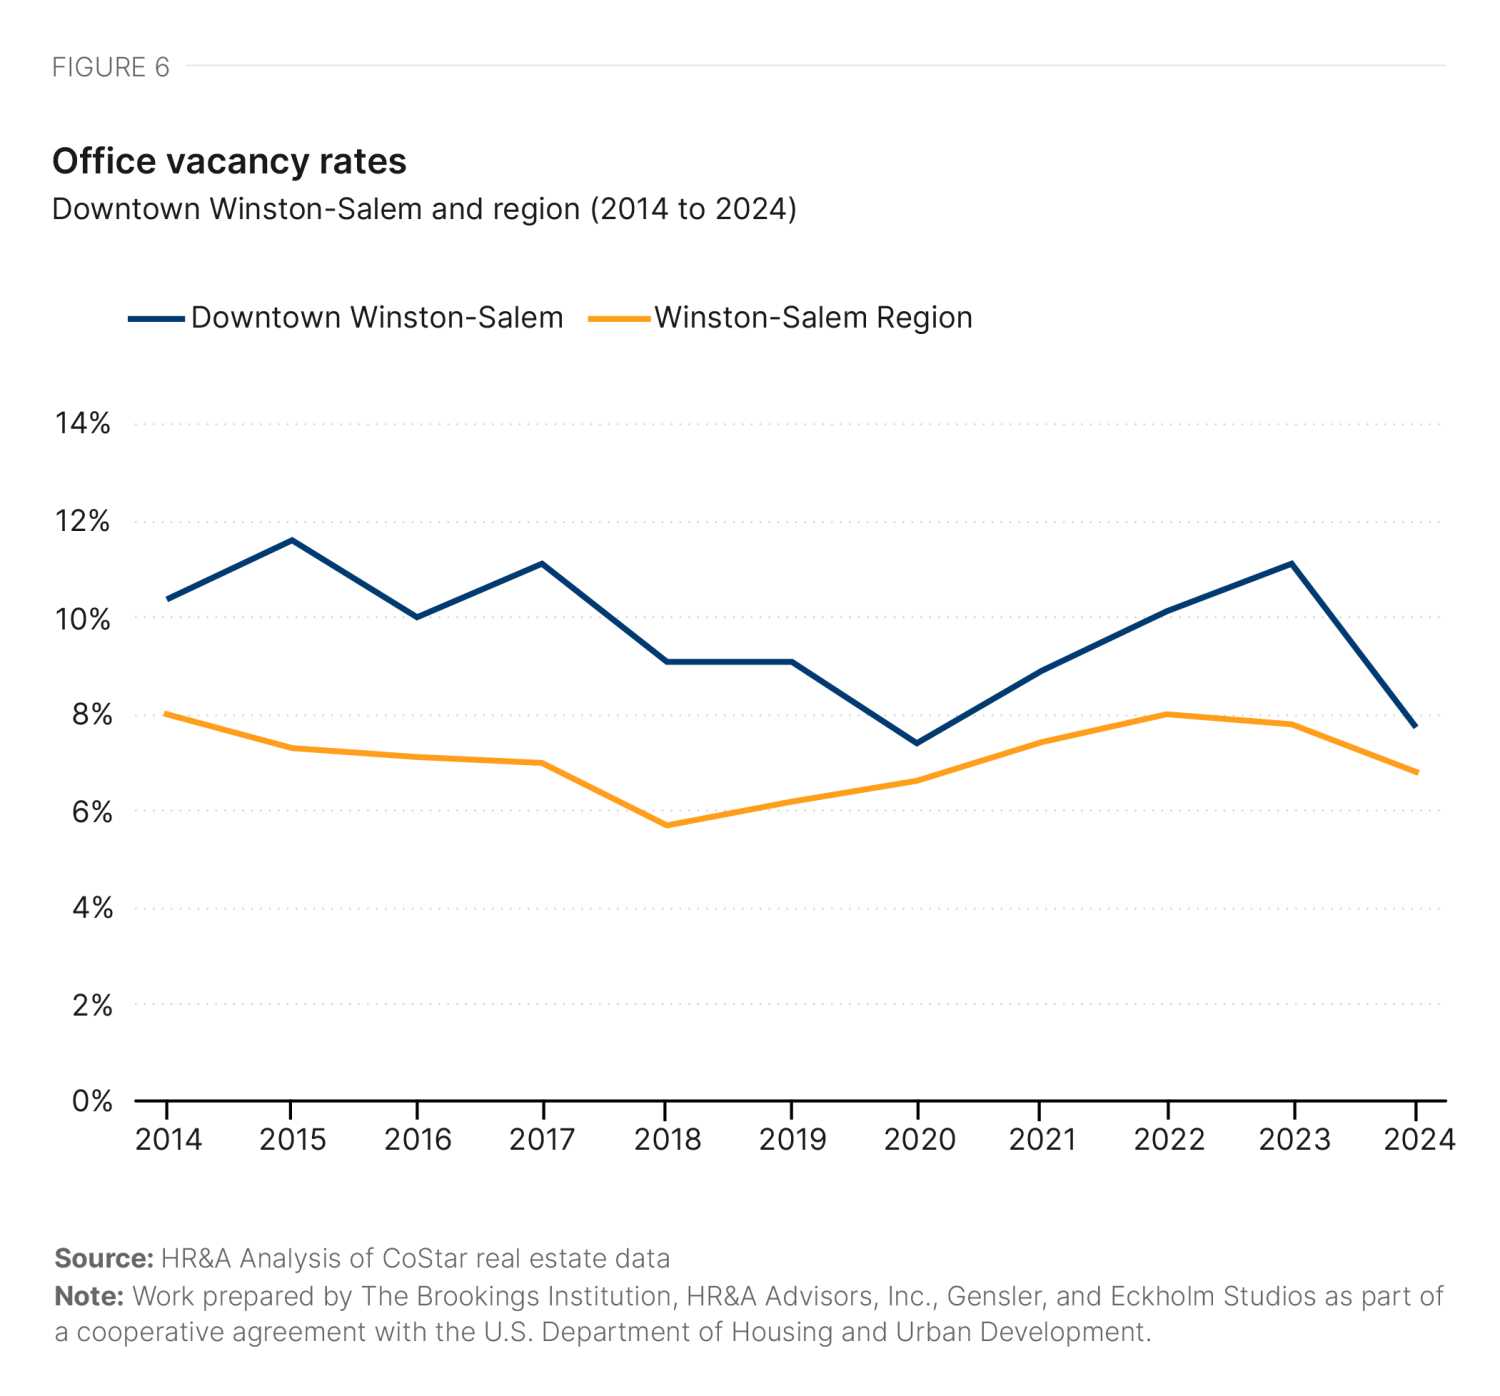
The small size of Winston-Salem’s office market makes its overall vacancy trends highly sensitive to changes in its largest office tenants.2 Between 2014 and 2019, Winston-Salem had an average downtown office vacancy rate of 10%. Following the onset of the pandemic, vacancy rates rose to a high of 11% before dropping to a near decade low of 8% in Q3 2024 due to major leases signed during the pandemic (Figure 6). This was well below the 19% national average office vacancy rate in the same quarter.
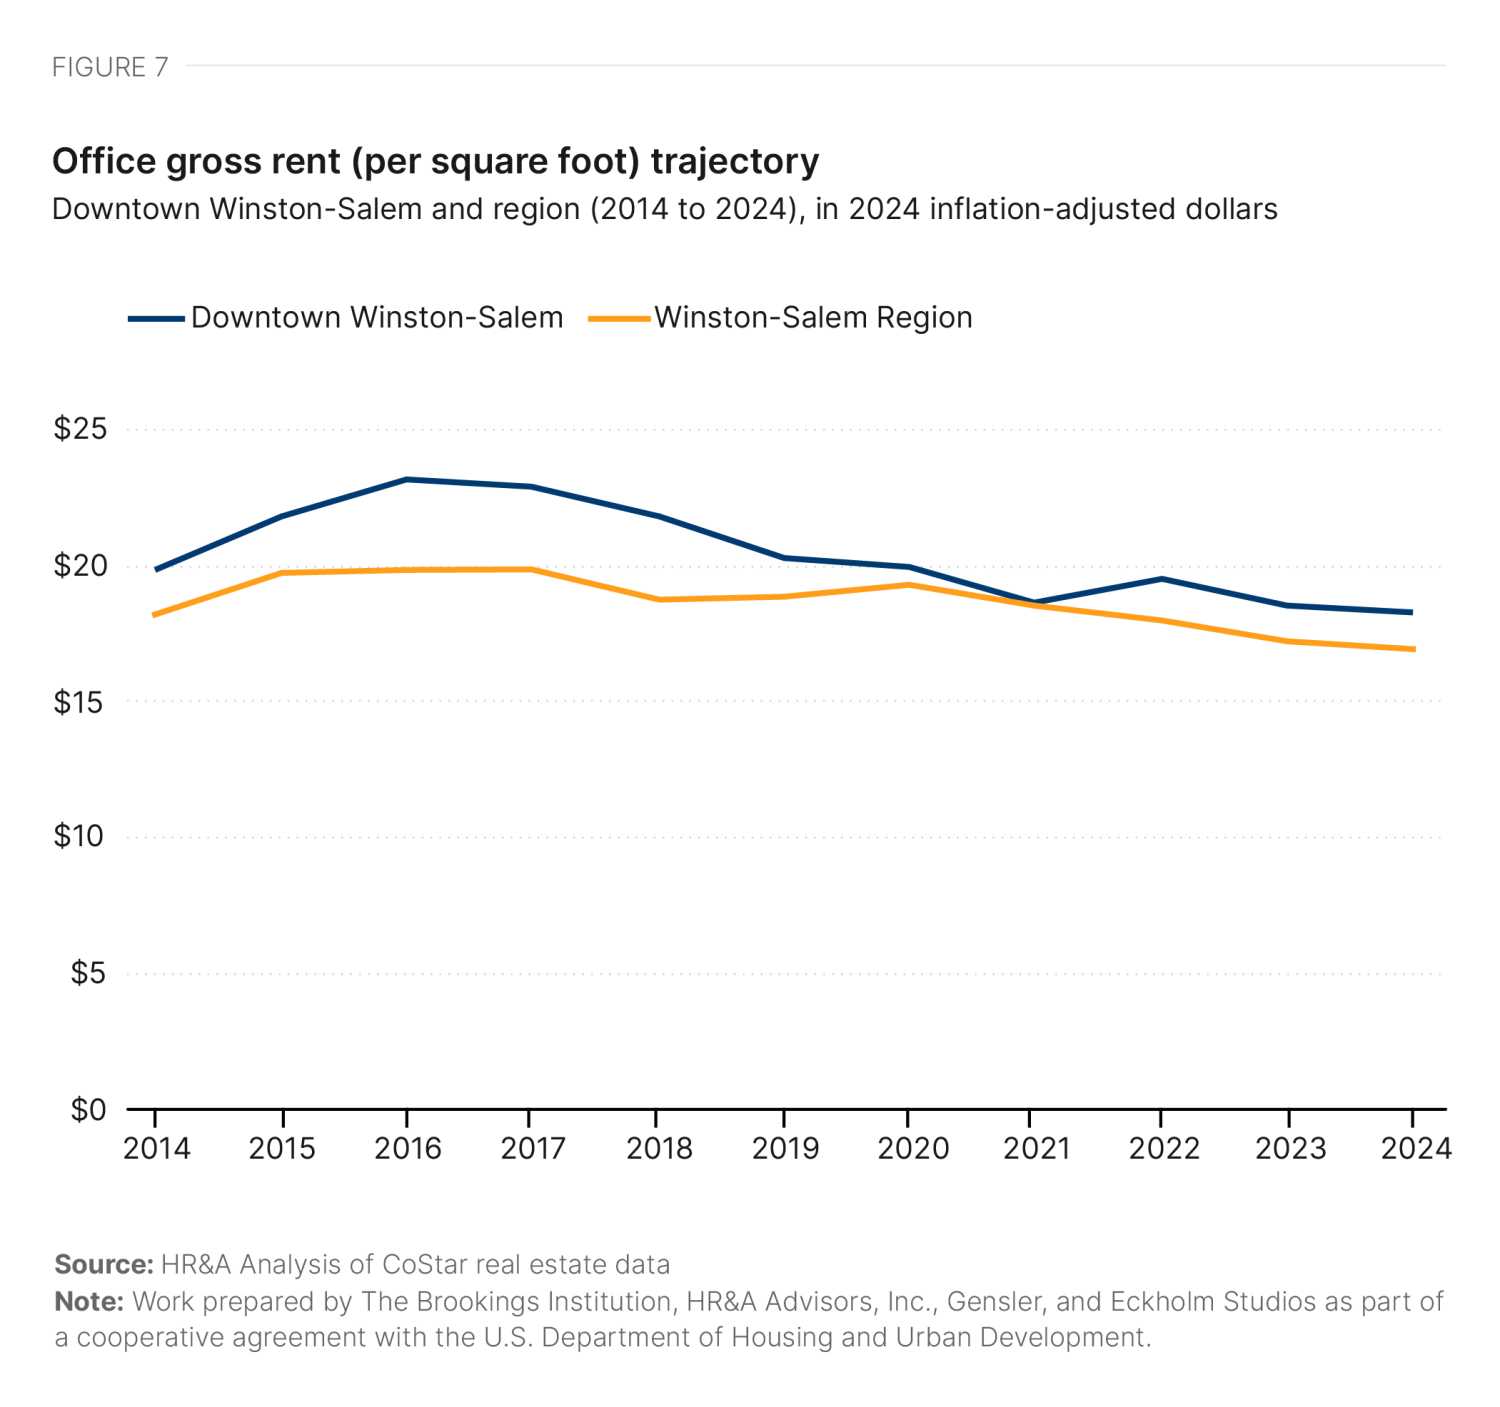
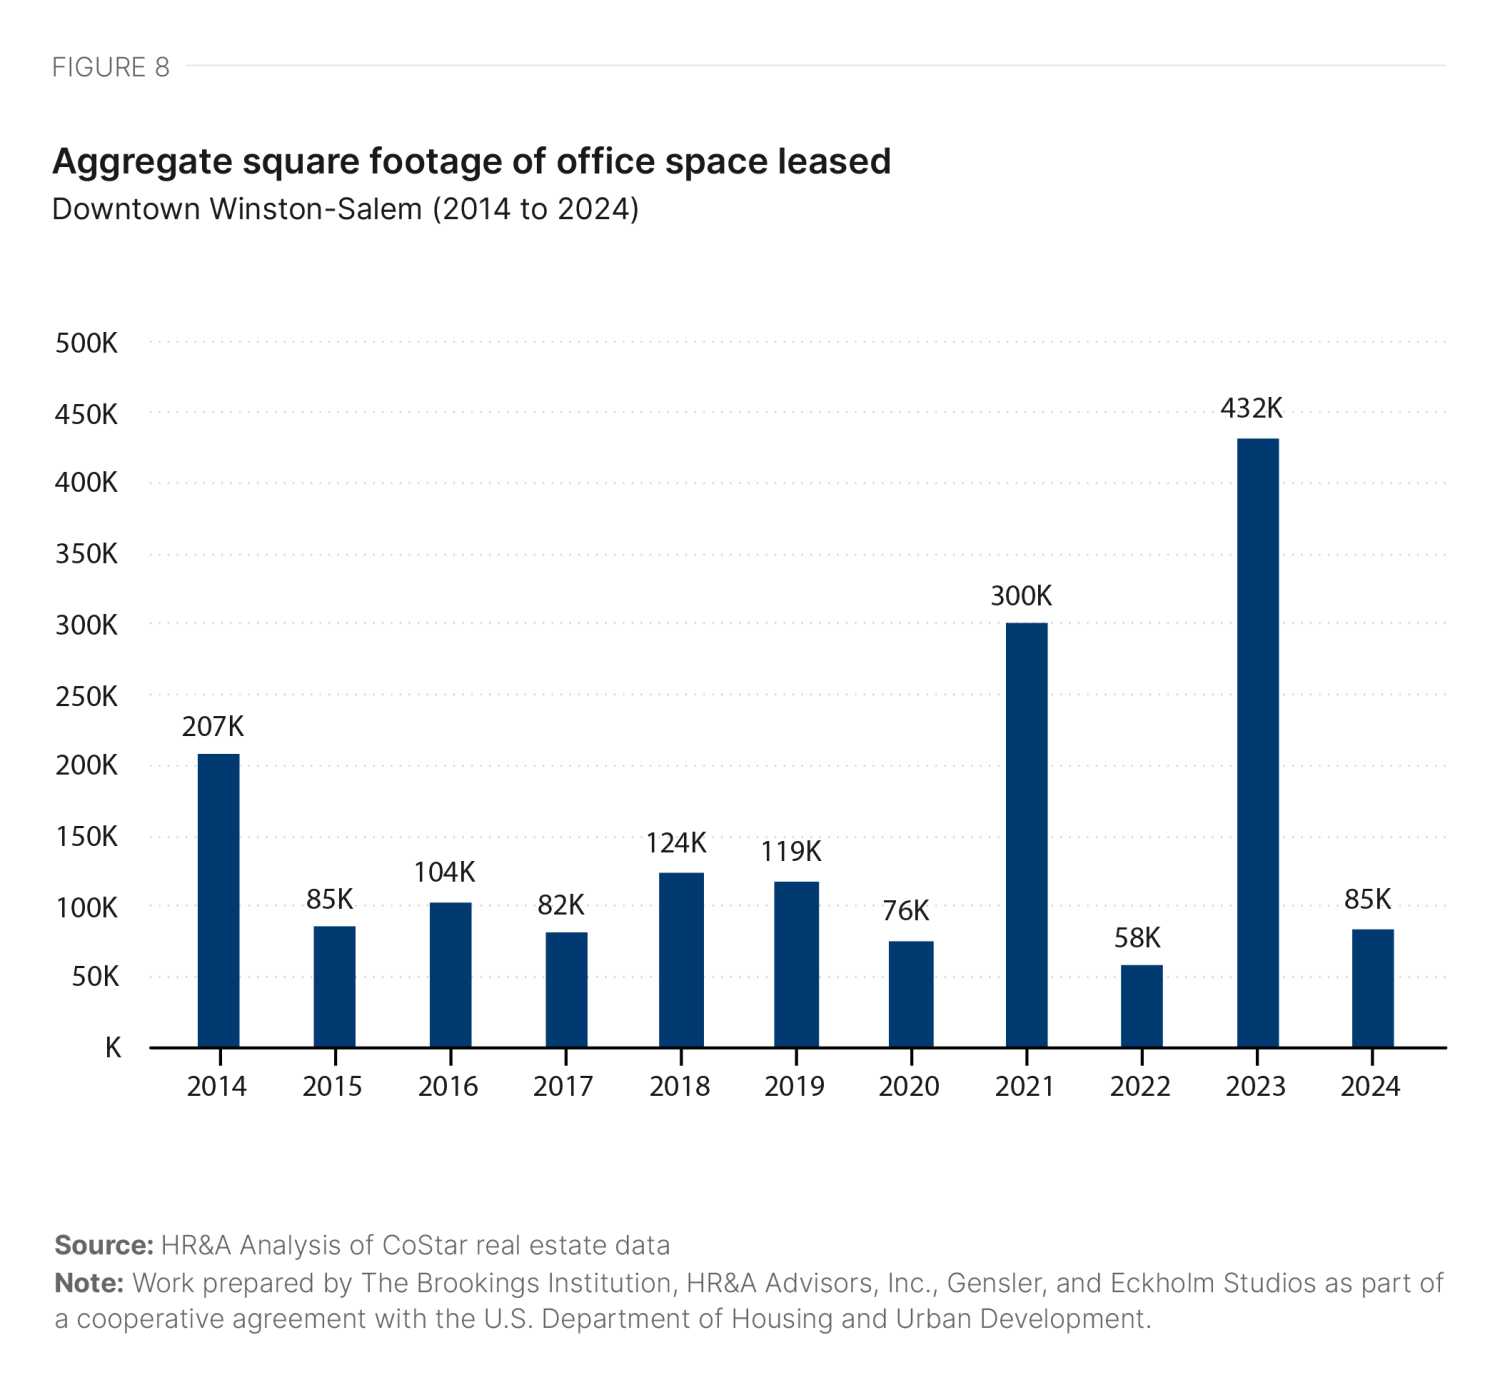
Downtown rents have seen slow to negative growth since their peak in 2016, which in inflation-adjusted terms has translated to a 21% decrease in rents from 2016 to 2024 (Figure 7). Unlike other case study markets, Winston-Salem experienced an increase in average annual leasing activity following the pandemic: The market leased an average of 120,000 square feet per year from 2014 to 2019, while four larger-than-average leases signed in 2021 and 2023 brought the 2021-23 average up to 263,000 square feet per year (Figure 8). As large corporate tenants in Winston-Salem continue to shift, the impact this will have on downtown vacancy is uncertain.
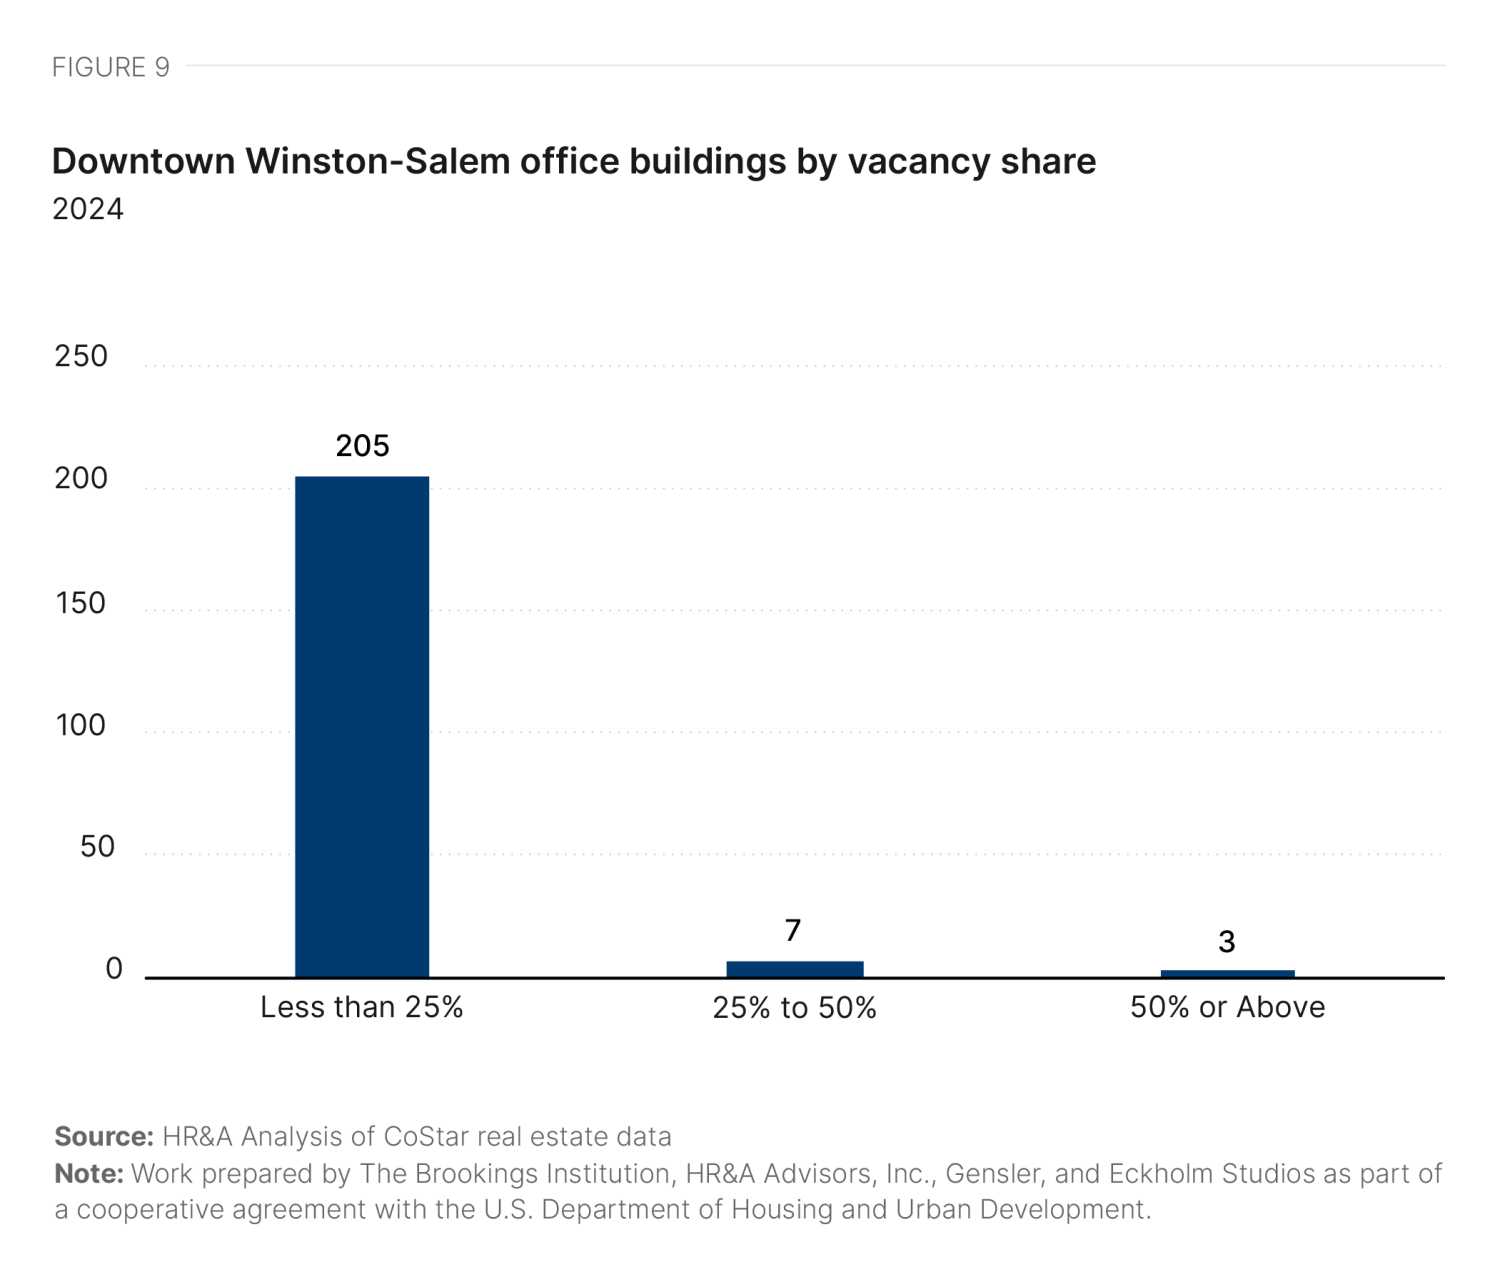
Fifty-five percent of all vacant space downtown is located across three large buildings that are each more than 25% vacant: 1 W. Fourth St.; 801 W. Fourth St.; and 102 W. Third St. Of these, 1 W. Fourth St. alone accounts for 31% of all vacant downtown space.3 Overall, only 10 of the 215 office buildings in downtown Winston-Salem have a vacancy rate above 25% (Figure 9), seven of which are small buildings with a rentable building area of less than 40,000 square feet.4 These metrics underscore a downtown office market that is stable, but has shown little significant growth.
Residential market conditions
Winston-Salem is a majority-homeowner city (54%), but the vast majority of downtown residents are renters (86%).5 The downtown population has a much higher share of young adults than the city as a whole, but has a comparable racial demographic composition. However, even at almost 3,000 housing units, downtown’s residential market share within the city remains very low (1.8%). Respondents highlighted an opportunity to create more units that are right-sized for families, attracting a more age-diverse demographic to Winston-Salem’s downtown.
We're not worried about saturation…The metric that I use, and more importantly, my bankers use, is that a healthy downtown, which Winston is, should be able to support 5% of the metro population…Winston-Salem metro is Forsyth County, which is 375,000, so that's 15,000-ish people downtown Winston should support. We're not at 5,000, so…we got a lot of upside, a lot of room for growth. We're not going to hit 15,000 anytime soon.
A Winston-Salem stakeholder
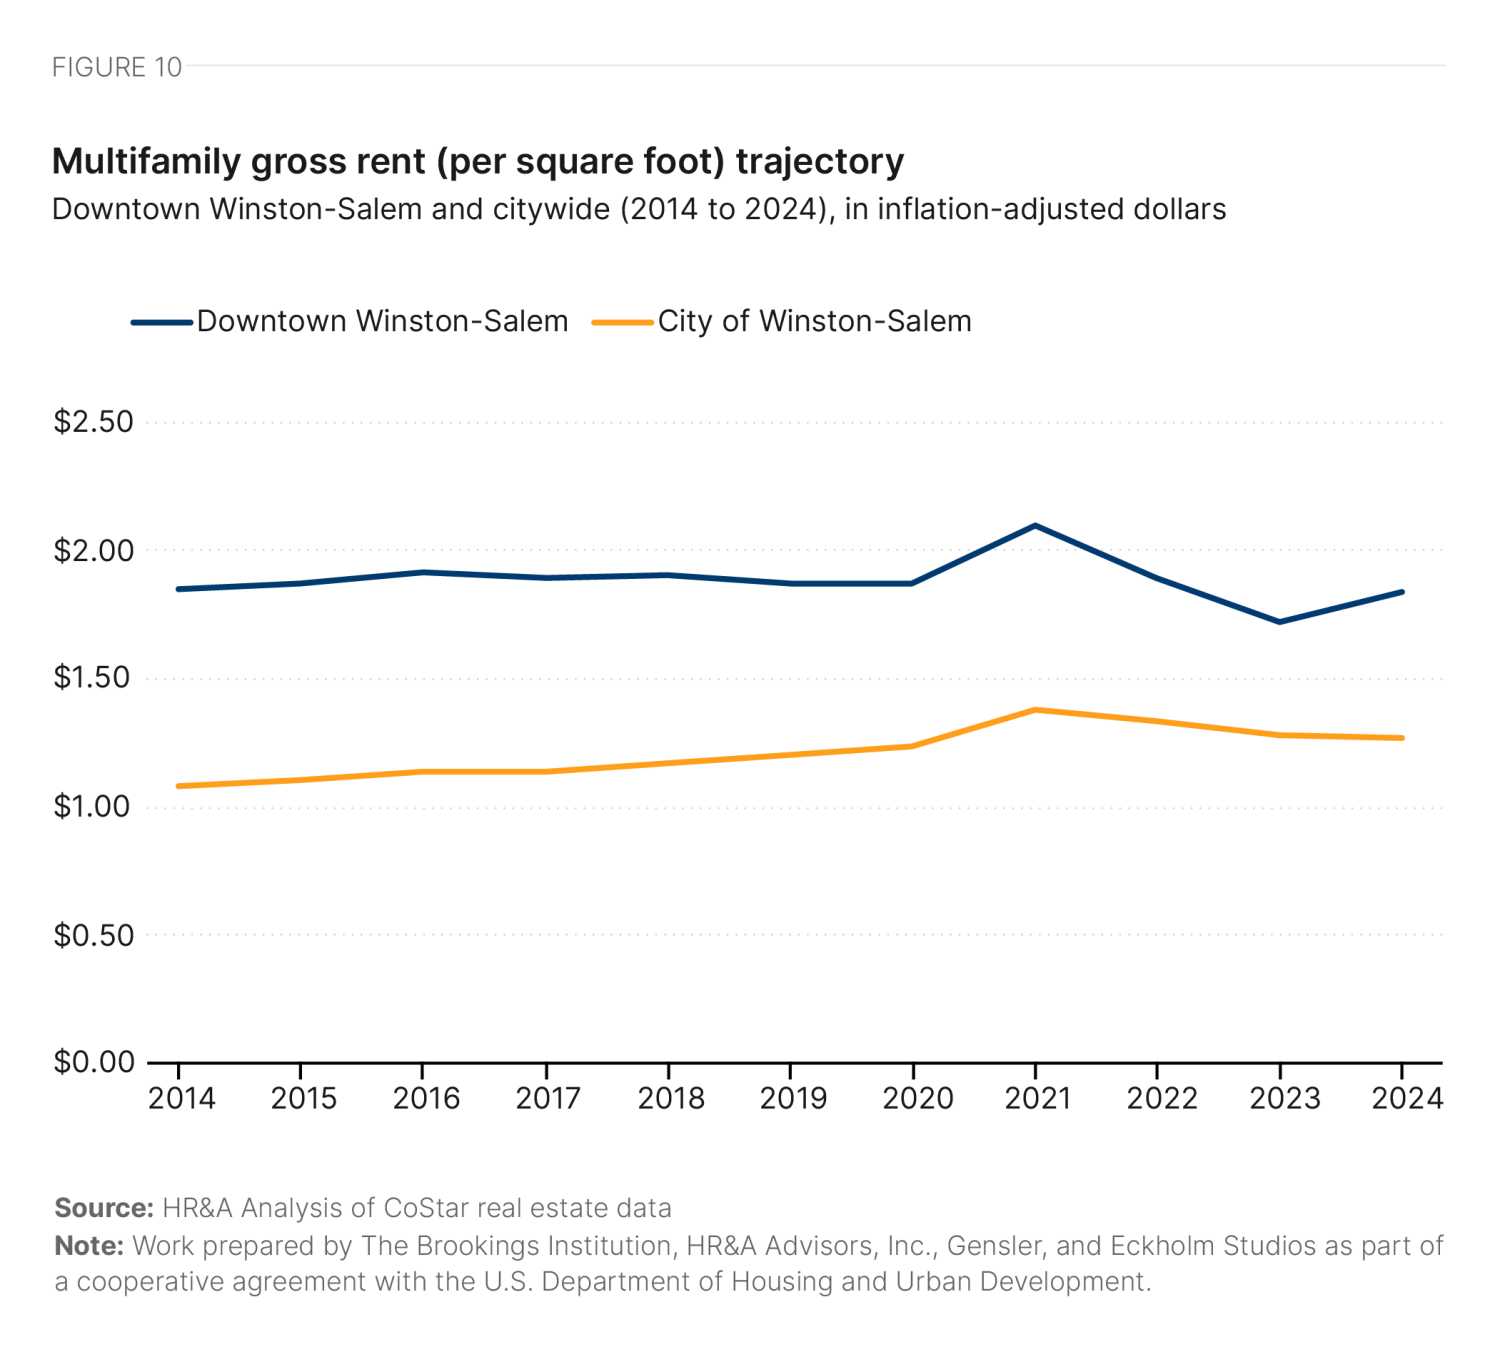
In 2024 inflation-adjusted terms, rents in downtown Winston-Salem held nearly constant at an average of $1.89 per square foot, reflecting rent growth in line with inflation (Figure 10). Nominal rents increased to $2.10 in 2021, but have since decreased, stabilizing at a similar level to the preceding average of $1.84 in 2024. Units throughout downtown are often affordable, with 35% of units affordable to households earning 50% of the 2022 area median income (AMI) (Figure 11, Table 1).6


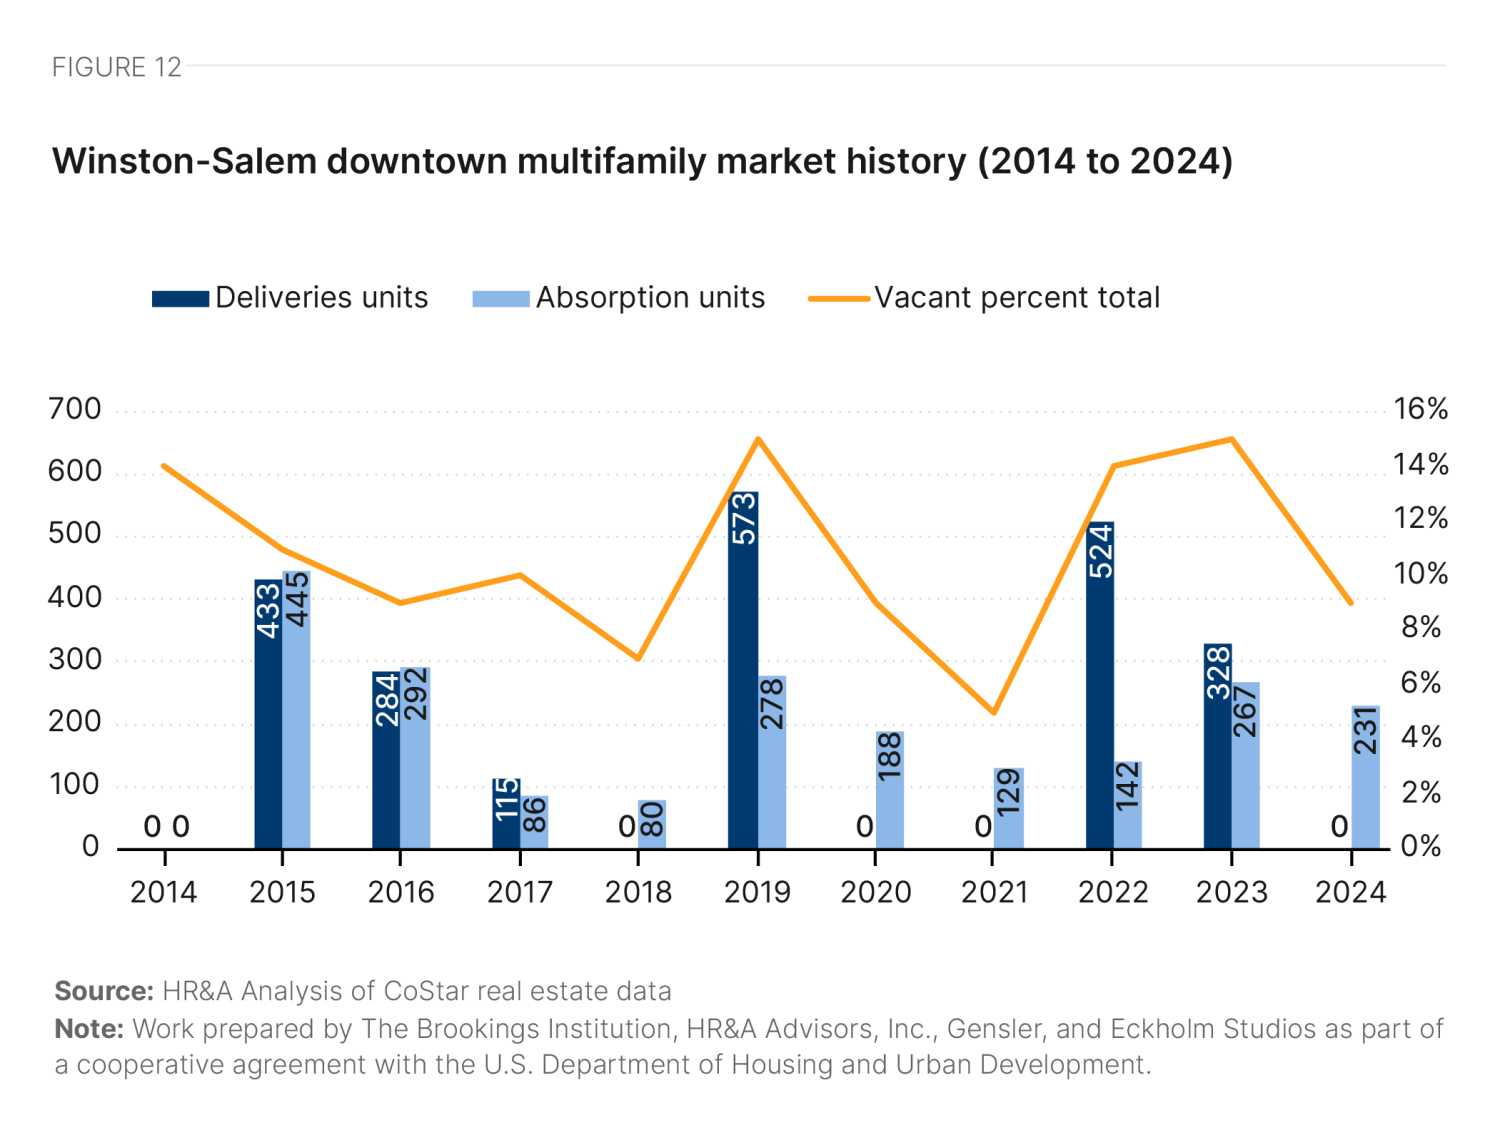
The average multifamily vacancy rate for downtown Winston-Salem trends toward the citywide average, but is often significantly higher after new buildings are delivered and leased up.7 Recent deliveries in downtown have often outpaced annual absorption and take multiple years for the market to fully absorb (Figure 12).
Winston-Salem is more diverse than North Carolina as a whole, with 49% nonwhite residents relative to just 35% statewide. Downtown Winston-Salem is slightly less diverse than the city as a whole, with 43% nonwhite residents. While demographics generally reflect citywide proportions, downtown Winston-Salem has a significantly lower proportion of Latino or Hispanic residents, at just 5% compared to 17% citywide and 10% statewide. The city of Winston-Salem and downtown also have a higher poverty rate than the statewide rate of 13.2%; the citywide poverty rate is 18.3% and downtown is 20.4% (Table 2). The relatively higher poverty rate downtown may be attributed to the proportionally higher number of renters relative to the city.
|
Submarket |
Citywide |
Statewide |
|||
|---|---|---|---|---|---|
|
Total population |
|||||
|
White alone population share |
57.1% |
51.0% |
65.0% |
||
|
Black alone population share |
29.1% |
33.2% |
20.9% |
||
|
Other share (anything other than white or Black alone) |
13.7% |
15.7% |
14.1% |
||
|
Hispanic population share |
4.7% |
16.6% |
10.0% |
||
|
Population in housing units |
|||||
|
Poverty rate |
20.4% |
18.3% |
13.2% |
||
Source: Brookings analysis of American Community Survey 2022 5-year estimates
Note: Poverty rate used here is defined as the share of people in housing units. Work prepared by The Brookings Institution, HR&A Advisors, Inc., Gensler, and Eckholm Studios as part of a cooperative agreement with the U.S. Department of Housing and Urban Development.
Political, policy, and financial conditions
Like most small to midsized cities and towns in North Carolina, Winston-Salem operates under a council-manager form of government. The professional city manager is the chief administrative officer of the city. Winston-Salem has eight city council members elected from wards. The mayor is the only citywide elected official, serving as the president of the council and voting only to break ties. The elected roles are not considered or compensated as full-time jobs. In the case of Winston-Salem, in fact, the current mayor has served in that office since 2002, and during that same tenure was the president of the Winston-Salem Alliance, the city’s business league for economic development.
In spring 2024, Greater Winston-Salem Inc, the regional chamber of commerce, absorbed the mission and programs of the Winston-Salem Alliance. In addition to this regional group, Winston-Salem is also within the larger regional area of the Piedmont Triad Partnership, which is a federally designated free-trade zone. Downtown Winston-Salem continues to be served by another business membership group, the Downtown Winston-Salem Partnership, which among many activities administers a revolving loan fund for downtown storefront startups and delivers the services contract for the city’s business improvement district.
The city and county share a joint planning board that is unique in North Carolina (though not nationally). All rezoning proposals must go to the planning board and then to the city council—a process that typically takes about two months.
We have one of the most streamlined rezoning processes in the state.
A Winston-Salem stakeholder
In addition to his dual role with the Winston-Salem Alliance, prior to public office, Mayor Allen Joines also served as deputy city manager and director of the planning department. Thus, through Mayor Joines, Winston-Salem has had an integrated and aligned approach to development for over two decades across what are more typically silos in many cities.
Adaptive reuse and office-to-residential conversion are long-established priorities of the city and the regional business community, primarily for economic development reasons. While a number of successful conversion projects have occurred over the last two decades, there remain numerous downtown assets that the city aims to convert in an effort to preserve historic buildings and bring more residents downtown, particularly to the central business district.
The city of Winston-Salem and the local business community are strong advocates for office-to-residential conversion. Top motivations cited for conversion include:
- Preserving downtown’s historic character through adaptive reuse.
- Bringing more residents into downtown to create a 24/7 neighborhood the whole region can enjoy.
- Generating new, attainable homeownership options.
Historic preservation is politically popular and familiar in Winston-Salem beyond the office context. The Old Salem area forms a Williamsburg-type experience within Salem: a well-preserved historic district that is full of people living and working there. In another example, the city has very carefully preserved and reoccupied the train station, even though Winston-Salem no longer has passenger rail service.
I think we've made a conscious decision that we want to keep our special character. It's not like we're being written up in Architectural Digest…But we like what we have, and it helps represent us.
A Winston-Salem stakeholder
Winston-Salem’s first downtown office conversion—the Nissen Building, which had become fully vacant in 2003—was funded with support from the business community and the city to catalyze the local conversion market. At the time, private financing for the project was unavailable because of a lack of comparable properties to support the assumptions of a pro forma financial model projecting rents for the completed project. The Winston-Salem Alliance began by funding a feasibility study for the conversion, which identified a $6.5 million gap on top of conventional financing in the capital stack to complete the project. The city of Winston-Salem then made a $3.5 million subordinate loan to the developer, and the Winston-Salem Alliance made another $3 million loan on even more favorable terms (no repayment until sale).
[Nissen] came online when the rental rates were about 110% of market rates here in Winston. We were pretty nervous about that. Obviously, it was the first really major downtown residential project…But it came online and it leased up…then had a waiting list after a few months. So it went extraordinarily well, and it set the tone for the rest of the downtown revitalization.
A Winston-Salem stakeholder
Since then, there have been four subsequent conversion projects, which have not required or received this type of gap financing. However, some developers remain skeptical that converting dated offices into housing is the right area of focus as the city expands. The city still has a plethora of room for ground-up development and old industrial facilities that could be converted into apartments. To encourage the next wave of office conversions, the city may need to re-examine the financial tools it makes available to projects.
Winston-Salem has gone to great lengths to create a policy environment that is conducive to residential development downtown, while preserving Winston-Salem’s historic character. In 2011, local real estate broker Jeff MacIntosh (who is now a councilmember representing part of downtown), served on an ad-hoc Development Review Advisory Committee that looked at all steps of the local development process, met with stakeholders, and conducted a peer review. The committee identified opportunities for improvement, many of which were more about culture than what was written in the zoning ordinance or building code. When interpreting codes that can be contradictory, vague, or subjective, in order to say “yes,” staff need to know that they are not going to get in trouble, which requires direction, commitment, and stability from leadership. This process and cultural shift received positive feedback.
Winston-Salem has one of the most progressive planning departments out there…If I were to put in an application, there are educated staff that will analyze the project with you.
A Winston-Salem stakeholder
In recent years, there has also been a push from the city council to adopt policies that will increase housing downtown and create a mixed-use environment. In 2017, the city undertook an assessment of the unified development ordinance (UDO), in part as a response to feedback that the UDO did not support the kind of walkable urban development called for in the city’s comprehensive plan and was a barrier to downtown revitalization. An updated UDOClearCode was adopted in 2020. Adaptive reuse in the “Central Business” zone is allowed by-right, and there are no parking minimums.
For my construction team, hands down, Winston-Salem is their favorite market in the country…Winston-Salem is very accommodating.
A Winston-Salem stakeholder
A 2018 housing needs assessment identified a 16,244-unit shortage of affordable housing in Winston-Salem, and noted that the city is growing faster in population than housing unit production. A subsequent study recommended that the city create a “Housing Trust Fund” to help finance affordable housing projects. In response, in 2023, the city council directed the city manager to create recommendations for how to set up and deploy such a fund. The council resolution identified American Rescue Plan Act funds and local philanthropy as possible sources of seed capital for the fund. The mayor and council continue to deliberate on the trust fund, and have not yet moved forward with a vote.
The housing trust fund would augment existing financing tools in Winston-Salem, covered in Table 3. The county has an abatement program for local historic landmarks and the state has a strong historic rehabilitation tax credit program, which office-to-residential conversion projects in downtown have accessed. In addition, there are two notable tools available for adaptive reuse of industrial buildings, but not offices: the state brownfield abatement and the mill rehabilitation tax credit. These programs, which represent approaches to helping local built environments adapt to a changing economy, could be used to keep pace with more recent economic shifts.
|
Type |
Name |
Details |
|
|---|---|---|---|
|
Tax abatement |
|||
|
Forsyth County Tax Assessor |
50% local property tax deferral, running in perpetuity unless integrity of property is lost |
||
|
North Carolina Department of Environmental Quality |
Five-year abatement |
||
|
Tax Credit |
|||
|
North Carolina State Historic Preservation Office |
State historic preservation tax credit for commercial rehabilitation |
15% to 25% state income tax credit that can be paired with 20% federal income tax credit for substantial rehab of income-producing structures listed in the National Register of Historic Places |
|
|
North Carolina Department of Revenue |
30% to 40% credit of rehab costs for income-producing mills or mill-related properties and 40% for non-income-producing mills or mill-related properties that are not eligible for federal income tax credit |
||
Note: Work prepared by The Brookings Institution, HR&A Advisors, Inc., Gensler, and Eckholm Studios as part of a cooperative agreement with the U.S. Department of Housing and Urban Development.
Past and future conversion activity
At least one office-to-residential conversion project has been completed since March 15, 2020, and at least one more is in the planning process (Figure 13).

The Residences at the R.J. Reynolds Building
The R.J. Reynolds building is an Art Deco skyscraper designed in 1929 by New York architectural firm Shreve and Lamb, which used it as a model for the Empire State Building. PMC Property Group—a national developer specializing in adaptive re-use—converted the property to 114 luxury rental units and a ~100 key Kimpton hotel in 2016. Table 4 describes the converted building, and Table 5 summarizes the conversion process financing. The building is heavily amenitized, including a basketball court and bowling alley, which make use of some of the windowless interior space.
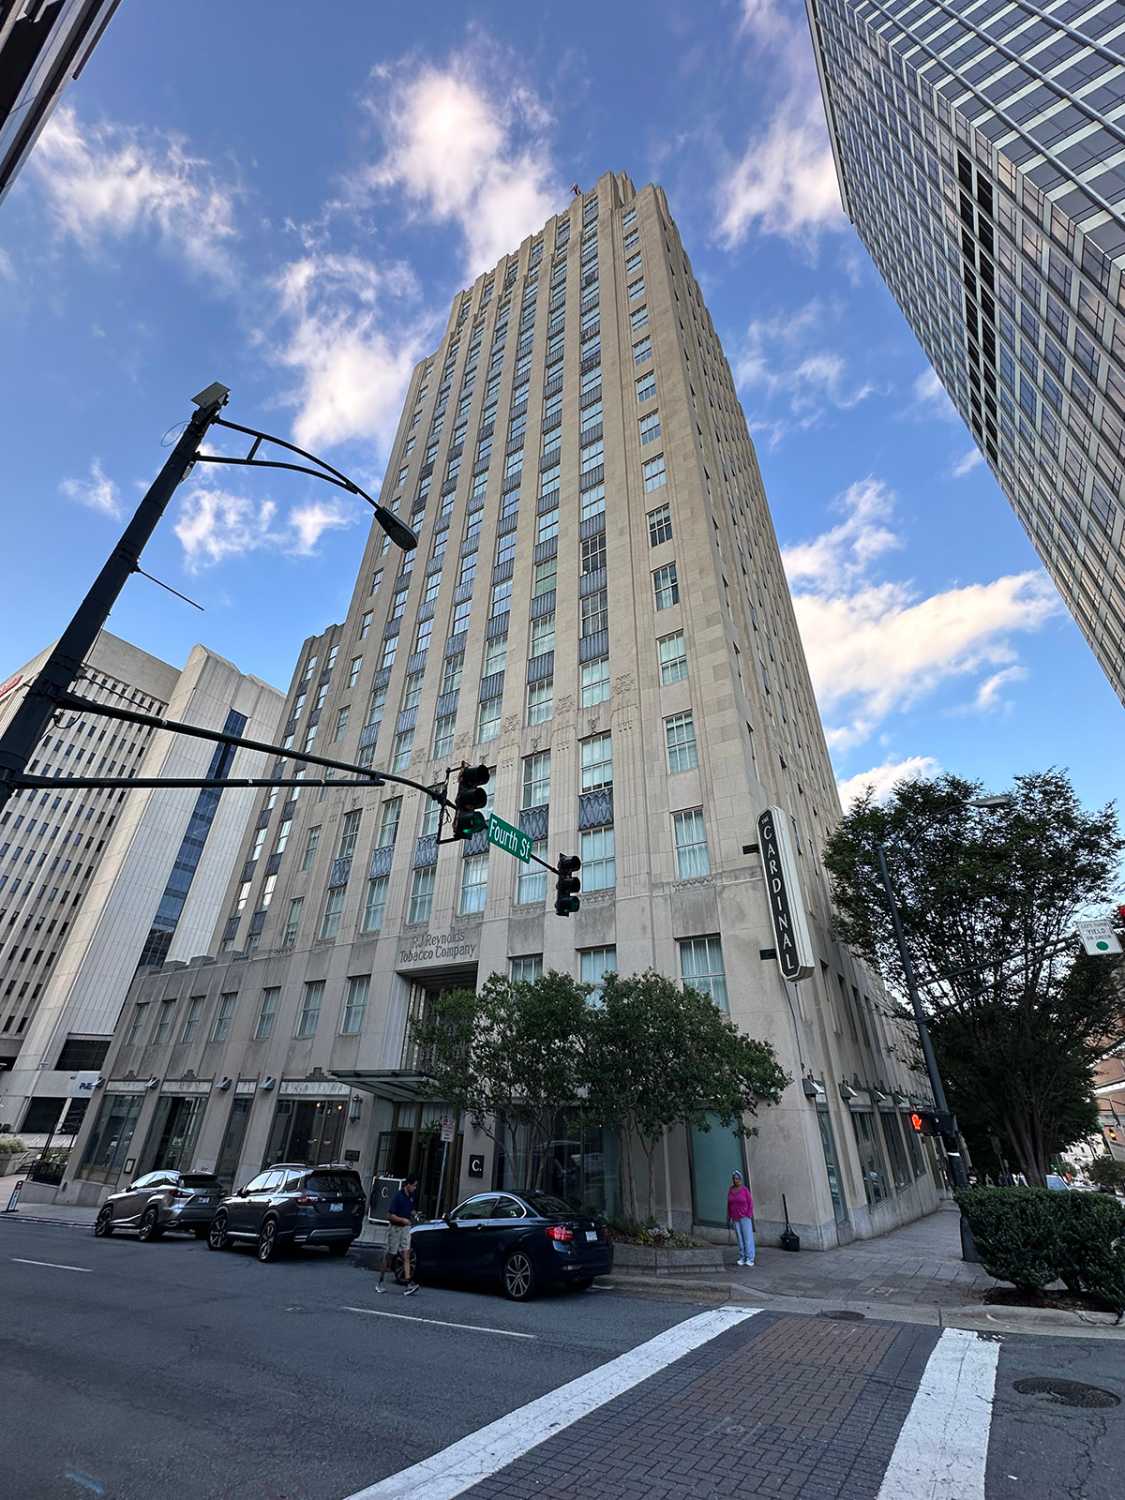
The Residences at the R.J. Reynolds Building | Photo credit: Brookings
|
Name |
R.J. Reynolds Building |
|
Address |
51 E. Fourth St. and 400 N. Church St. |
|
Owner |
PMC Property Group |
|
Gross square feet |
319,630 |
|
Building history |
Former R.J Reynolds Headquarters |
|
Year built |
1929 |
|
Year converted |
2016 |
|
Number of converted floors |
19 |
|
Average floor plate size |
20,043 |
|
Number of units |
114 |
|
Unit mix by type |
86 x 1BR, 28 x 2BR |
|
Average rent |
$2,124 |
|
Average rent per square foot |
$2.85 |
|
Affordability |
Market rate |
|
Acquisition price |
$8,508,240 |
Source: Authors’ analysis of CoStar real estate market data and interviews with local stakeholders
Note: Work prepared by The Brookings Institution, HR&A Advisors, Inc., Gensler, and Eckholm Studios as part of a cooperative agreement with the U.S. Department of Housing and Urban Development.
|
Financing type |
|---|
|
Traditional financing |
|
Developer equity |
|
Senior construction loan |
|
County |
|
Local Historic Landmark Program |
|
State |
|
State historic preservation tax credit |
Source: Authors’ interviews with local stakeholders
Note: Work prepared by The Brookings Institution, HR&A Advisors, Inc., Gensler, and Eckholm Studios as part of a cooperative agreement with the U.S. Department of Housing and Urban Development.
Wachovia Bank and Trust Building
The renaissance revival Wachovia Bank and Trust Building was built in 1911 as the original home of Wachovia Bank, and was Winston-Salem’s first tall steel-framed building. (In the 1960s, Wachovia later upgraded to a much larger International Style building.) PMC Property Group acquired the building after its price dropped during the pandemic, and converted it into 86 multifamily rental units, which are now leasing (Table 6). Table 7 describes the financing structure of the conversion.
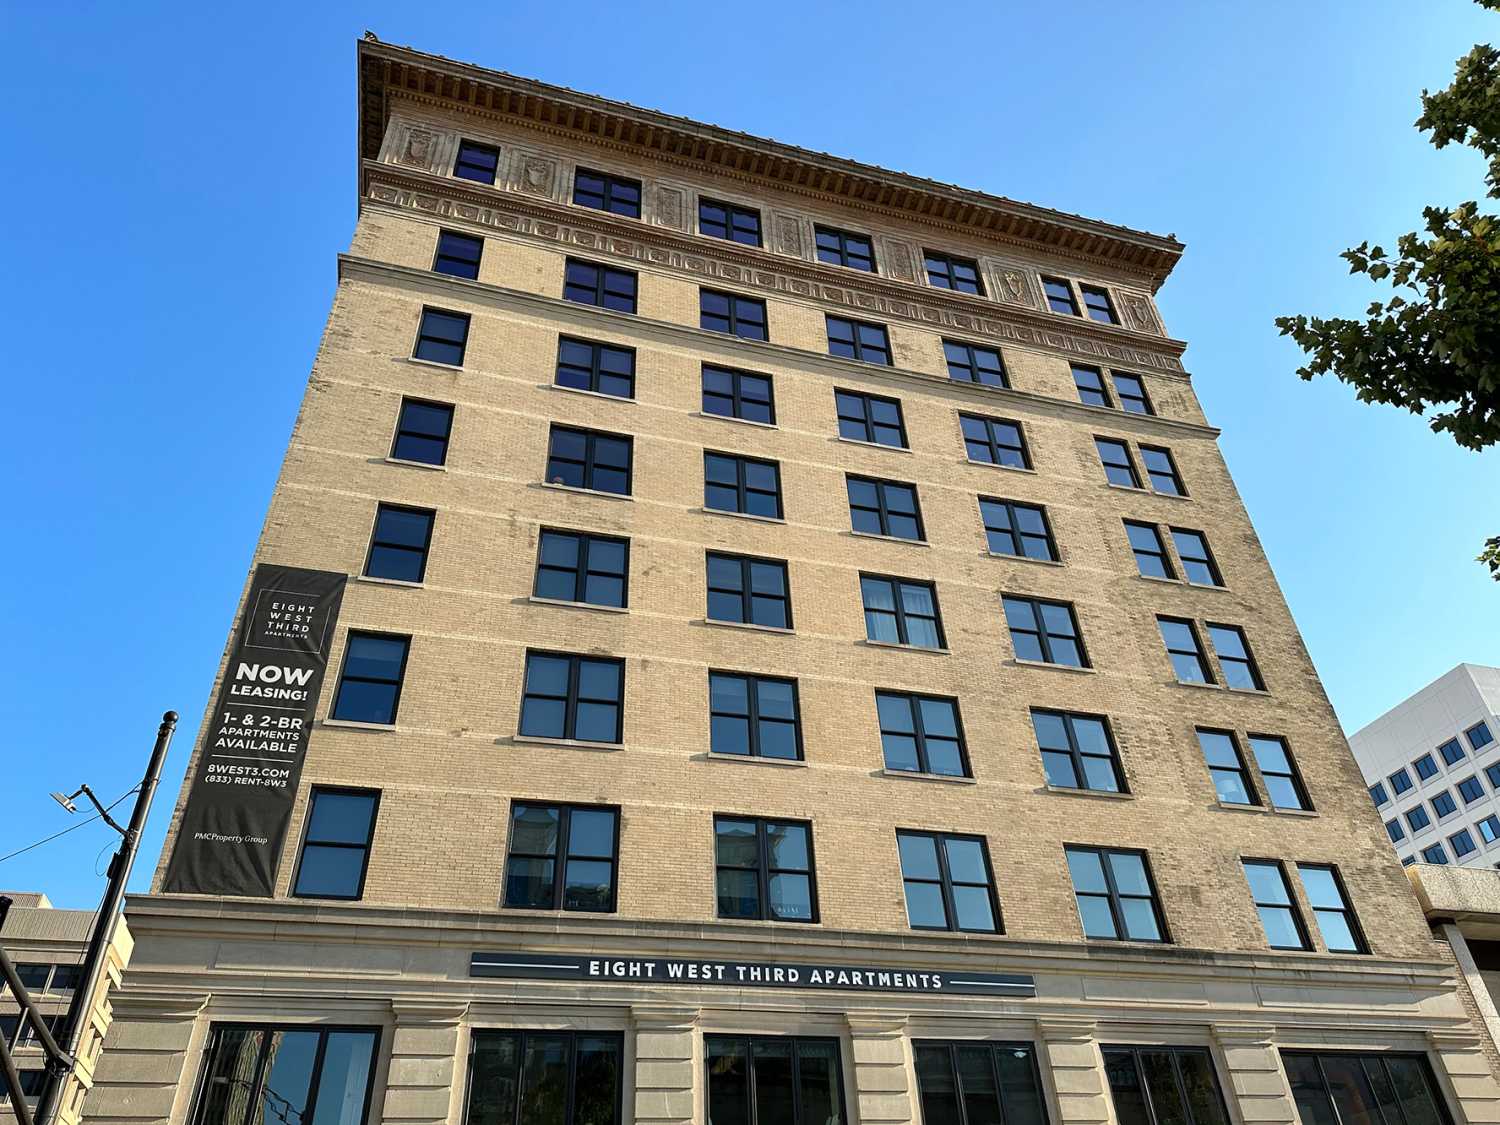
Wachovia Bank and Trust Building | Photo credit: Brookings
|
Name |
Eight West Third Apartments |
|
Address |
8 W. Third St. |
|
Owner |
PMC Property Group |
|
Gross square feet |
90,000 |
|
Building history |
Former Wachovia Bank and Trust Building |
|
Year built |
1911 |
|
Year converted |
2023 |
|
Number of converted floors |
9 |
|
Average floor plate size |
10,000 |
|
Number of units |
86 |
|
Unit mix by type |
80 x 2BR, 6 x 3BR |
|
Average rent |
$3,202 |
|
Average rent per square foot |
$3.16 |
|
Affordability |
Market rate |
|
Acquisition price |
$3,793,770 |
Source: Authors’ analysis of CoStar real estate market data and interviews with local stakeholders
Note: Work prepared by The Brookings Institution, HR&A Advisors, Inc., Gensler, and Eckholm Studios as part of a cooperative agreement with the U.S. Department of Housing and Urban Development.
|
Financing type |
|---|
|
Traditional financing |
|
Developer equity |
|
Senior construction loan |
|
County |
|
Local Historic Landmark Program |
|
State |
|
State historic preservation tax credit |
|
Federal |
|
Federal historic preservation tax credit |
Source: Authors’ interviews with local stakeholders
Note: Work prepared by The Brookings Institution, HR&A Advisors, Inc., Gensler, and Eckholm Studios as part of a cooperative agreement with the U.S. Department of Housing and Urban Development.
Future conversion potential
We assessed the architectural conversion viability of 18 high-vacancy buildings in Winston-Salem. To select these buildings, we used CoStar data to identify buildings with vacancy rates in excess of 20%. The CoStar data were then triangulated with input from qualitative interviews about potential conversion candidates and additional factors such as year built, building area, number of stories, and office class in order to identify the buildings best suited to make up a representative set of properties for architectural conversion viability analysis. Finally, three buildings were selected for detailed architectural studies based on results from the initial analysis and input from interview participants.
Buildings were assigned a percentage score to denote their architectural compatibility for conversion, and grouped into the following categories:
- Properties that score above 80% can likely convert without design compromises.
- Properties that score between 70% and 80% can likely convert with some design compromises.
- Properties that score below 70% can likely convert only with major design compromises.
From the analysis, we then projected the number of units that would be created by converting all the scored buildings. We also projected the greenhouse gas savings associated with unit creation via conversion rather than new build activity. A full explanation of our calculation methodology is included in Appendix A.
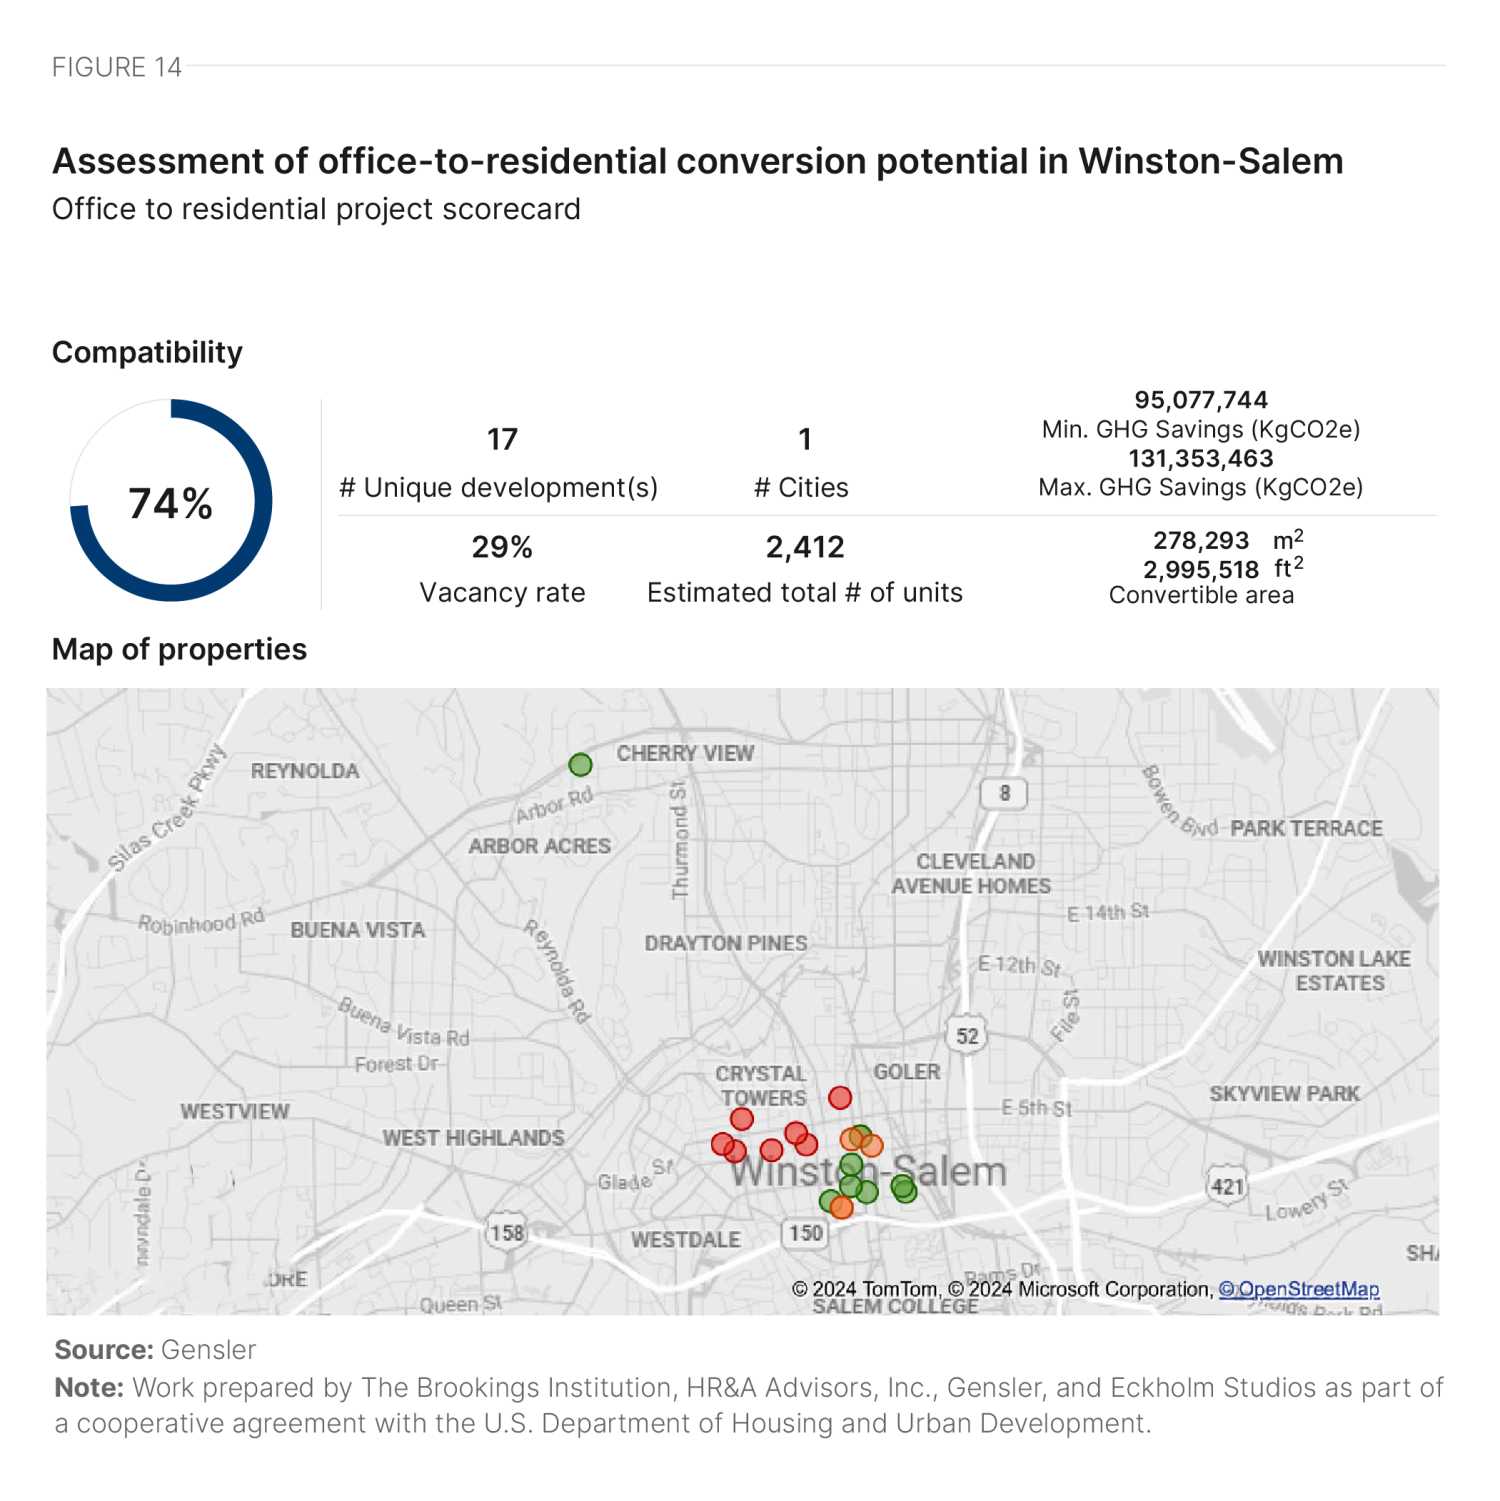
Our study of Winston-Salem focused on 18 buildings, due to the city’s relatively small size. We analyzed some buildings in multiple parts, resulting in a total of 20 distinct parts. Of these 20 parts, eight accounted for 49% of the total building area analyzed, and each scored over 80%. Another five parts, making up 24% of the area, scored over 70%. Overall, the average compatibility score of buildings in Winston-Salem aligns with the average score of the 1,400-plus buildings Gensler has studied across the country.
In Winston-Salem, most buildings have the desired rectangular form, which positively contributed to the overall score. However, floor plate sizes vary, posing challenges for some properties. For instance, 801 W. Fourth St. and 809 W. Fourth and One-Half St. have large floor plates, which make it difficult to utilize the deep space. On the other hand, buildings such as 101 W. Fourth St. have smaller floor plates, which could result in a constrained unit mix.
Although most buildings feature punched windows (which positively impacted their score), the number of facades with openings varies across buildings. Buildings such as 801 W. Fourth St. and 411 W. Fourth St. scored low due to a lack of facades with openings. These buildings—generally located on the northern side of downtown around Fifth Street and Fourth Street—are low-rises, except for 500 W. Fifth St., which is an 18-story tower in the area.
Most buildings with large gross areas, such as 100 N. Main St. and 1 W. Fourth St., include loading areas and central mechanical risers, which positively impacted their score because these features can be reused in residential buildings. Buildings such as 545-550 N. Trade St. and 635 W. Fourth St., with lower gross areas, lack these services, which negatively impacted their scores.
Good walkability, supported by a reliable bus service from the Winston-Salem Transit Authority, had a positive impact on the scores of all buildings analyzed. Similarly, access to food and beverage outlets, grocery stores, schools, and entertainment venues improved scores, while the lack of parks within walking distance negatively affected them.
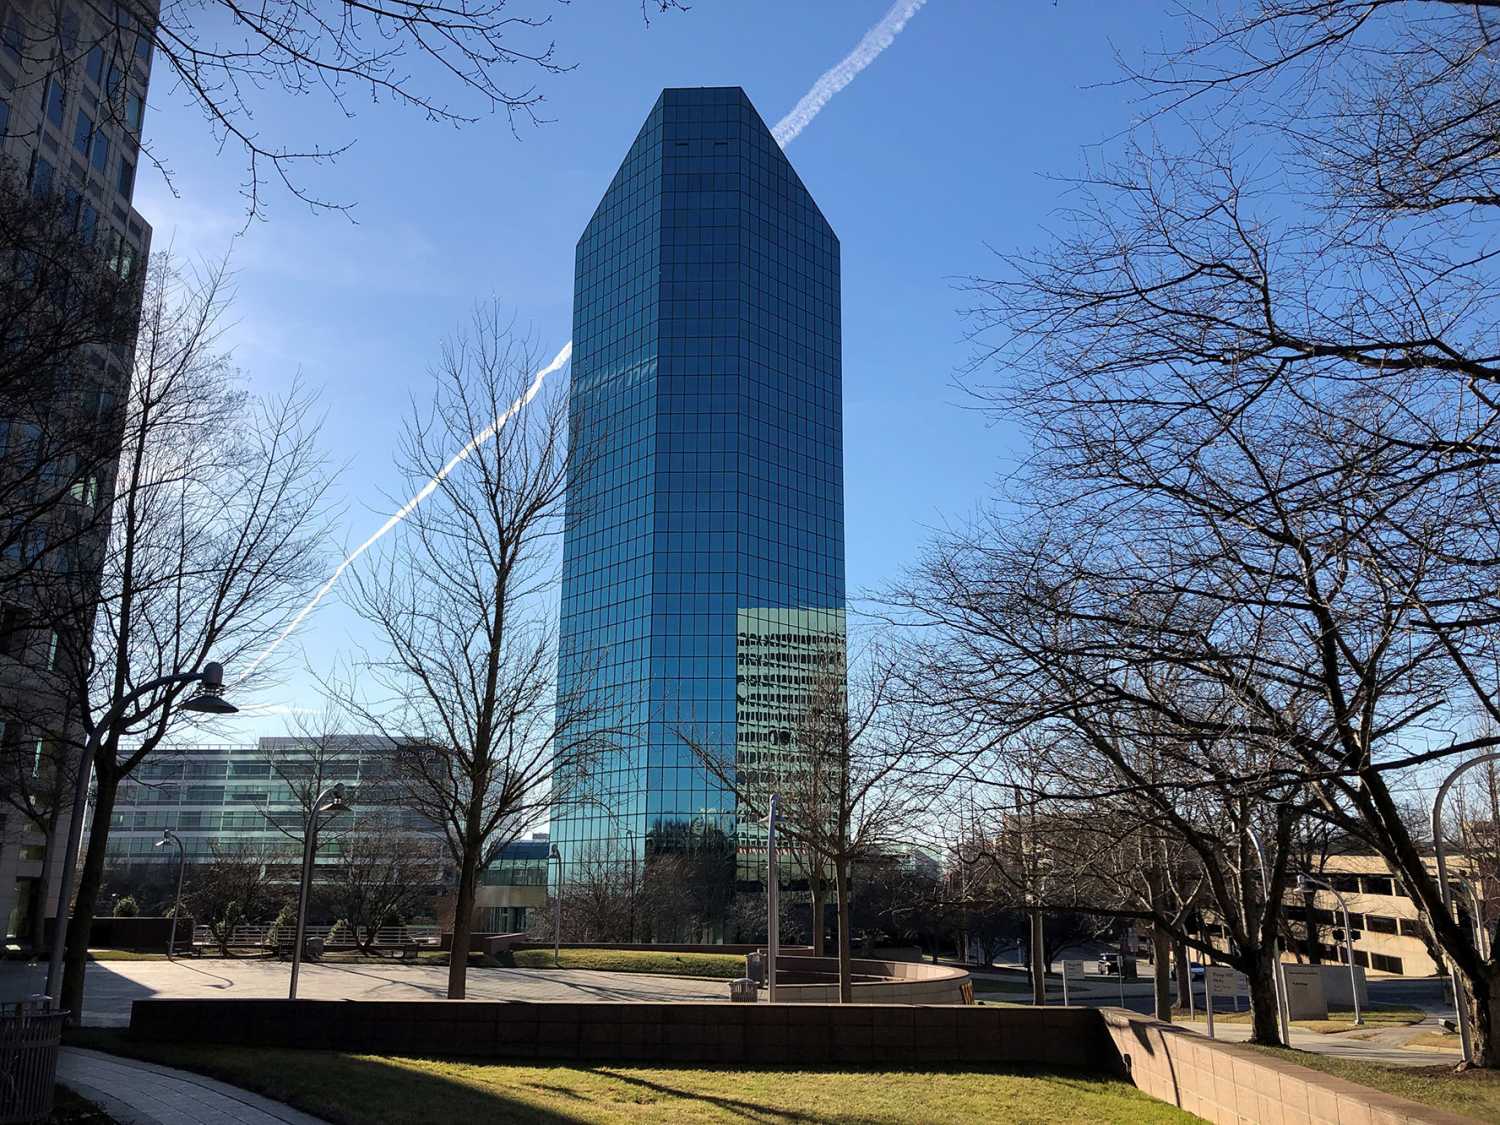
1 West Fourth Street
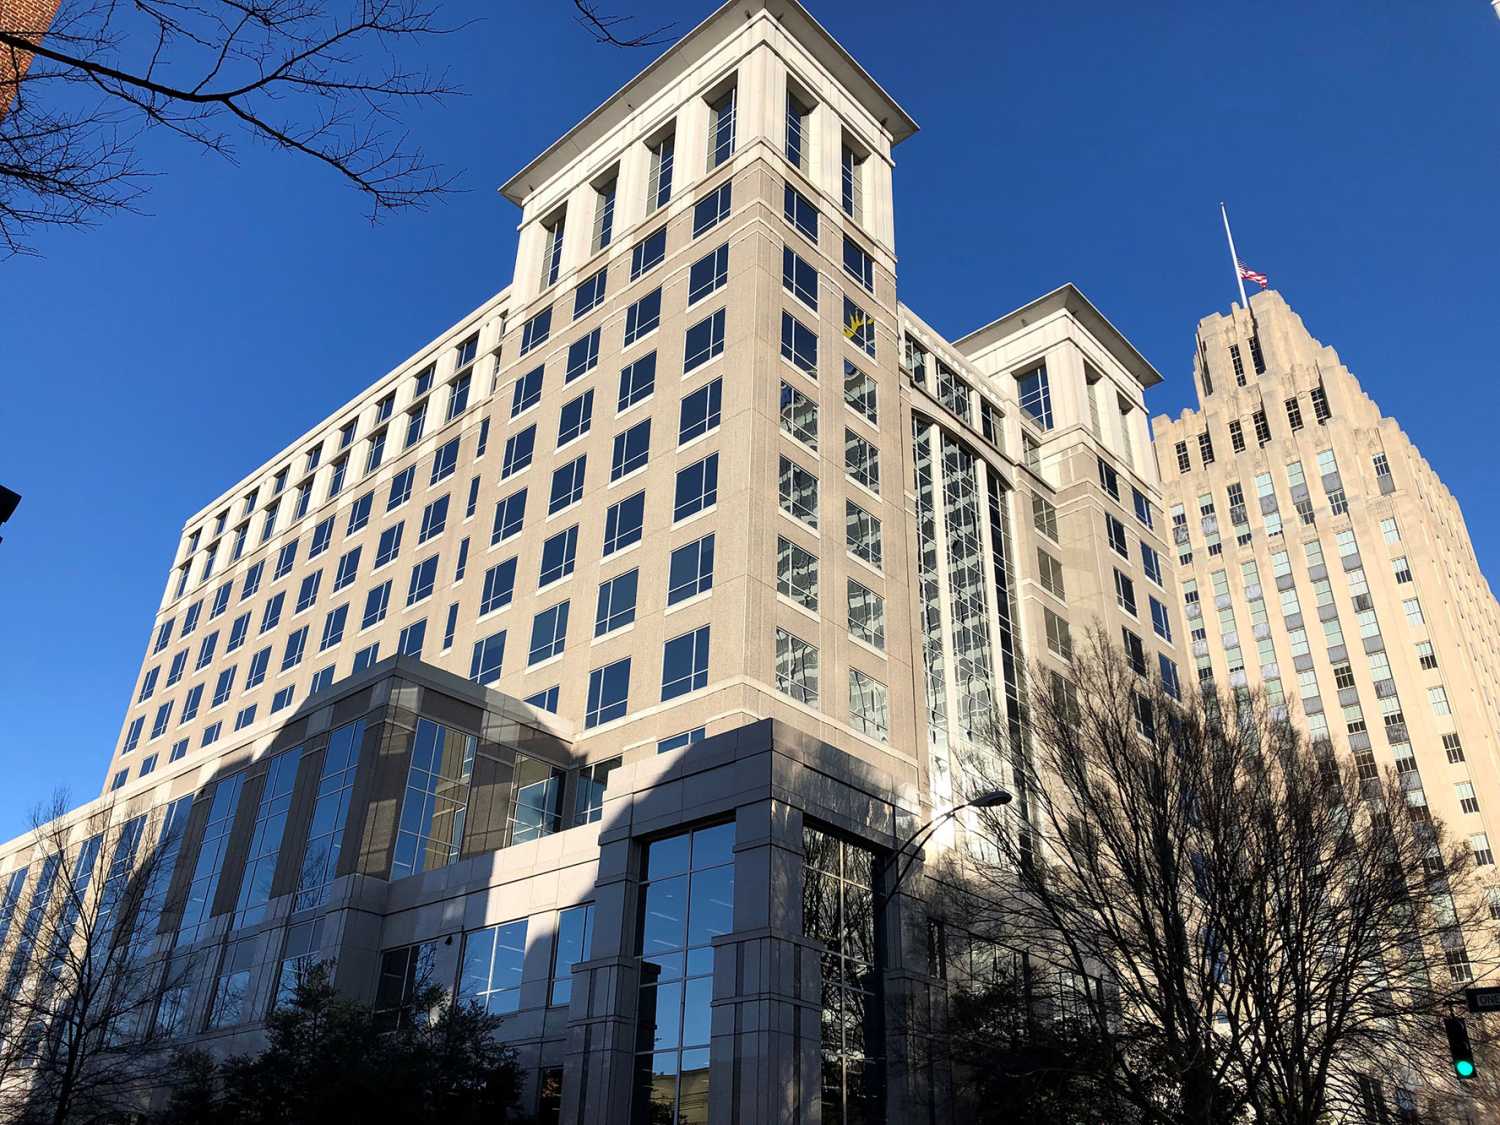
1 West Fourth Street | Photo credit: Brookings
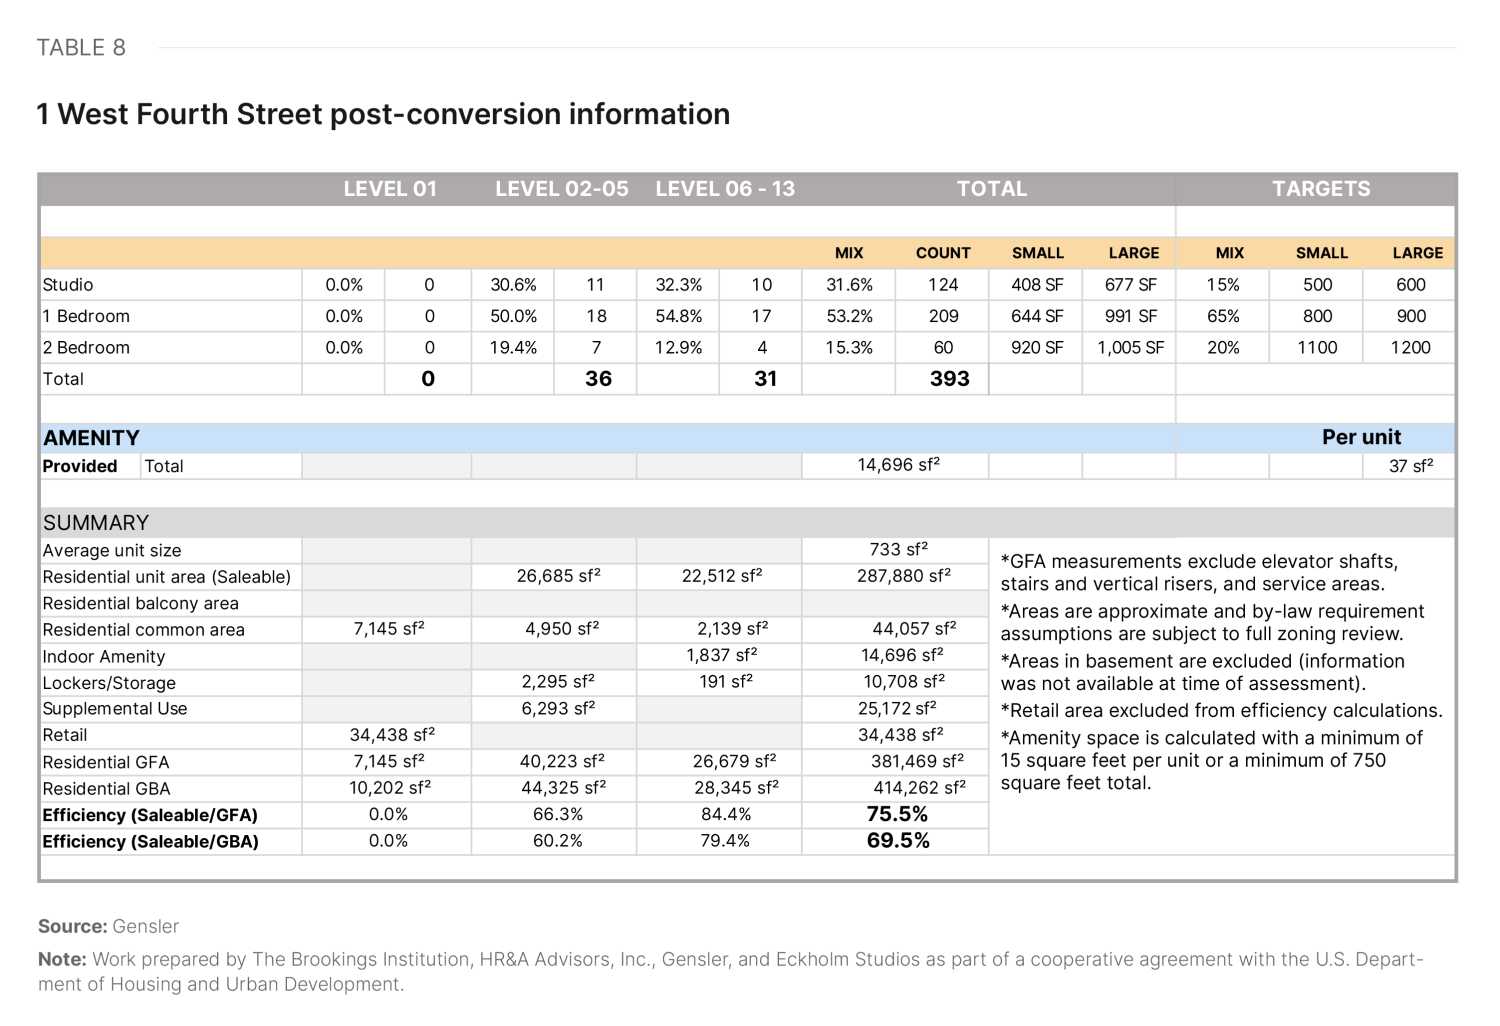
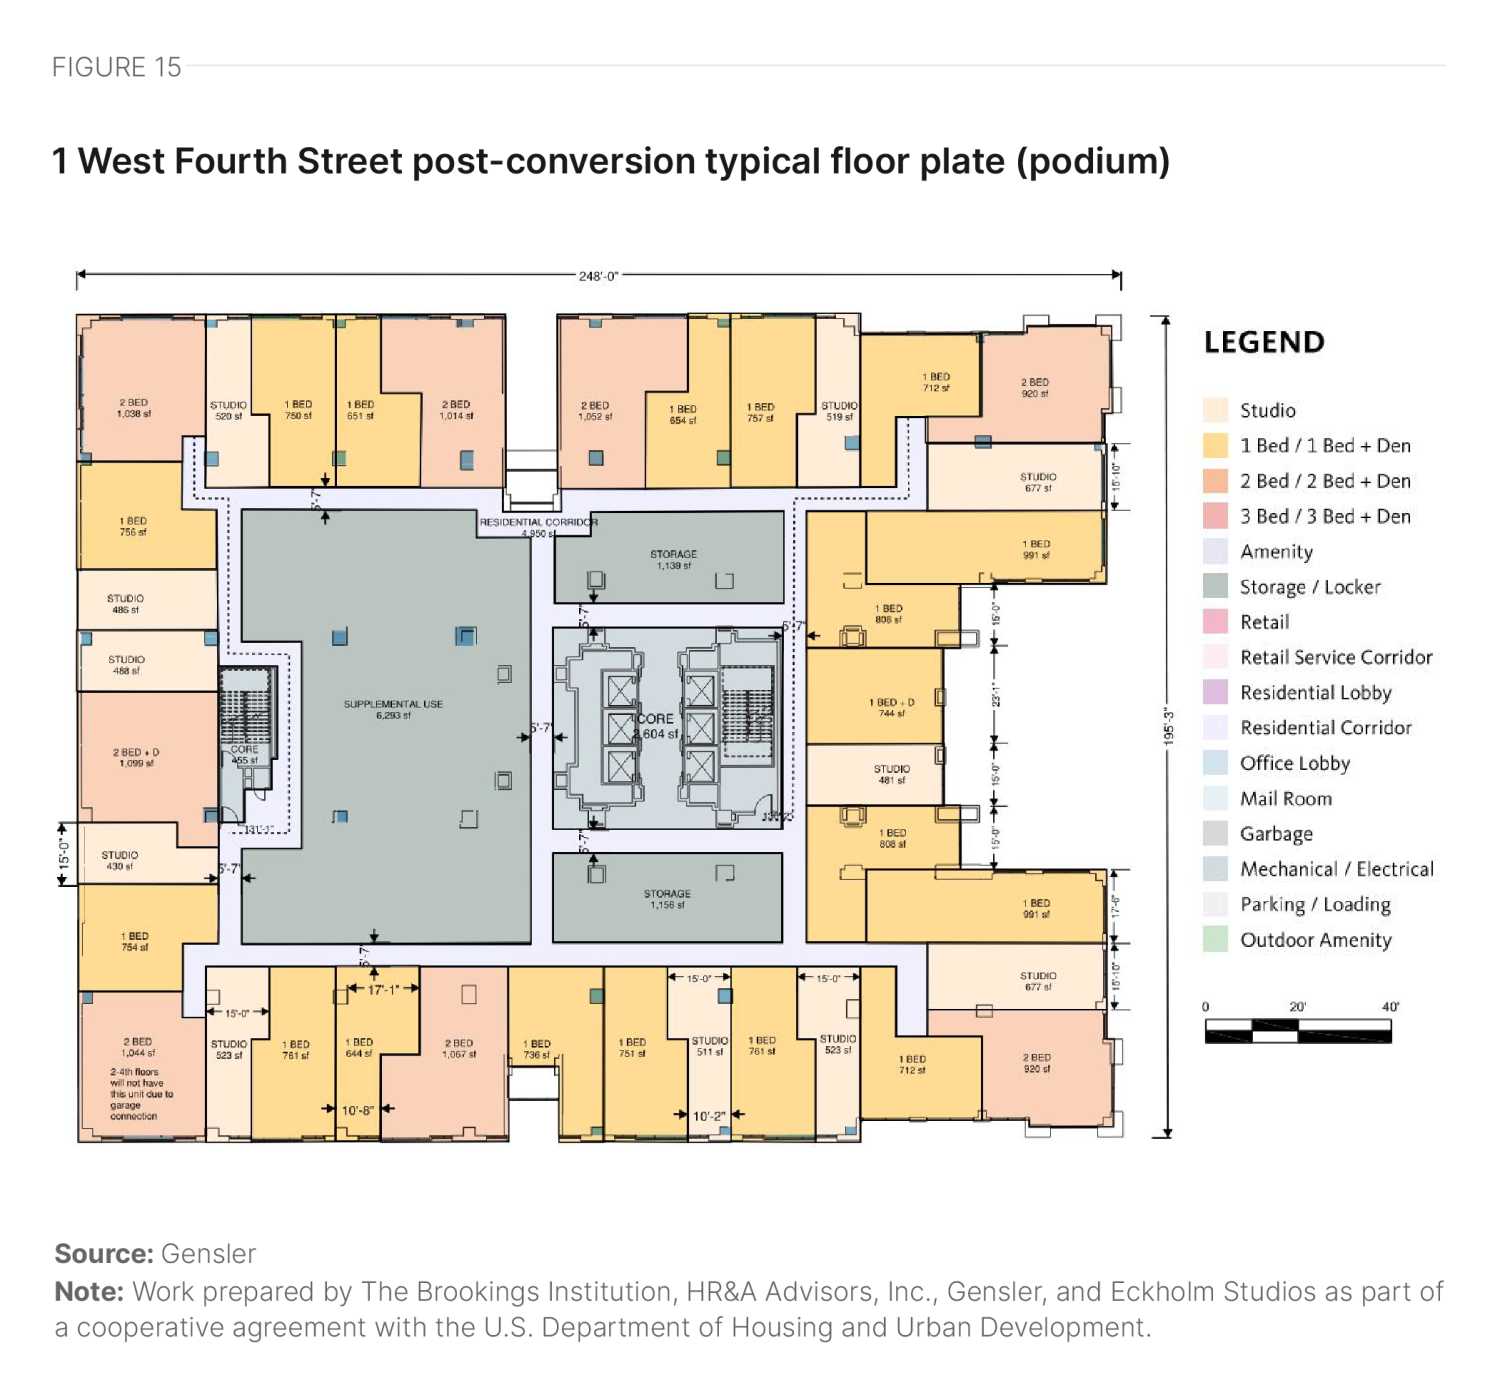
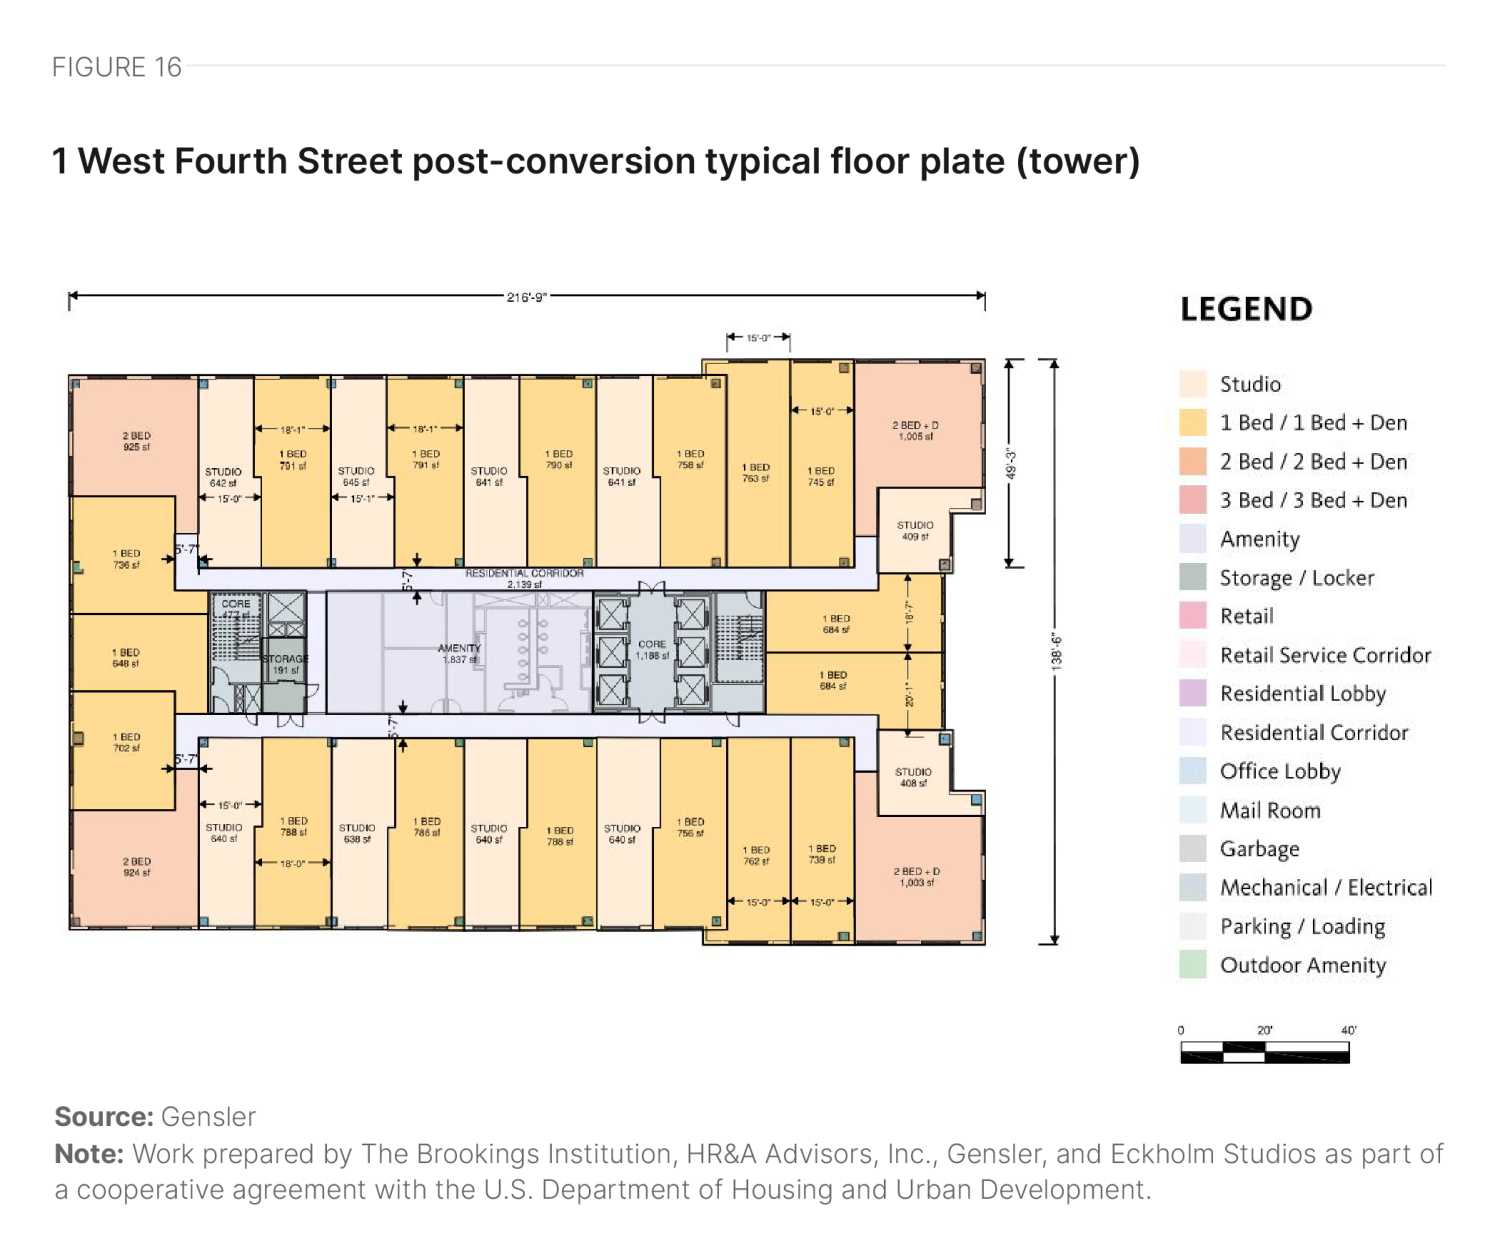
1 W. Fourth St. sits at the intersection of Fourth Street and N. Liberty Street. Built in 2000, it is a 14-story structure with a gross area of 443,879 square feet. The building consists of a podium and a tower, each with distinct features, so we studied it in two parts.
Levels 01 to 05 comprise the podium, featuring a large floor plate and core-to-window depth with a centrally located core. These levels have large glazed windows on three sides but are obstructed by a neighboring building on one side. The large core-to-window depth, coupled with limited facades with windows, creates a large space on the floor plate that cannot be used for units, negatively impacting the efficiency of the floor plate. The developer can utilize these deep spaces without direct access to natural light for amenities and/or storage. The ground floor is expected to be designated for retail, with part of it allocated to the residential lobby and service areas.
Levels 06 to 13 comprise the tower, featuring a rectangular form with a central core and a relatively large floor plate. Although the core-to-window depth is larger than ideal and creates some deep spaces unsuitable for units, the rectangular form supports systematic unit planning, resulting in a reasonable level of floor plate efficiency. The façade, with punched windows on all sides, provides excellent views and daylight access.
Given the varying physical features of the tower and podium, developers could consider a mixed-use approach with residential space in the tower portion. However, Table 8 shows the post-conversion residential yield of a residential-only approach, with Figure 15 showing a potential layout of the podium and Figure 16 showing the tower.
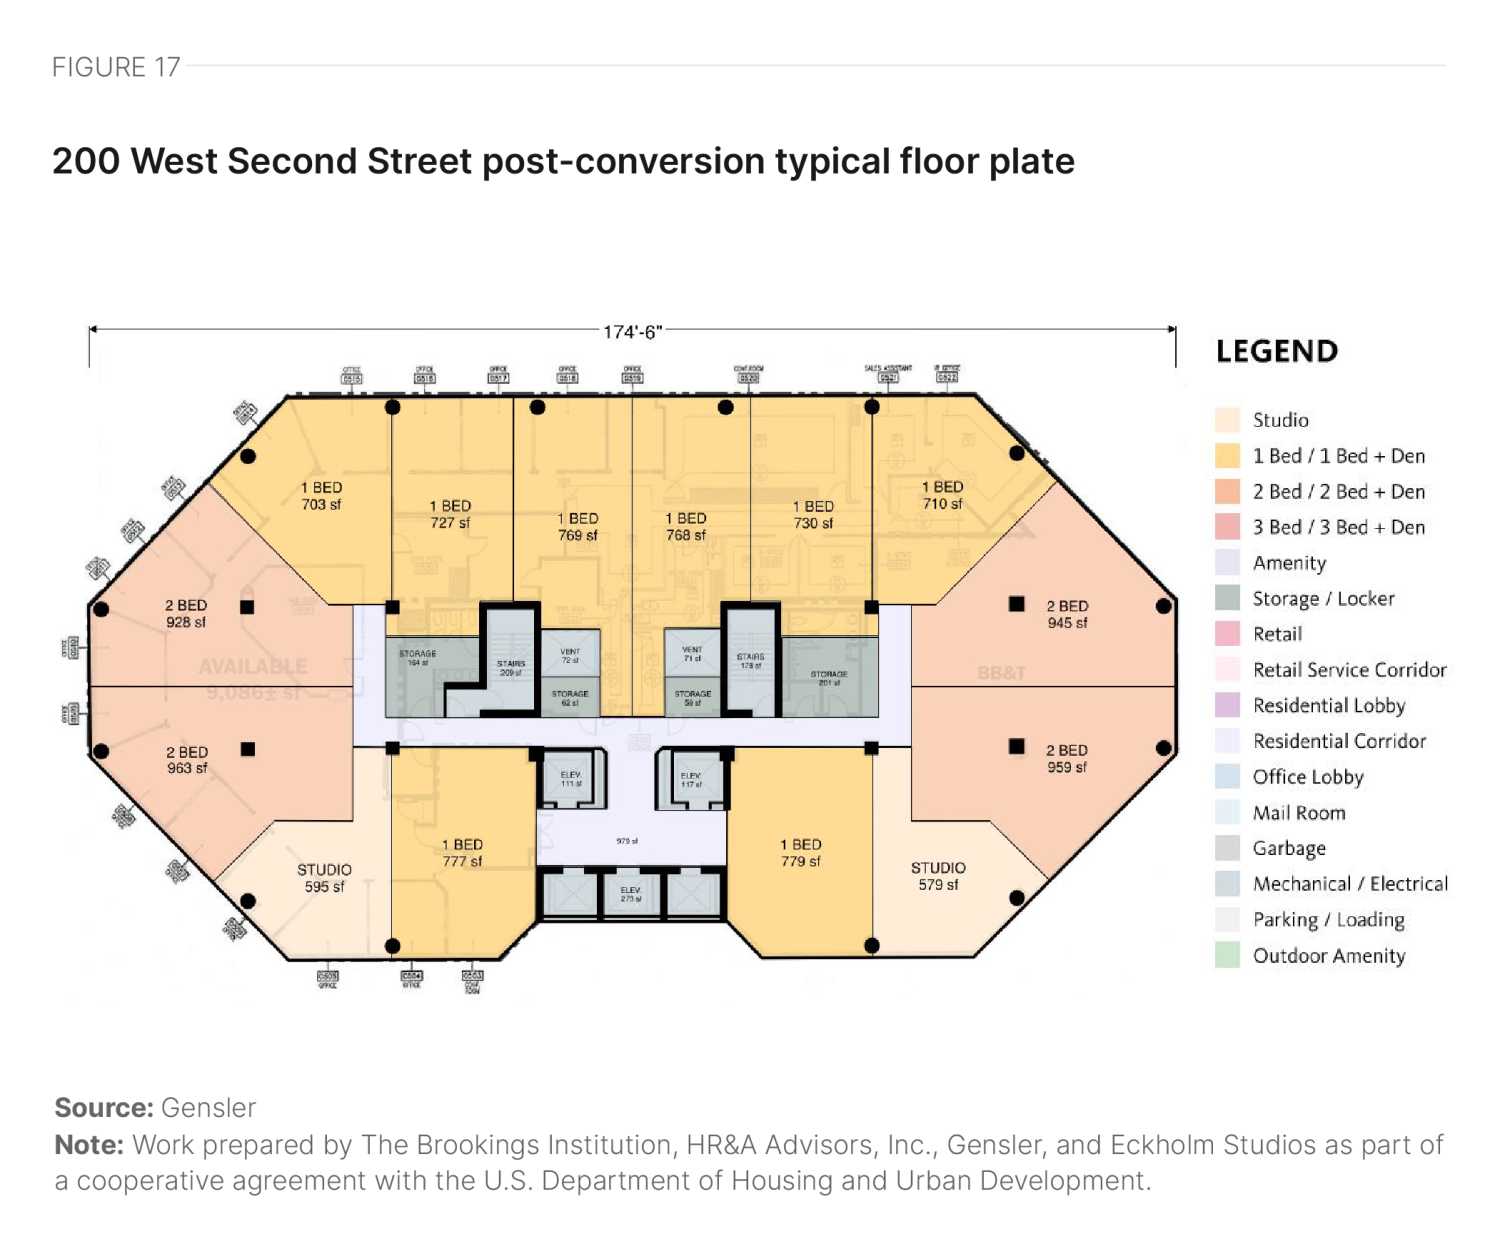
200 West Second Street
200 West Second Street | Photo credit: Brookings
200 W. Second St. sits centrally at the intersection of Second Street and N. Liberty Street. Built in 1987, it is a 20-story structure with a gross area of 268,425 square feet.
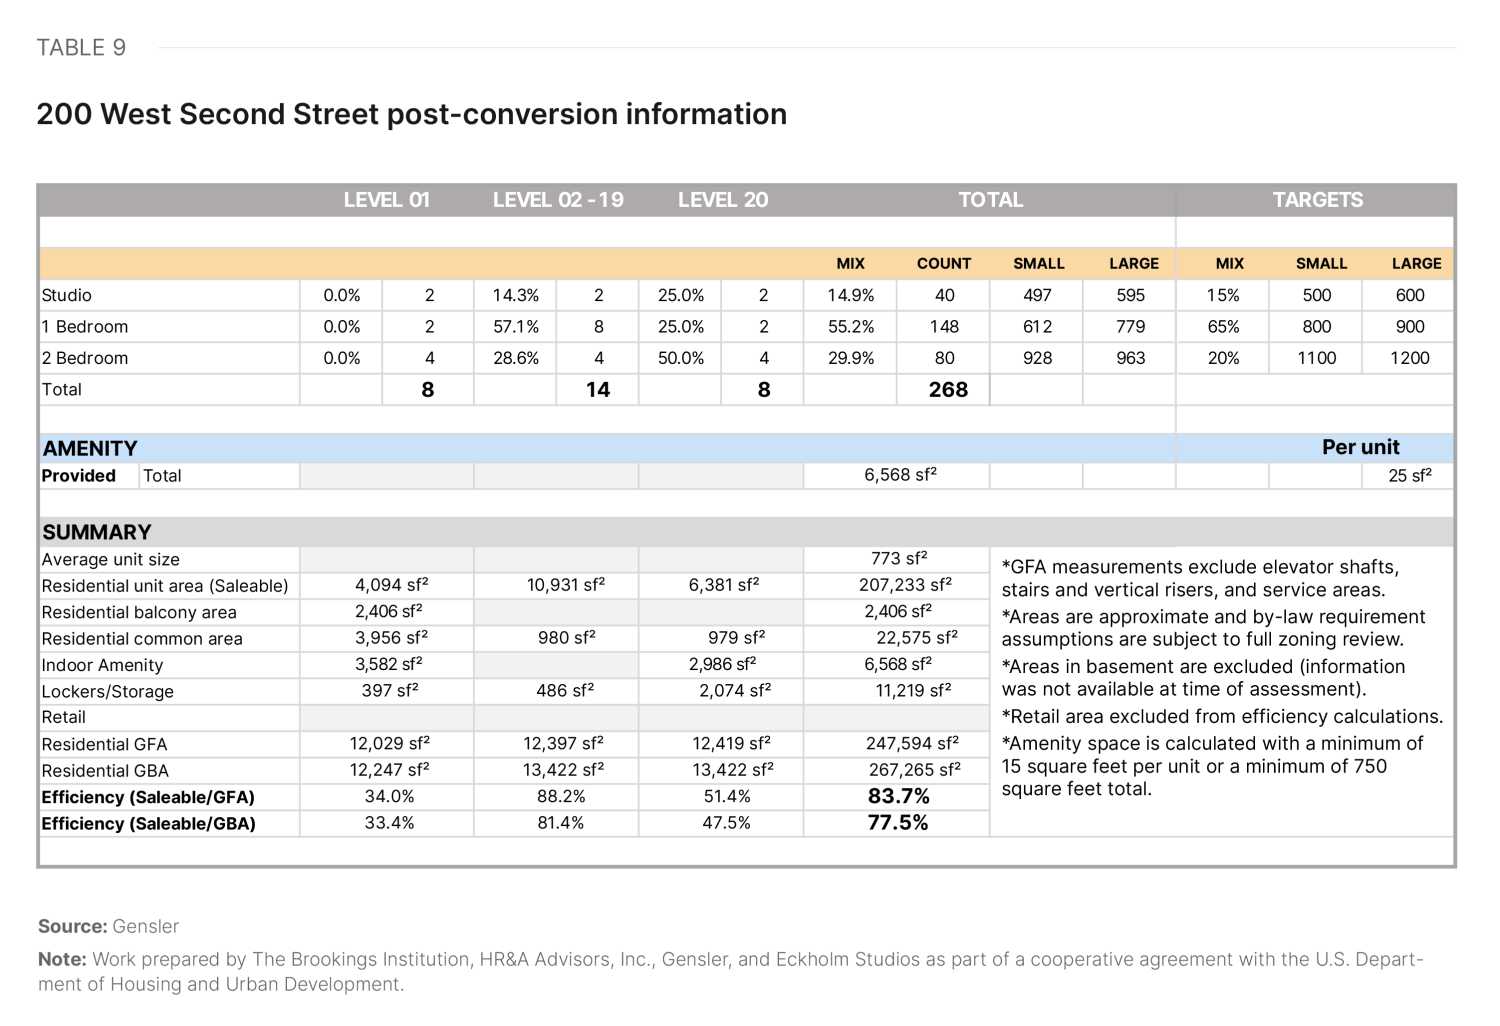
The building features a rectangular floor plate with a central core and chamfered edges on both ends. Although the floor plate size is slightly larger than desired, the core-to-window depth—or lease depth—is nearly ideal, facilitating good efficiency and yielding units close to market size. Some deep space exists around the central core, which cannot be used for units but can be utilized for amenities and/or storage. The curtain wall façade offers excellent access to views and daylight, but if the developer retains it, they may need to add operable sections. The top floor has an angled roof that creates some spaces without access to natural light, which a developer could use for amenities. The ground floor can also be residential, with amenity space spilling over into the plaza. Table 9 summarizes the post-conversion yield, while Figure 17 shows a potential layout for a typical floor.
2650 Pilgrim Court
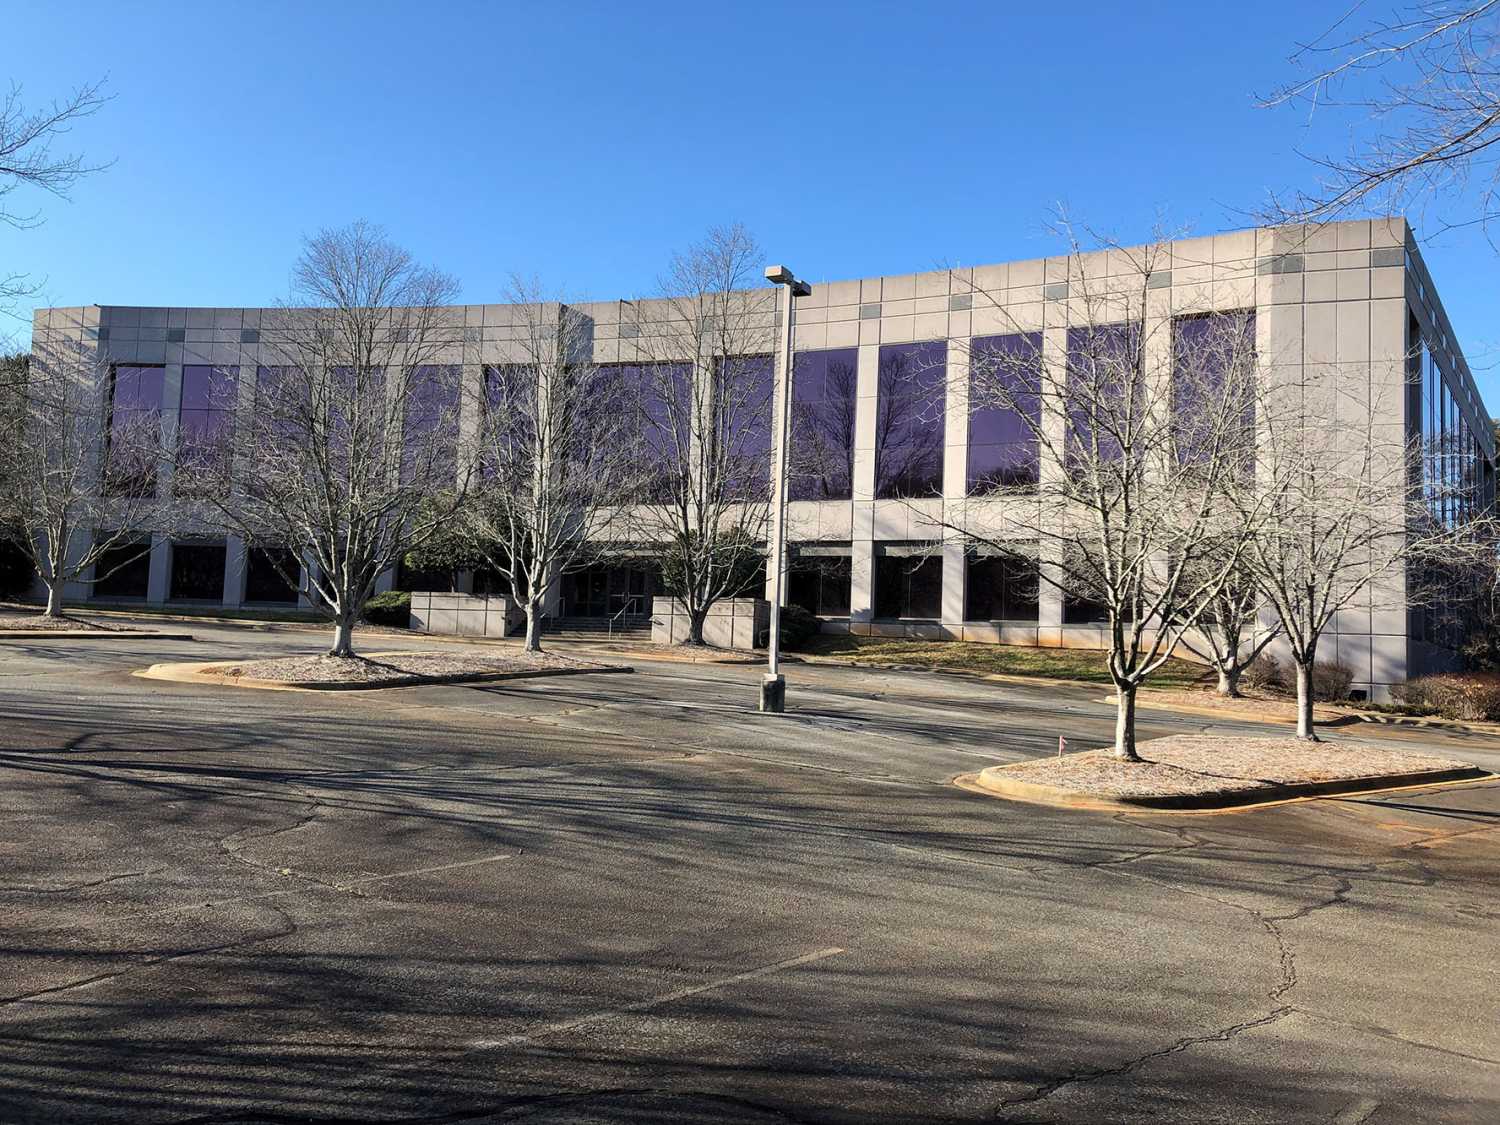
2650 Pilgrim Court | Photo credit: Brookings
2650 Pilgrim Court sits outside downtown in the northwest part of Winston-Salem at the intersection of Pilgrim Court and Coliseum Drive NW. Built in 1993, it is a four-story structure with a gross area of 80,245 square feet.
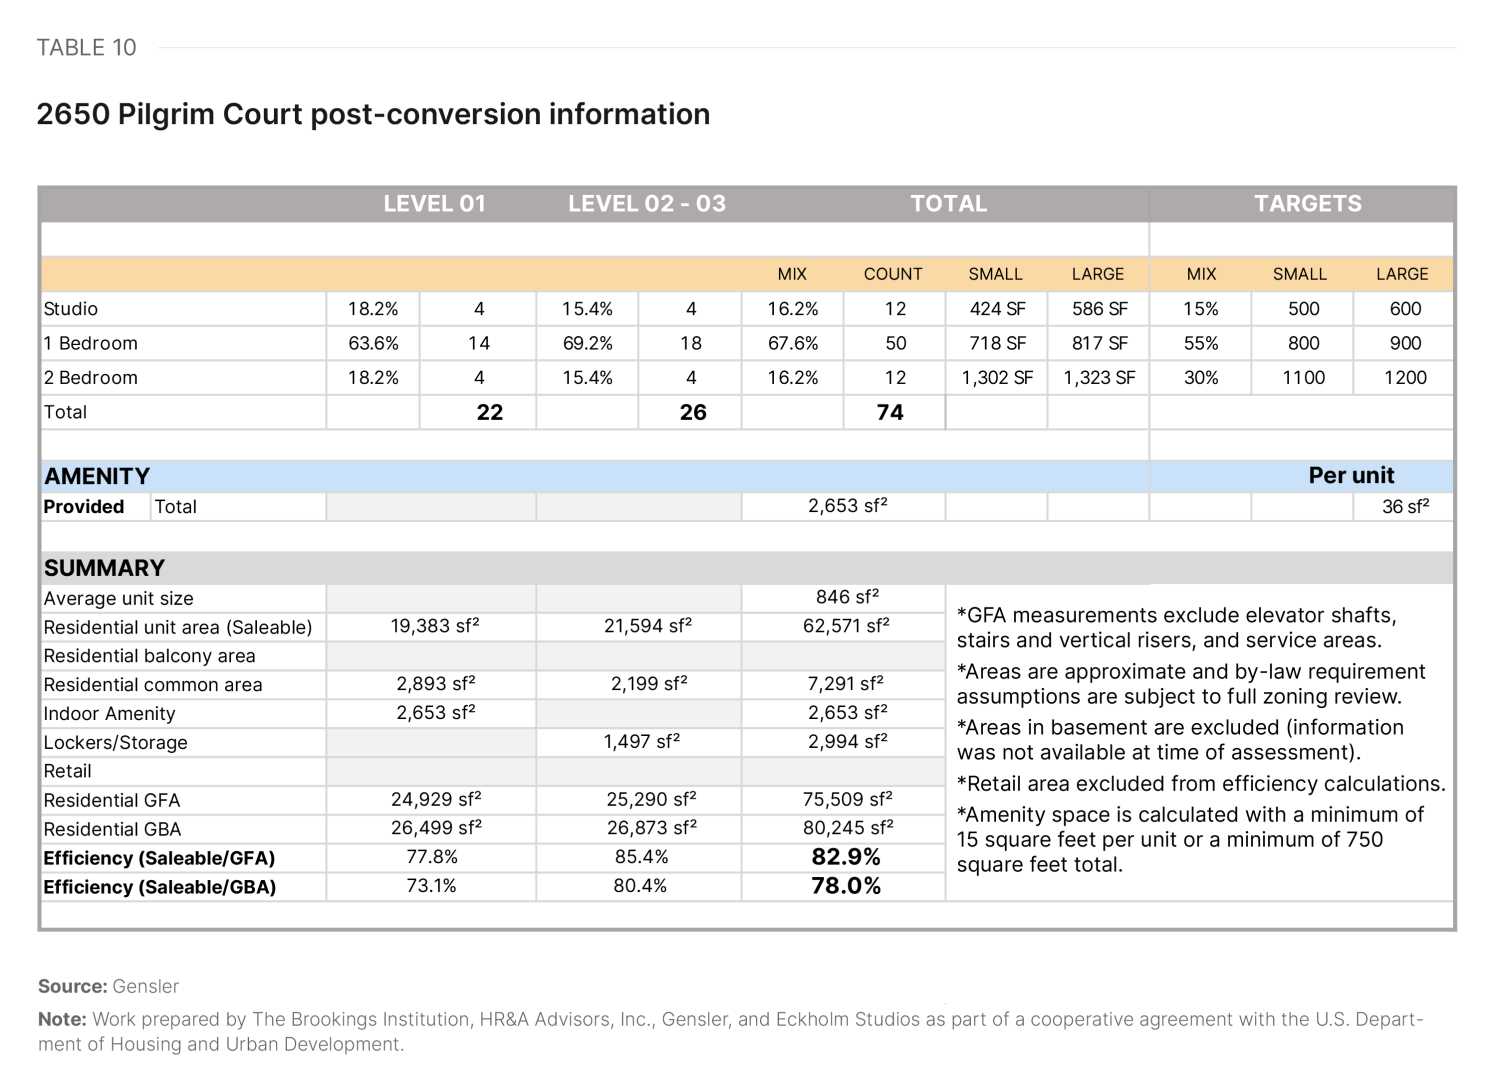
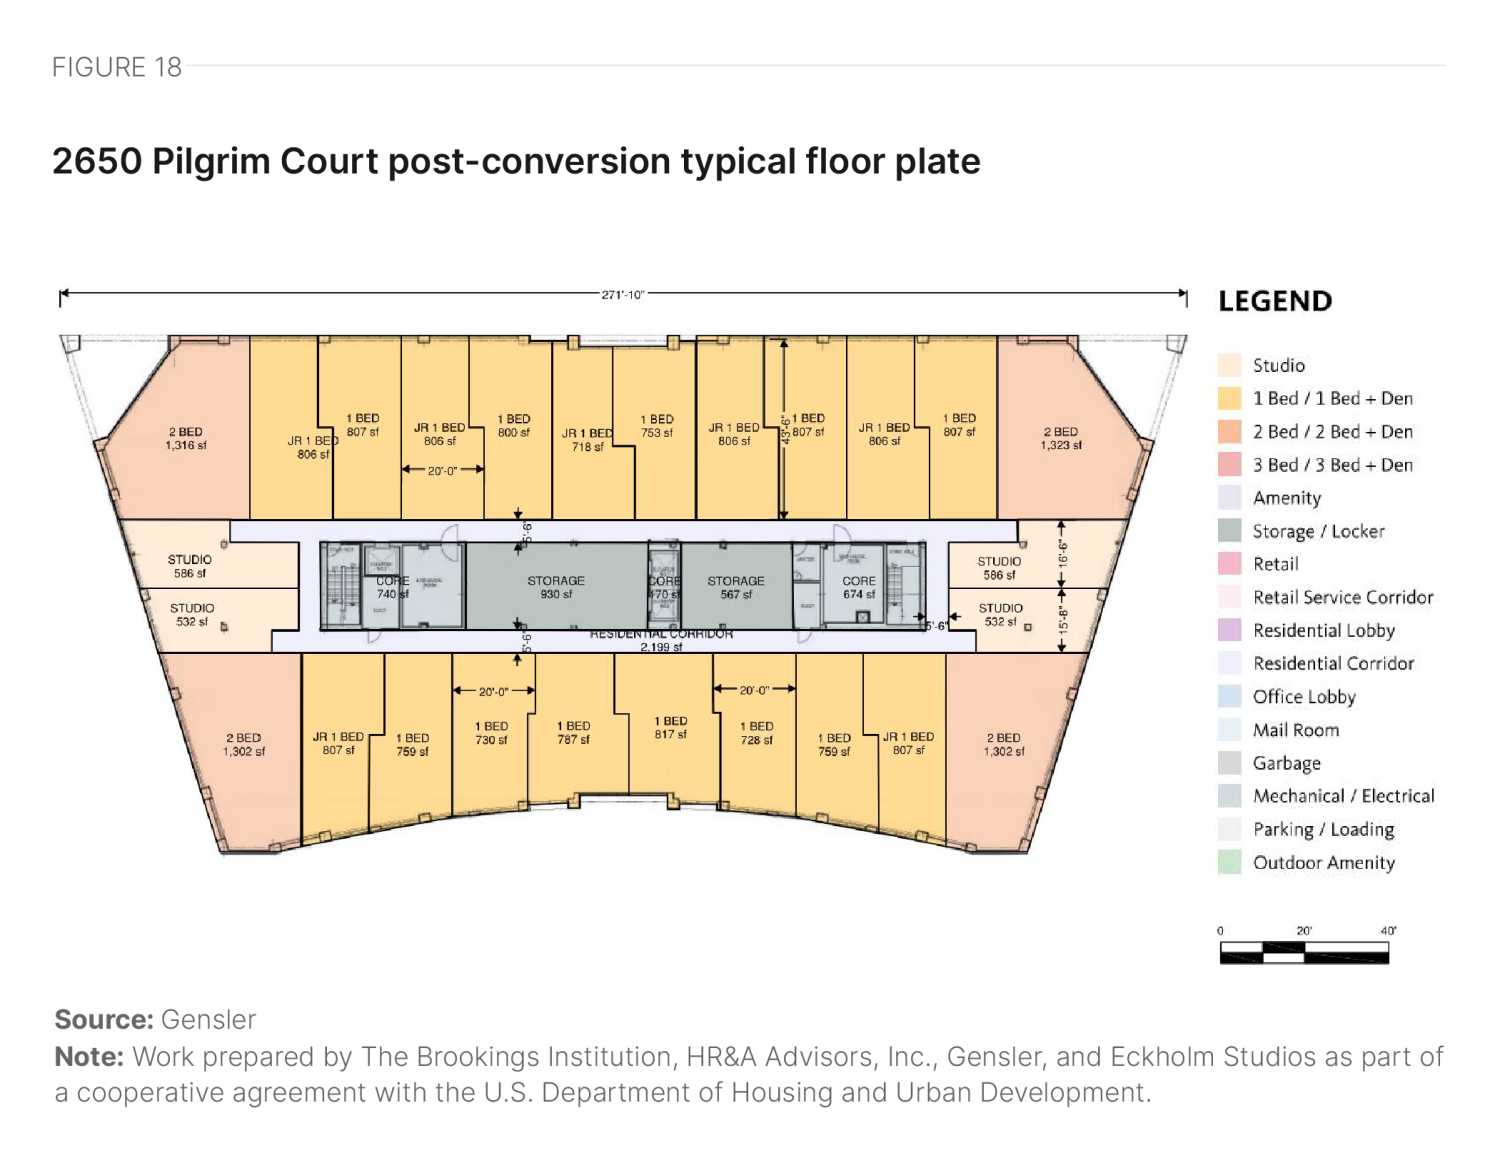
The building features a rectangular floor plate with some modulation around the corners and edges, along with a centrally located core. Although the floor plate size and core-to-window depth are slightly larger than ideal, they allow for good floor plate efficiency and yield units close to market size. Some deep spaces without direct access to natural light exist around the central core, but can be used for amenities and/or storage. The façade features large, glazed windows on all sides, offering good access to views and daylight. If the developer retains the façade, they may need to add operable sections. The ground level and above can convert to residential use (yield shown in Table 10, floor plate in Figure 18), while the lower level would need an alternate use.
There is also potential for ground-up residential development on the parking lot.
Future outlook
The sparkles and struggles of big superstar and legacy cities make it easy to overlook that small and midsized cities such as Winston-Salem are where the American middle class is thriving. The policy regimes established by these cities can provide critical lessons to a country struggling with economic divergence and inequality.
After years of decline, Forsyth County and Winston-Salem started to see a population growth at the turn of the 21st century. Over the past three decades, Winston-Salem has invested in revitalizing the heart of the tobacco industry downtown into the Innovation Quarter (IQ) research park. The IQ footprint is over 330 acres, and over 1.7 million square feet of mixed-use new build and revitalized property has been completed since 2012. Joint investment from the city, Wake Forest University School of Medicine, real estate and development partner Wexford Science and Technology, and other partners has driven the project forward. The IQ contains over 3,600 workers, 90 companies, five academic institutions, and over 1,000 units of multifamily housing.
We have everything. If you want big city life in a small town, here we are.
A Winston-Salem stakeholder
Compared to North Carolina as a whole, Winston-Salem residents are more likely to have an advanced degree, with 35.5% holding a bachelor’s degree or higher compared to 33.9% of all North Carolinians.8 The city is home to the Piedmont Opera, the Kaleideum learning museum, and several other multimillion-dollar arts institutions. Unlike many peers, downtown total unique visits have returned to their pre-pandemic level. Using cell phone location tracking data, Table 11 presents estimates of the number of unique visitors on a typical Thursday downtown and citywide in fall 2019 and 2023.
|
Winston-Salem |
St. Louis |
Pittsburgh |
Houston |
Los Angeles |
Stamford |
|
|---|---|---|---|---|---|---|
|
Citywide |
||||||
|
Fall 2019 |
972,648 |
1,139,210 |
1,042,281 |
10,416,616 |
13,082,015 |
427,544 |
|
Fall 2023 |
1,083,344 |
1,224,894 |
1,269,712 |
10,732,698 |
13,265,515 |
523,890 |
|
Percent change |
11% |
8% |
22% |
3% |
1% |
23% |
|
Downtown |
||||||
|
Fall 2019 |
46,014 |
119,880 |
120,850 |
275,304 |
793,111 |
102,939 |
|
Fall 2023 |
45,570 |
113,112 |
106,773 |
242,267 |
747,974 |
124,271 |
|
Percent change |
-1% |
-6% |
-12% |
-12% |
-6% |
21% |
Source: Replica Data
Note: Work prepared by The Brookings Institution, HR&A Advisors, Inc., Gensler, and Eckholm Studios as part of a cooperative agreement with the U.S. Department of Housing and Urban Development.
Looking ahead, to achieve continued revitalization—particularly in the historic central business district—the city of Winston-Salem plans to continue to deploy planning strategies to encourage adaptive reuse. Simultaneously, the city plans to continue promoting a mindset shift to attract more permanent residents downtown.
Winston has a lot of culture for a city our size. We always had a conundrum of ‘visitors got it,’ but people in wealthy neighborhoods don’t get it…We need people living downtown after 5 p.m.
A Winston-Salem stakeholder
Winston-Salem has survived and thrived in the face of economic transitions multiple times before. As it continues to build a robust 21st century economy, downtown Winston-Salem also has the opportunity to become a regional engine for housing production. With a favorable policy climate and new tools such as the Housing Trust Fund possibly on the horizon, the only question is how equitably and inclusively it can accommodate its next chapter of growth.
Office-to-residential conversion case studies


Authors
Authors listed in alphabetical order


-
Acknowledgements and disclosures
This research was supported by the U.S. Department of Housing and Urban Development under a cooperative agreement.
The authors thank Hanna Love for her review of this piece.
The authors also thank the following contributors for their invaluable assistance on this project:
HR&A:
Clark Ricciardelli – Analyst
Joe Speer – Analyst
Gensler:
Diksha Jain – Architect
Ingmar Buchner – Designer
Lisa Matthews – Intern
Nancy Yeh – Designer
Jose Segura – Architect
Turner Construction:
Reinaldo Rodriguez
All remaining errors and omissions are those of the authors.
The work that provided the basis for this publication was supported by funding under an award with the U.S. Department of Housing and Urban Development. The substance and findings of the work are dedicated to the public. The author and publisher are solely responsible for the accuracy of the statements and interpretations contained in this publication. Such interpretations do not necessarily reflect the views of the Government.
-
Footnotes
- HR&A analysis of CoStar real estate market data from 2010 to Q3 2024.
- Following data collection, which concluded on October 1, 2024, Wells Fargo vacated more than 700,000 square feet in downtown Winston-Salem while another major corporate tenant proposed to relocate downtown, causing significant fluctuations in the downtown vacancy rate.
- HR&A analysis of CoStar real estate market data for Q3 2024.
- HR&A analysis of CoStar real estate market data for Q3 2024.
- Brookings analysis of American Community Survey 2022 5-Year Estimates.
- Area median income (AMI) is a key metric used in assessing housing affordability. It is defined as the median (midpoint) of a specific geography’s income distribution (such as a metropolitan area) for different household sizes. It is calculated each year by the U.S. Department of Housing and Urban Development (HUD). According to HUD, households should pay no more than 30% of their gross income on housing, and households that pay more than 30% are considered “housing cost burdened.” HR&A’s analysis of the percentage of units by AMI category in a market begins by establishing “affordable rent levels,” which are equivalent to 30% of income at AMI for different household sizes; e.g., for a one-person household in an area with an AMI of $X, the “affordable monthly rent level” would be ($X * 30%) / 12. With those rent levels established, the analysis compares unit rent levels to AMI levels at the household sizes that correspond to the number of bedrooms in a unit; e.g., a one-bedroom unit’s rent is compared against 30% of the AMI of a one-person household, and so on.
- HR&A analysis of CoStar real estate market data from 2014 to Q3 2024.
- Brookings analysis of American Community Survey 2022 5-Year Estimates.
The Brookings Institution is committed to quality, independence, and impact.
We are supported by a diverse array of funders. In line with our values and policies, each Brookings publication represents the sole views of its author(s).