This piece was updated on December 13, 2024, to take into account updated exit poll results through November 25, 2024.
Table 1 updated on February 6, 2025.
Analyses of 2024 election exit polls, particularly by Republican-leaning pundits, are making the claim that President-elect Donald Trump’s strong showing has transformed his party’s base into a new, powerful multiracial coalition. Aside from benefitting from the continued solid backing of white working-class voters (especially men), Trump made unexpected strides among Latino or Hispanic voters and, to a lesser degree, Black men.1 This is despite Trump’s long-standing history of racial and ethnic slurs against immigrants and minorities, includes not disavowing a comedian’s damaging remarks against Puerto Rico at a pre-election rally. Some would have us believe that Trump remade his and the GOP’s image into a new Obama-style coalition by convincing minorities that, as a strongman leader, he can solve their economic and social woes. However, a closer look at the data gives pause to such assertions, and suggests that recent small deviations from long-term minority voting patterns could be a short-term blip that has not truly transformed the GOP’s voter base.
The long-standing Republican-Democratic racial voting divide continues
A look at Figure 1 makes plain one thing: While there are variations in the strength of white, Black, and Latino or Hispanic vote margins, it is clear that white voters continue to favor Republicans and the latter two groups favor Democrats. Figure 1 shows Republican-Democratic (R-D) vote margins for presidential elections from 2000 to 2024, based on data from Edison Research.2 The R-D margins represent the percentage of the group voting for the Republican candidate minus the percentage voting for the Democratic candidate, where positive values show a Republican advantage and negative values show a Democratic advantage.
Historically, white voters have favored Republican candidates in every presidential election since Richard Nixon ran in 1968, including the seven elections since 2000. The highest Republican white vote margin in the latter period occurred in 2012, favoring Mitt Romney over Barack Obama, and in 2016, favoring Donald Trump over Hillary Clinton. Republicans’ white vote margins in 2020 and 2024 were actually smaller than in those two elections.
In contrast, Black voters have a long history of favoring Democratic candidates, dating back to Franklin D. Roosevelt’s second term in 1936, but at especially high levels in the post-Civil Rights era beginning in 1964 with the Lyndon B. Johnson-Barry Goldwater election. Democrats’ strongest recent Black vote margins (R-D margins of -91 and -87) occurred in the two Obama elections of 2008 and 2012. And although those margins have shrunk slightly since then, they remained at a solid -73 in 2024.
Democrats’ Latino or Hispanic vote margins are not as strong as the Black margins, but have remained favorable to Democrats since at least 1972. The greatest in recent decades occurred in 2012, Obama’s second term, at -44, though remained in -30 range in all recent elections except 2004 (-9), when George W. Bush ran against John Kerry. However, it is true that Vice President Kamala Harris’ Latino or Hispanic margin of -5 is the smallest in over 30 years. Whether it represents a blip, like the 2004 election, remains to be seen.
These data show that the long-term trends of Republican favorability among white voters and Democratic favorability among Black and Latino or Hispanic voters—the two largest minority blocs—continued through this election. Democrats’ overall Latino or Hispanic support lessened noticeably, as is the case for some Black and Latino or Hispanic groups and individual states (discussed later). But the broad trends at the national level do not point to as sharp a transformation as many observers suggest.
Trump voters were far less racially diverse than Harris voters
While above examination of R-D vote margins for racial groups provides one view of how each party’s base might be changing, another is to look at the racial composition of all Trump and Harris voters. The fact that most voters overall are white means that a consistent and strong Republican vote margin among white voters along with a Democratic-leaning margin for minority groups will accentuate the differences in racial profiles of the two parties’ voters.3
The left-hand side of Figure 2 shows the racial composition of Trump and Harris voters compiled by AP VoteCast. It shows that Trump voters are far whiter (84%) than Harris voters (66%), with Harris voters made up of larger Latino or Hispanic shares and far larger Black shares. Indeed, Harris voters look more like the projected total voting-age population in 2028 and 2032 than do Trump voters. This shows that there would need to be a far greater Republican shift in minority vote margins to come close to the changing racial demographic profile of the U.S.
Vote margins by gender and education
While broad Republican-Democratic racial voting margin differences remained mostly intact in 2024, there were noticeable shifts for demographic categories within racial groups.
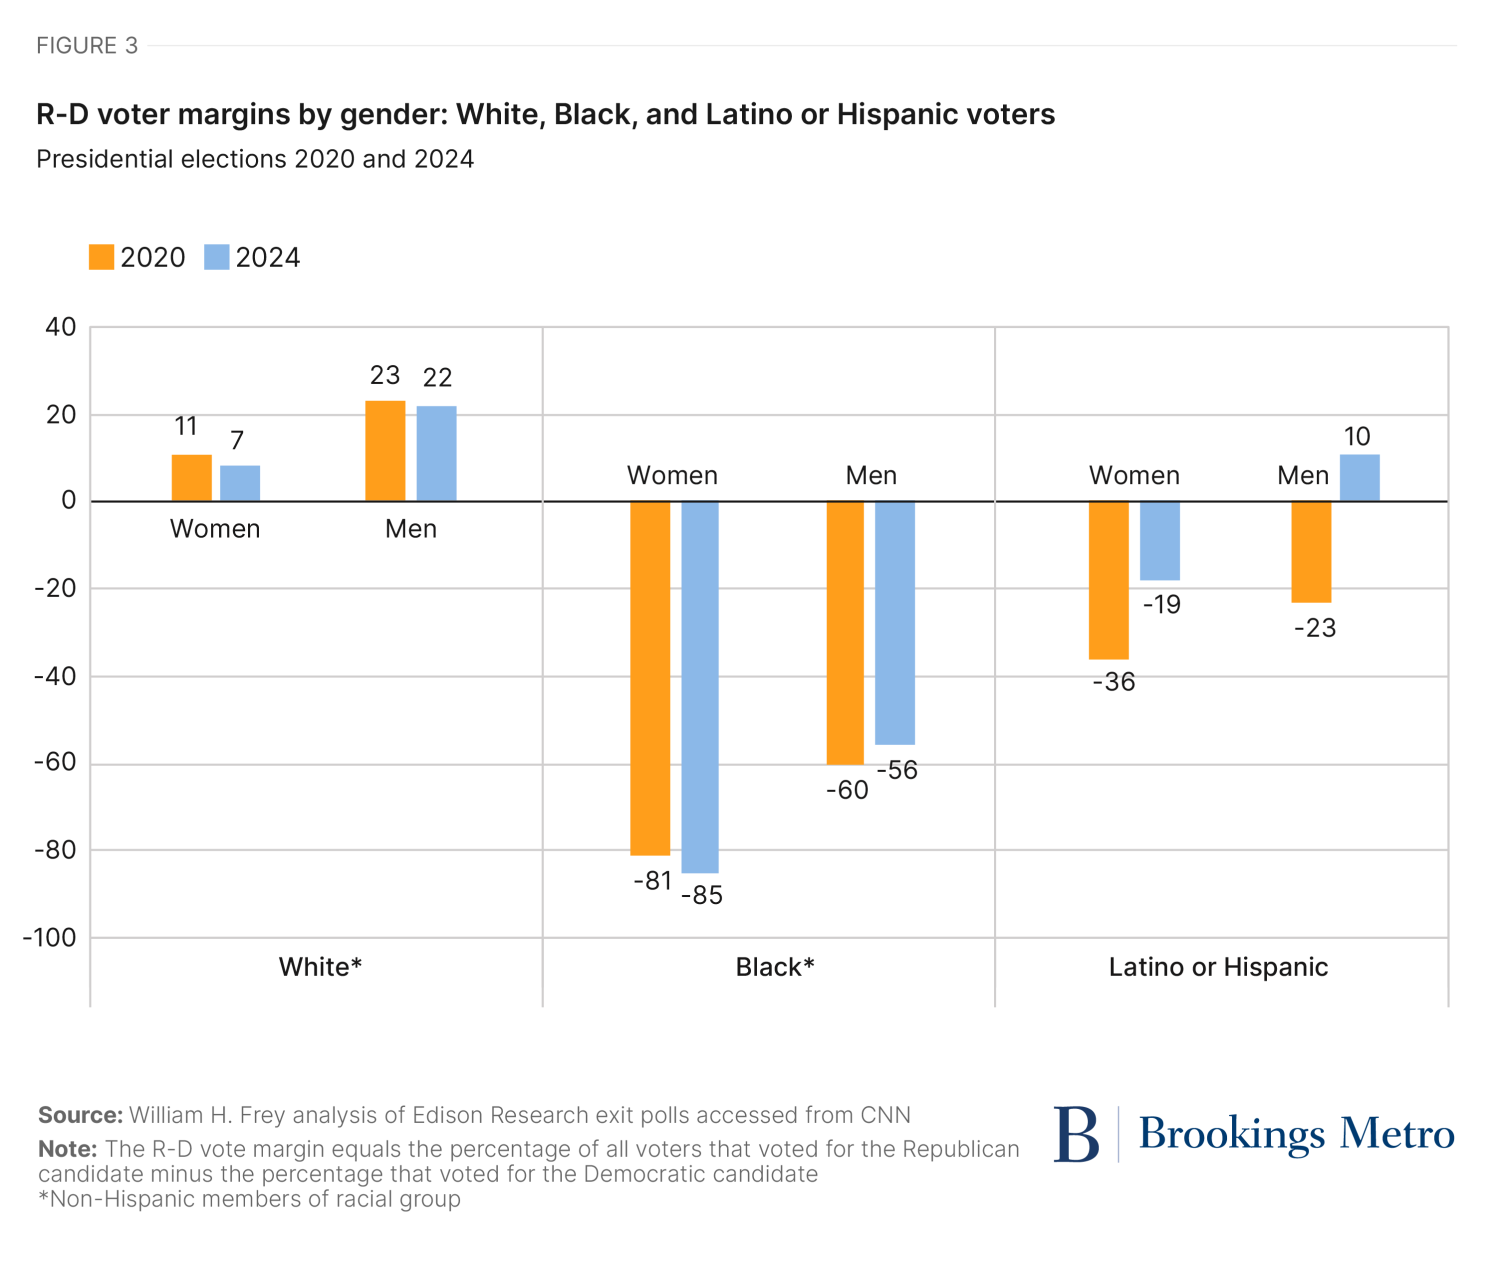
Figure 3 shows a breakdown by gender for white, Black, and Latino or Hispanic voters. Here we see perhaps the most notable shift between 2020 and 2024: the movement from a negative to positive R-D margin for Latino or Hispanic men (from -23 to +10). This is clearly a sign that there is Trump appeal for these men. And while Latino or Hispanic women favored Harris overall, that group’s R-D margin slipped from -36 to -19.
There was only a minor lessening of Democratic support between 2020 and 2024 among Black men, and a modest increase among Black women. Interestingly, among white male voters, R-D margins remained at a similar level, and white female margins declined slightly, from +11 to +7.
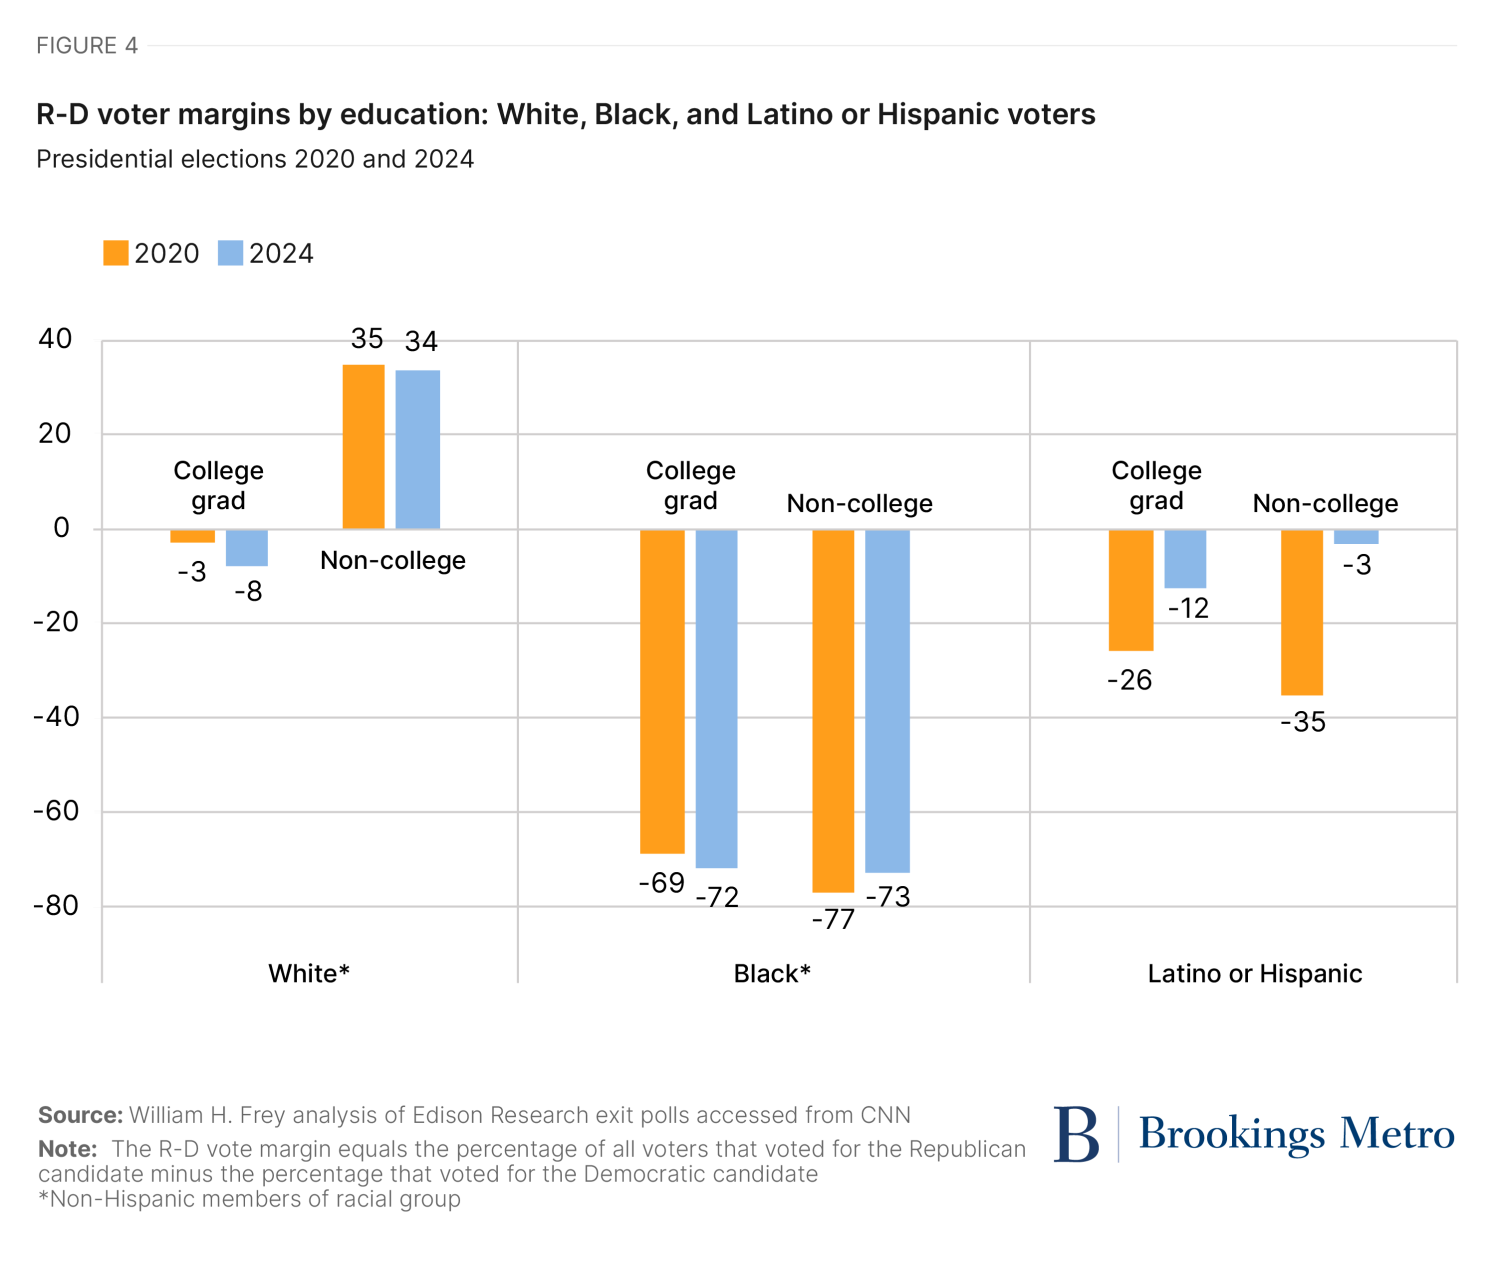
Figure 4 compares R-D margins by educational attainment; specifically, between college graduates and non-college voters for each racial group. Once again, the most dramatic 2020 to 2024 shift occurs for Latino or Hispanic non-college voters, whose Democratic support was noticeably reduced (though a sharp decline is also apparent for Latino or Hispanic college graduates). Non-college Black voters showed strong but modestly smaller Democratic support in 2024, while college graduate Black voters showed higher support. White non-college voters showed the highest support for Trump in 2024 among all racial and education groups: an R-D margin of +34, which is nearly the same level as 2020. College graduate white voters showed small but continued Democratic support, increasing in 2024.
Overall, it is clear that Latino or Hispanic support for Democrats took a substantial hit in 2024. It is most prevalent among men (who flipped to Republican support) and voters who did not graduate from college. Shifts for white and Black voters were not nearly as large.
Across states, Latino or Hispanic vote margins vary more greatly than Black margins
Given the emphasis on Black and Latino or Hispanic vote margins, it is useful to look at how they vary for specific states: a mix of some battleground states and two large, multiracial, Republican-leaning states, Texas and Florida.
In the case of Black R-D vote margins, there is a strong Democratic preference (negative margins) in each of the states examined, from a high of -79 in Pennsylvania to a low of -54 in Wisconsin. Still, most of these states showed lower Black Democratic support compared to 2020, with especially big shifts in the swing states of Wisconsin and North Carolina, as well as Florida and Texas.
Much bigger variations and swings are evident for Latino or Hispanic voters. All swing states showed declines in Democratic support, with North Carolina and Nevada moving from negative to slightly positive R-D vote margins between 2020 and 2024, and Michigan flipping from Democrat- to Republican-favorable margins in 2024. Aside from these changes, there is sharp variation in 2024 Latino or Hispanic vote margins, with Texas, Florida and Michigan markedly showing positive R-D margins and Pennsylvania, Wisconsin, Georgia, and Arizona showing negative margins. Some of this might be due to local differences in Latino or Hispanic residents’ national origins. In Pennsylvania, for example, Puerto Ricans—a group more favorable to Democrats—comprise half of Latino or Hispanic eligible voters. Yet even there, Democratic support decreased between 2020 and 2024.
A blip or a trend?
There is no question that Donald Trump did better than many expected in terms of the Electoral College (winning all swing states) and winning the popular vote (the first Republican to do so in 20 years). Yet the assertion that his gains among some subsets of Latino or Hispanic and to a lesser extent Black voters, as well as shifts in some swing states, are sufficient to predict a multiracial transformation of the GOP is open to question.
This year’s very real shift among Latino or Hispanic voters is only a bit sharper than the one observed in the Bush-Kerry election of 2004, after which more Latino or Hispanic voters returned to the Democratic fold. Indeed, the shift away from 2020 and earlier elections among more vulnerable members of these minority groups could very well be a blip that was part of a nationwide reaction to the high price of groceries, housing, and other necessities that accompanied a once-in-a-century pandemic, which led to similar rightward political shifts in other developed countries.
When voters were asked to compare their family’s financial situation with four years ago (better, worse, or about the same), 47% of Latino or Hispanic voters and 29% of Black voters answered “worse.” As Table 1 shows, Latino or Hispanic voters who answered “worse” are the only one of the three answer groups that voted Republican, and Black voters who answered “worse” showed the lowest Democratic support among these three groups too. This raises the question: Will these voters return to their historic Democratic roots as they perceive the economy to be picking up and other issues come to the fore? The Trump administration certainly has a chance to prove itself to these voters. But it is much too soon to pronounce that the GOP has undergone a multiracial transformation.
-
Footnotes
- In this post, the term, “Latino or Hispanic” refers to persons who are sometimes referred to as Latino. The terms “white” and “Black” pertain to non-Hispanic members of those racial groups.
- These statistics are based on data updated on November 25, 2024 from the CNN website and from Karlyn Bowman and Samantha Goldstein, “The Exit Polls: A History and Trends over Time, 1972–2020“
- Census Bureau Current Population Survey statistics show the following shares of 2024 eligible voters: white (65.7%), Black (12.3%), Latino or Hispanic (13.9%), and other nonwhite races (8.1%).
The Brookings Institution is committed to quality, independence, and impact.
We are supported by a diverse array of funders. In line with our values and policies, each Brookings publication represents the sole views of its author(s).


