
The STEM teacher workforce is facing strong headwinds. The pipeline of new teachers has been struggling to meet demand, and many schools have reported difficulties in staffing STEM positions. Staffing pressures for STEM teachers have been increasing on multiple fronts: dwindling cohorts of graduates from teacher training programs, more classes to cover due to increased STEM requirements in the high school curriculum, and growing compensation for STEM degrees outside of the classroom luring teachers away.
These STEM staffing challenges are thought to hit socioeconomically disadvantaged schools hardest. Prior research has documented how teachers sort across schools, toward more affluent student populations and the resources available there. Consequently, schools with the greatest needs often have teacher workforces that are, on average, less experienced, qualified, and effective. Combining these parallel trends of a weakening pipeline for STEM teachers in general with sorting pressures driving them away from high-need schools, we suspected that STEM teaching in high-need schools may be growing progressively weaker over time.
In a recent study, we took a step back and examined how the demographics and qualifications of the STEM teacher workforce in high-need schools have shifted over the last 30 years. Using a series of nationally representative samples from the Schools and Staffing and National Teacher and Principal Surveys, we focused on how STEM teacher characteristics have evolved in high-need settings, comparing them against both STEM teachers in low-need settings and non-STEM teachers in high-need settings. High-need (and low-need) settings in our analysis are schools in which the share of students eligible to participate in the federal subsidized meals program puts them in the top 25% (or bottom 25%) of all schools for a given year. Since our focus is specialized STEM teachers, we examined only those who teach secondary grade levels (7th grade and above), where subject specialization is the norm. What we found was unexpected and counterintuitive: The STEM teacher workforce in high-need schools has been surprisingly resilient despite increasing staffing pressures over the last three decades, with some exceptions.
Demographic characteristics
We begin by looking at demographic trends among STEM teachers. Research shows that students tend to do better when exposed to at least some teachers who share their racial background, and all students do better when they are exposed to a diverse set of teachers. A similar matching argument along gender lines has also found support in STEM subjects, where girls in high school and college taught by women in STEM subjects help them see it as a viable field of study. By way of background, individuals studying STEM field majors in college and pursuing STEM occupations in the workforce have historically been disproportionately men and white or Asian; promoting greater participation in STEM among underrepresented groups (women, Black, Hispanic, and Native Americans) is a policy priority.
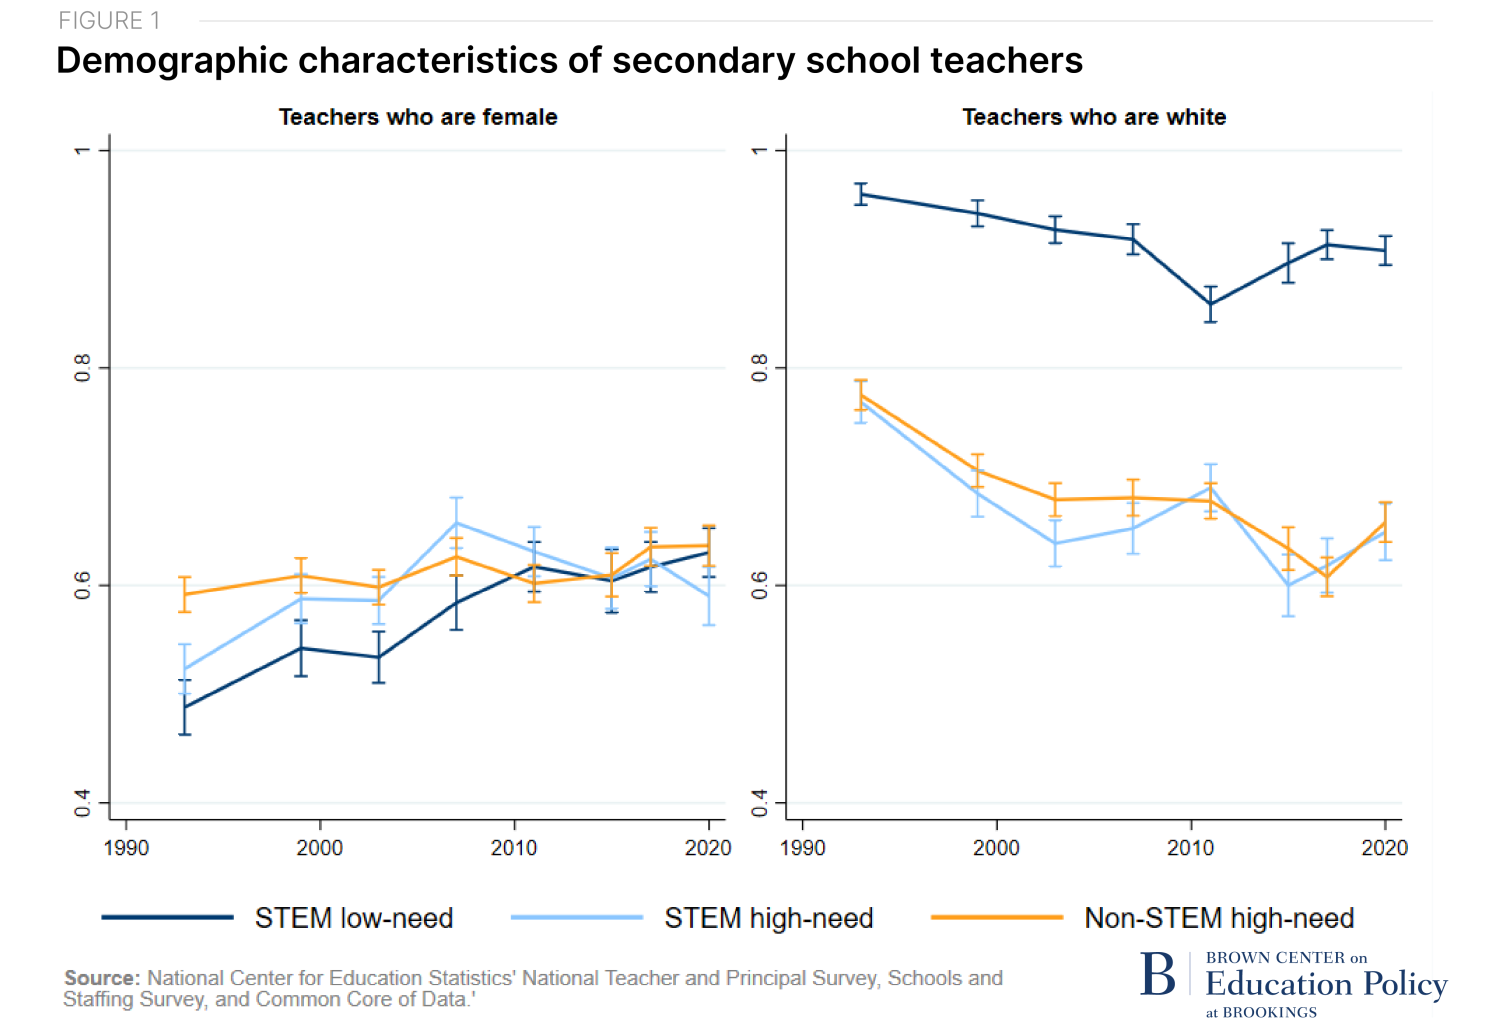
Figure 1 provides an overview of the evolution of the demographic characteristics of secondary STEM teachers in high-need schools (light blue line), compared against STEM teachers in low-need schools (dark blue) and non-STEM teachers in high-need schools (goldenrod). The STEM teacher workforce generally has slowly grown more female (on the left panel) and less white (on the right) since the 1990s.
On gender, STEM teachers in high-need settings previously (before 2010) had higher female shares than those in more advantaged settings, though these attributes have converged over time. Now, the proportion of female STEM teachers is about 60%, with small and non-significant differences across school settings. Looking at race, the shares of white teachers in all groups have been declining roughly in parallel (aside from a brief converging blip just after 2010). Race differs significantly across school settings, with a gap showing greater white teacher representation in low-need settings; this gap might be slightly increasing with time and now stands at nearly 25 percentage points. These STEM workforce trends are generally consistent with other work documenting similar demographic shifts in teachers across the workforce broadly.
STEM teacher qualifications
Next, we explored how the qualifications of STEM teachers have changed since the 1990s. Prior work shows teacher quality matters and that teachers are the primary school input affecting student outcomes. Our survey data cannot be readily linked to student outcomes, though we can look at other qualifications that are (modestly) associated with teacher quality. Teachers’ performance improves as they gain years of experience, and traditionally certified teachers tend to be slightly more effective than those entering from alternate routes. The value of obtaining a master’s degree is less clear, though studies have found that teachers with credentials, degrees, and experience aligned to the subject they teach provide a boost to student achievement (a boost that is especially evident in STEM subjects).
Figure 2 shows trends in the proportion of teachers with more than three years of experience, full certification, a master’s degree, and a master’s or bachelor’s major in a STEM field.
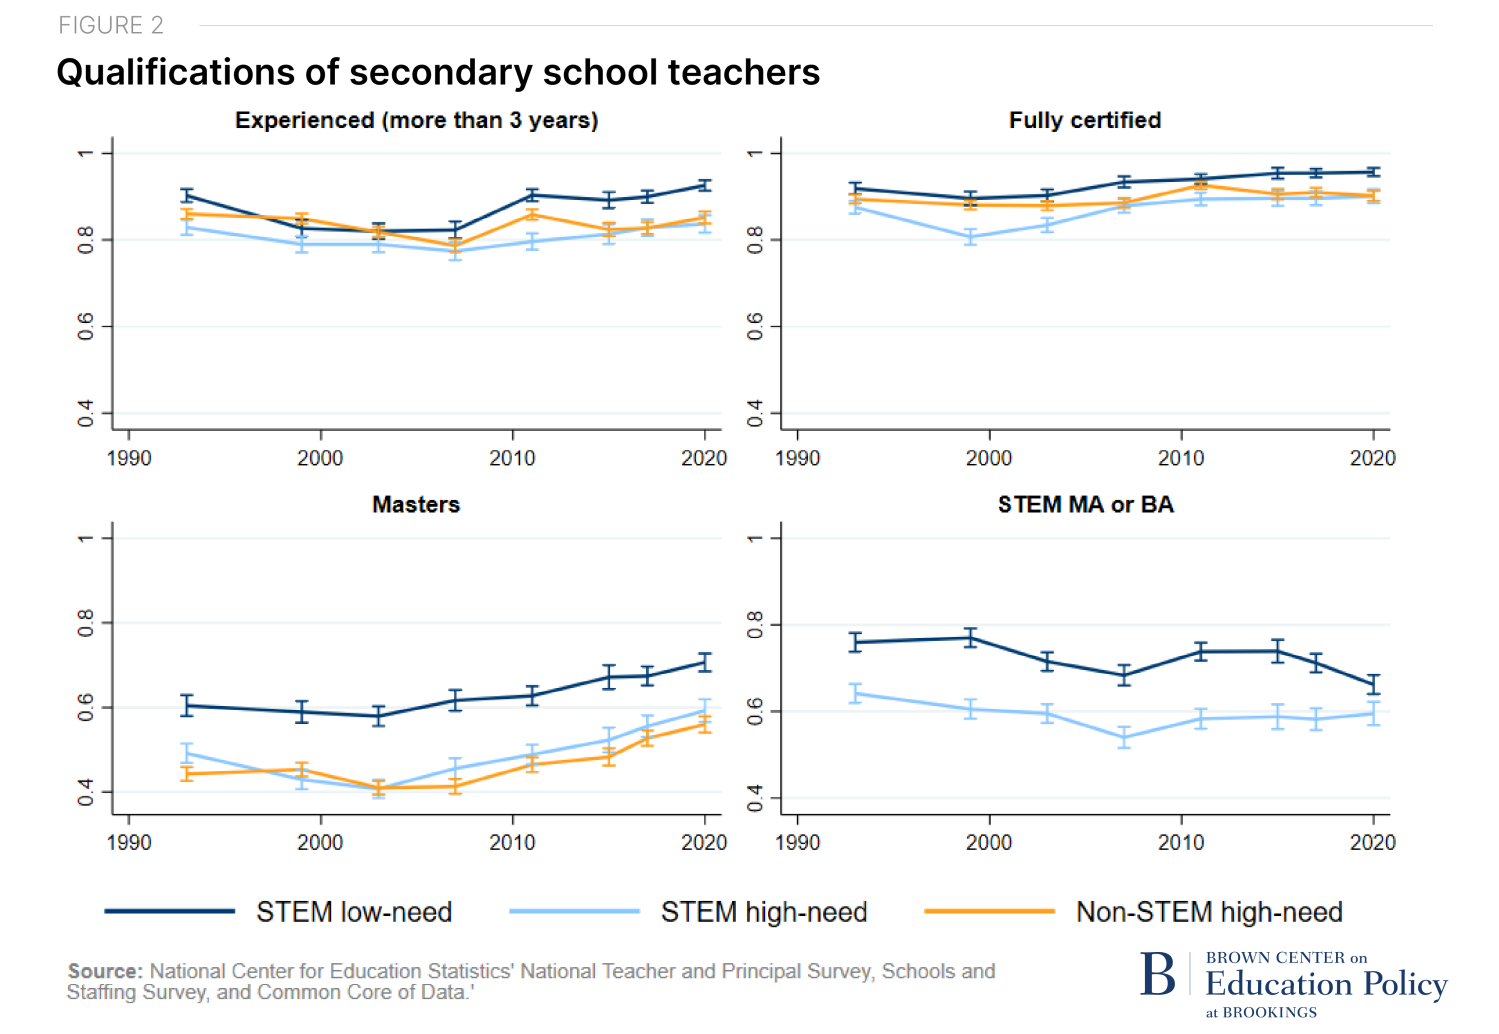
We see relative stability among STEM teachers in high-need schools over this period. Qualification levels have even increased in terms of holding a master’s degree (though note the lack of a corresponding shift in the STEM BA or MA graph, suggesting the growth in master’s degrees are likely not in STEM subjects). The share of STEM teachers in low-need settings holding a STEM degree has significantly declined over time; the declines in high-need settings are smaller and not statistically significant. This relative stability in the level of qualifications in high-need schools—despite the pressures the STEM teacher workforce has faced over time—perhaps comes as a pleasant surprise.
This does not mean that the STEM teacher workforce is healthy. For instance, note that STEM teachers in high-need settings are consistently less qualified than those in low-need settings across all these measures. Using the non-STEM teachers (goldenrod line) as a point of reference, the gaps in qualifications appear to be driven more by setting rather than whether a teacher works in a STEM or non-STEM field.
Alignment of academic background and teaching fields
Digging deeper, we investigated the alignment of a teacher’s academic background and credentials with the specific STEM field they teach. To analyze this issue, we explored the various fields within STEM rather than simply looking at a STEM / non-STEM binary. This step is important, as prior work shows science courses are significantly more likely to be taught by teachers holding an out-of-field certification. Previous research has suggested that content knowledge pertinent to the field a teacher is engaged in boosts student performance, particularly in math. Others have found that teachers with higher cumulative years of experience in their subject matter (based on credentialing and educational attainment) had a positive effect on student educational attainment.
We analyzed the field-specific alignment for the STEM teachers in our sample. For any teacher leading a course in these fields, we flag whether that teacher has: 1) academic training in the field (MA specialty or BA major or minor), 2) state certification in the subject, or 3) both academic training and certification. Figure 3 depicts the proportion of teachers whose degrees and certification align with the subjects they teach for biology, physical sciences, math, and computer science. The rate of out-of-field teaching varies significantly by field, where physical sciences and computer science show the highest rate of out-of-field teaching, with 45% and 57% of teachers, respectively, having no subject-specific credential in 2020. This is juxtaposed against 25% and 34% of teachers in math and biology, respectively. These differences in qualifications across fields (keeping school settings constant) are larger than the differences we observe across school settings (keeping STEM fields constant). This suggests that a field-specific approach to supporting the STEM teacher workforce may be valuable to improve the teacher pipeline.
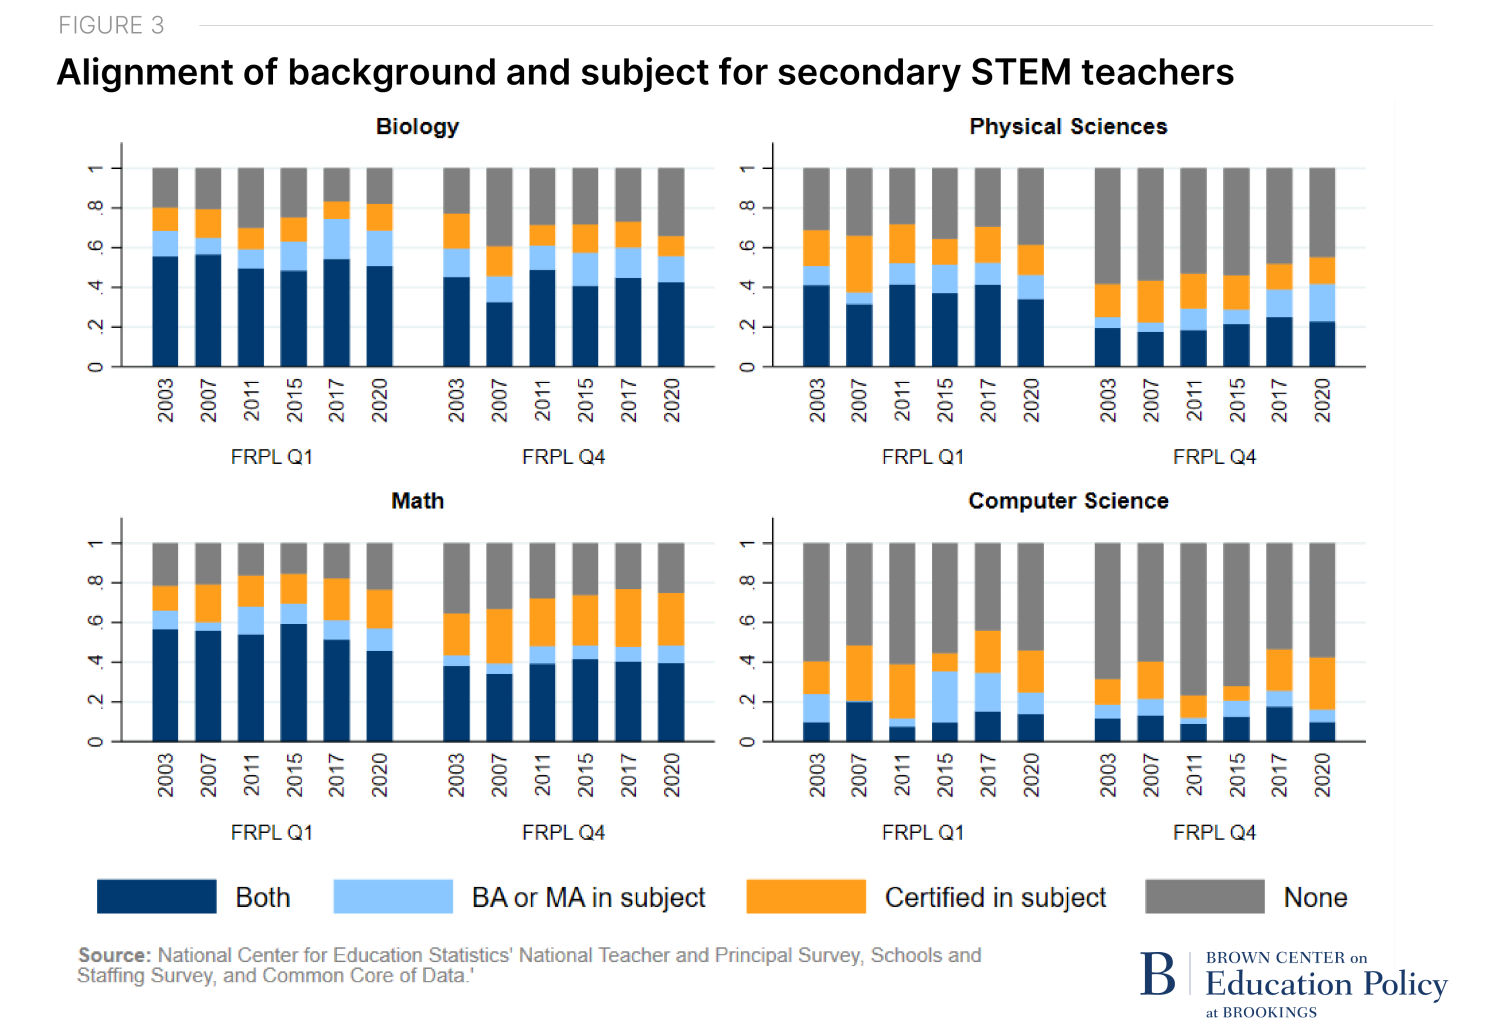
There are some positive trends that can be gleaned from Figure 3. For example, the proportion of teachers with no subject-specific background in high-need settings (FRPL Q4) has decreased in three of four STEM fields (excluding biology) over the last decade. Though, it is striking that over 20% of math teachers (a basic core subject that all students must take) in low-need settings (where staffing pressures are least severe) have neither a degree nor certification in the field.
Conclusion
Our study of the STEM teacher workforce in high-need settings and its evolution over the last three decades has some surprising, positive findings. The levels of teacher qualifications are either stable or slightly improving for most measures considered, with some qualification gaps between high- and low-need schools slightly narrowing. However, our findings are not all good news. The remaining gaps in some qualification measures are still quite large, and the lack of academic background and credentialing alignment in physical and computer sciences (across both high- and low-need settings) are a weak point of the nation’s STEM workforce.
The teacher workforce has been challenged in recent years, and high-need schools often struggle the most when staffing challenges are acute. Our evidence indicates that the STEM teacher workforce has shown resilience despite these mounting pressures. Or, alternatively, perhaps the persistence in the face of these challenges might be due to the many public and private initiatives aimed at shoring up the STEM teacher workforce, especially in high-need settings. Though the current study does not shed light on why the workforce is so resilient, it does offer reason for both encouragement and continued vigilance about this crucial segment of the teacher workforce.
Related Content


Authors


-
Acknowledgements and disclosures
This material is based upon work supported by the National Science Foundation under Grant No. 1950292, 1950284, 1950013. Any opinions, findings, and conclusions or recommendations expressed in this material are those of the author(s) and do not necessarily reflect the views of the National Science Foundation.
The Brookings Institution is committed to quality, independence, and impact.
We are supported by a diverse array of funders. In line with our values and policies, each Brookings publication represents the sole views of its author(s).