

This piece summarizes findings from a research paper by the authors, published here.
The United States seems unusual among wealthy and middle-income countries. It has had consistently high economic growth for the past three decades (the 2008 global financial crisis excepted), yet consistent declines in well-being: in life satisfaction, hope, trust in others, and self-reported health.
This pattern runs counter to a core tenet of neoclassical economics: that higher income allows people to achieve higher levels of utility. Research has generally reinforced this, at least in cross-sectional analyses. Easterlin (1974) was among the first to show that this relationship breaks down (i.e., is not statistically significant) when comparing changes in income with changes in well-being, giving rise to the well-known “Easterlin Paradox.”
Stevenson and Wolfers (2008) later suggested that the Easterlin Paradox largely reflected the imprecision of panel analysis: income growth does tend to improve life satisfaction, aligning with the basic logic that poor people often lack quality jobs, food, healthcare, housing, education, and other factors central to wellbeing. Low or unstable incomes also limit people’s freedom to choose the kinds of lives they want, and often coincide with weak public institutions, poor infrastructure, and less public safety. Generally, income plays a role in increasing well-being by addressing some of these deficits.
At the same time, the distribution of income and related benefits can vary widely even among wealthy countries. Several scholars have explored the mediating role of other factors, such as the distribution of income and opportunities, social capital, social safety nets, and environmental quality, in both rich and poor countries.
Yet there remains debate on the income-well-being relationship, with many studies finding either that growth does not necessarily improve well-being or more nuanced patterns. Graham et al (2017), for instance, find that as China’s growth rates were among the world’s highest from 1995-2005, life satisfaction plummeted and suicides increased.
We build on this work by considering more recent data, a broader range of subjective well-being measures, and the unusual case of the United States compared with other wealthy countries. This was motivated by a recent State of the Nation Project report. That report covered many measures (such as child poverty and political polarization) and was not focused on the income-well-being relationship, but one pattern jumped out: despite higher economic growth than most other wealthy economies, the U.S. has worsened over the past two decades on almost every available subjective well-being measure: life satisfaction, depression, emotional support, trust in other people, and trust in institutions.
Our recently published analysis tested whether these declines make the U.S. an outlier internationally, a question that matters for understanding progress in terms of people’s lives, not just economic output. We use eleven measures available in the Gallup World Poll: freedom to choose how to live one’s life, hope, life satisfaction, experiencing pain, being respected, sadness, smiling, social support, trust in the courts, trust in government, and being worried. We refer to these collectively as “well-being.”
Several of these measures are important beyond well-being itself. Life satisfaction and hope shape behavioral choices and longer term outcomes. Social support (i.e., emotional support from other people) is a key determinant of broader well-being. Trust in courts and governments reflect confidence in a country’s institutions, the same institutions necessary to address what ails us.1 Some studies even find reported well-being predicts voting trends better than standard economic explanations.
In what follows, we discuss results from panel data analysis to test whether the U.S. is an outlier in declining well-being despite rising average income, across 44 middle- and high-income countries2 using Gallup World Poll data from 2006-2024.
U.S. trends compared with the world
The results from our first analysis are depicted in Figure 1, which reports the composite measure for each country. This confirms that overall U.S. well-being has been on the decline since 2006, but it is not an outlier. Cyprus and Greece show visibly larger declines, and equal numbers of countries show statistically significant improvement (17 countries) and decline (17 countries). The remainder show no clear change.
The magnitude of the declines is non-trivial. In the U.S., the share of respondents responding positively declined by about seven percentage points, from a baseline mean of about 77%, which is a roughly 9% decline.
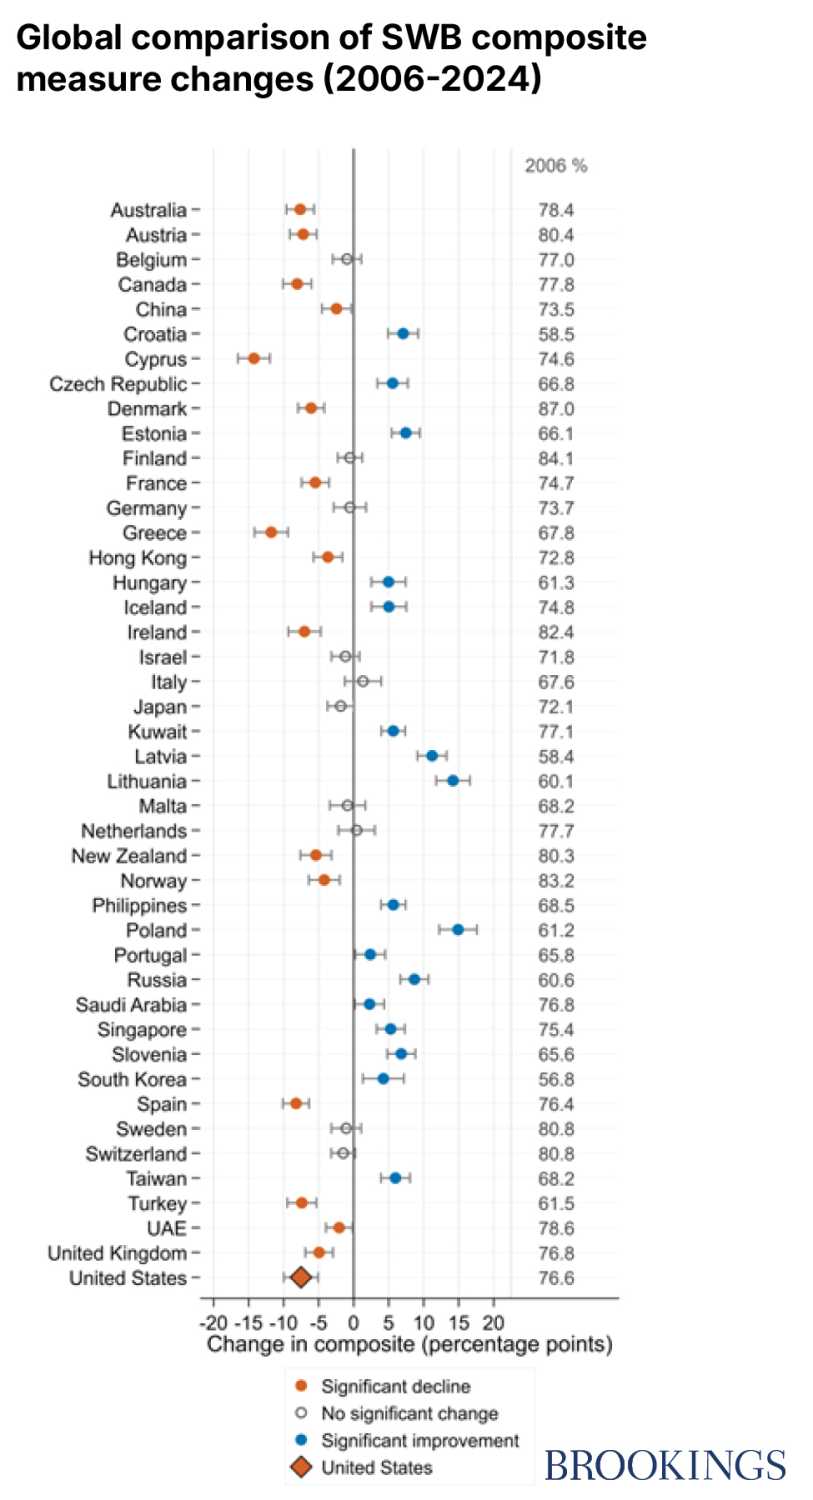
Notes: These are percentage-point changes in the within-respondent SWB composite, using the full information available for each country: baselines are the earliest feasible year (2006-2009) and endpoints the latest (2023-2024), with per-country years listed in Appendix Table 1. Solid fill marks changes whose 95% confidence interval excludes zero; the United States is the diamond. The right side of the figure reports the baseline composite level (%) as a basis of comparison. 95% confidence intervals shown.
In addition to using the full span of data available (2006-2024), we restricted to the 2016-2024 period to test whether 2006 was a fluke that distorted the trends and whether the patterns might have been driven by the 2008 Great Recession. But the downward trends are roughly evenly split between the two periods. This suggests that the downward trends are meaningful and steady across the roughly two-decade period. We cannot say whether the Great Recession was a cause. It could be that, with this economic calamity, well-being would have flattened out rather than continue its prior decline. What we can say is that other factors must have been at work; otherwise, it would be difficult to explain the decline from 2016-2024.
The well-being patterns also fit a broader convergence phenomenon: countries that started with lower well-being scores tend to improve, while countries that started higher may stagnate or decline. The term “happiness convergence” has been used to describe the closing life satisfaction gap between countries transitioning out of communism and non-transition countries. Recent World Poll rankings show a similar gradual convergence in life evaluations between Eastern and Western Europe, with several Central and Eastern European countries showing the largest gains in youth life evaluations since 2006-2010.
Our analysis provides additional evidence for convergence. The 17 countries with declining well-being are almost all Western with initial composite well-being scores in the 70s and 80s (on a 0-100 scale). The other 17 countries with rising well-being are almost all Eastern European with much lower initial composite wellbeing scores in the 50s and 60s.3 However, convergence usually refers to the idea that people at a low level have an easier time catching up, not that those doing well actually decline. The improvement in Eastern Europe might therefore be part of a convergence story, but the absolute decline in Western well-being is not, and it is the real cause for concern.
Under the surface of the U.S. data
Figure 2 takes a microscope to the U.S. and breaks the composite measure above into the separate measures. This shows the U.S. composite decline from Figure 1 is dominated by four constructs: hope (7 percentage point decline), freedom (19), trust in courts (24), and trust in government (31).
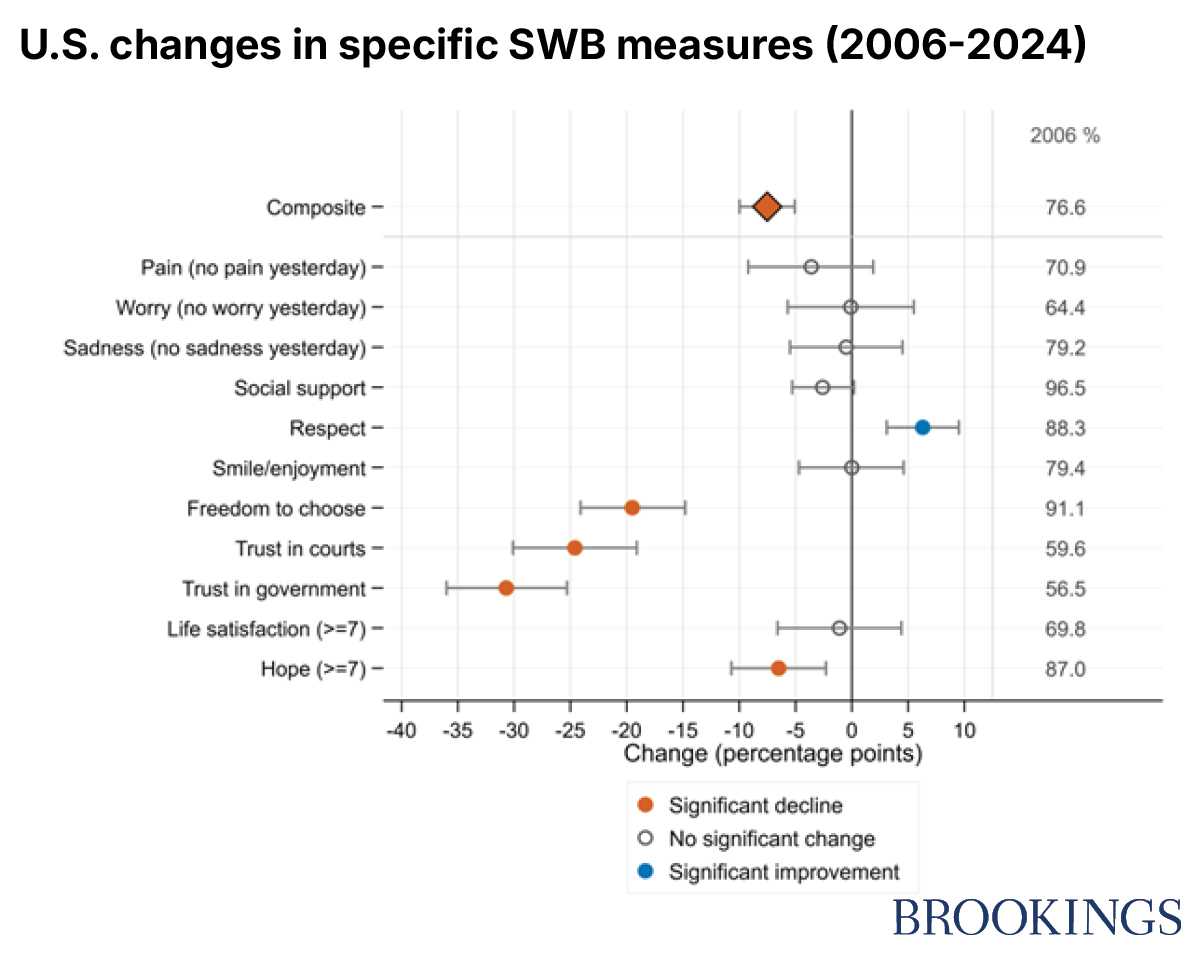
Notes: This figure shows the changes in the individual well-being measures for the U.S. only, each over its own full-information window (the literal earliest to latest fielded year; a few measures were introduced after 2006 and use a later start, with anchor years listed in Appendix Table 1). The top row is the U.S. composite, identical to Figure 1 in the main text; the measure changes are estimated separately and need not aggregate to the composite. The right side reports the U.S. baseline level (%) for each row. Fill and symbols are as in Figure 1 in the main text. 95% confidence intervals shown.
At first, the insignificant decline in life satisfaction seems to conflict with the State of the Nation Project, where we found a steeper decline in life satisfaction as well. But this seeming discrepancy reflects two different ways of reporting the data. In Figure 2, we chose to report the percentage of people with high life satisfaction (in the 7-10 range on a 10-points scale), to align with the way the other well-being measures are worded. In contrast, in the State of the Nation Project, we used the full 0-10 scale and reported the average. The fact that we see a larger decline with the full scale means that many Americans continue to be quite satisfied but that others are increasingly unhappy.
Well-being efficiency: Accounting for income
Nations also fared differently economically over these two decades, so it’s worth testing whether income growth explains the patterns above. To test this, we regress changes in each measure on changes in real per-capita income, interacted with a U.S. indicator to test whether the U.S. converts income into well-being less effectively than other countries do. We repeat this, and all the other, analyses on a composite index of all eleven well-being measures.
The interaction coefficient is negative for the composite measure and for eight of the eleven specific measures, and this holds up using a log specification of income (so it is not just diminishing marginal utility).
We emphasize that the data do not allow precise estimation of how the U.S. differs from the global income-wellbeing gradient, but the pattern is notable. Overall, the U.S. appears worse than the average country at converting income into well-being.
Trust, politics, and more
Our results suggest the U.S. is an outlier primarily for trust in courts and the government, and freedom to choose in life. The 2008 Great Recession may have been one contributor to this. This was the deepest and longest economic collapse since the Great Depression and hit Western nations hardest. In the U.S., the government’s response was widely perceived as favoring banks and large companies over the average American, and job and home losses left many with less freedom of choice.
The response to the financial crisis is likely one reason behind the U.S. decline in trust in the courts and government. That distrust, in turn, may be fueling, and being fueled by, political polarization. The United States now ranks as the most polarized democracy in the developed world. When partisans see political opponents as enemies rather than fellow citizens, that spills into how they judge the economy and their own lives, so that a large share of the population is, at any given moment, primed to see things as going badly.
The emergence of Donald Trump, who has been highly critical of the courts and the government since 2015, may have compounded this. By 2026, only 12% of Democrats were satisfied with our system of government, versus 52% of Republicans. This is the first time either party has fallen below 20%.
Longer term trends have also played a role. The U.S. has historically been seen as a land of opportunity, but we showed in the State of the Nation Project that income inequality is worsening, and the U.S. now ranks in the bottom quartile of middle- and high-income countries. Intergenerational mobility tells the same story. A 10 percentile increase in parent income is associated with only a 3.4 percentile increase in the child’s future income. Mobility and inequality are related. When gaps become too large, those at the bottom have a more difficult time breaking out of the pattern, widening gaps in children’s opportunities. Belief that hard work guarantees success has also been steadily dropping since 2001 in the U.S. We plan to test the link between declining opportunity and declining well-being in future research.
Social media and smartphone use may also be pushing well-being down globally, in part by displacing in-person interaction. Americans in particular score very low on social support and time spent socializing, and there is also now robust evidence that device use has contributed to rising loneliness, particularly among younger people, which is consistent with the sharp declines we observe in youth mental health. Social media’s link to life evaluations is stronger in English-speaking countries and Western Europe, though the World Happiness Report (2026) found this doesn’t fully explain the broader Western decline. This is a question for further research.
Other forces have likely hurt the West more broadly over the past two decades. A widening gap in opportunity and quality of life between workers with and without bachelor’s degrees, and the political backlash it has fueled, is visible well beyond the U.S. – in support for Brexit, for instance, and the return of the far right in France and Germany. In the U.S., this has coincided with a crisis of “deaths of despair” (i.e., deaths from alcohol, drugs, and suicide) that has spread from middle-aged whites to youth and minorities. Yet the effects on well-being appear starker in the U.S., likely reflecting its thinner social contract—something the unequal distribution of hope in the U.S. also reflects.
Wealthy Western countries share other problems, too: youth mental health crises (worse in the Anglo-Saxon countries), damaging social media use, weakening social ties, and eroding opportunities for workers. Addressing these problems, even where less severe than in the U.S., will improve wellbeing gains globally.
Whatever the underlying causes, this combination of rising income and declining well-being suggests a paradox of unhappy growth, with the U.S. as its most extreme case. The U.S. converts income growth into well-being gains less “efficiently” than other countries, likely reflecting rising inequality, the spread of social media, and extreme political polarization, and compounded by a deeply rooted culture of individualism and distrust of social support. As work and civic life change dramatically, the American dream cannot hold if its targets (income and societal well-being) remain disconnected.
Authors



-
Acknowledgements and disclosures
The authors would like to thank Jaxson Shealy for excellent fact-checking assistance and helpful comments.
-
Footnotes
- Trust is considered by some as a social capital variable and by others as a subjective well-being (SWB) variable. We take the latter approach as lack of trust is both a consistent driver of lower well-being and lower social capital; we do not see these as mutually exclusive.
- We initially identified the countries based on income data from the World Bank. As these national-level data cannot be used to estimate the income-well-being relationship, we used the self-reported income data in the Gallup World Poll for our analysis.
- Statistical regression to the mean is unlikely to explain this pattern because our sample sizes are large and because the regional patterns persist when we use three-year averages near the starting and ending years. We also conducted a log transformation of the income specification which makes it less likely the convergence is a spurious correlation across the measures.
The Brookings Institution is committed to quality, independence, and impact.
We are supported by a diverse array of funders. In line with our values and policies, each Brookings publication represents the sole views of its author(s).