The trustees of Medicare, four government officials and two private citizens, issue detailed annual reports on the current and projected finances of the Medicare health insurance program for the elderly and disabled. The report, which looks 75 years into the future, incorporates the latest thinking of actuaries on trends in Medicare spending.
What’s new in the July 2015 report?
Not much in the near term. The Trustees did make some technical adjustments to their long-run model that lowered projected Medicare spending, but these adjustments only affect the projections from 2041 on. By 2088, this adjustment amounts to a bit less than 1 percent of GDP.
What does the report say about the trajectory of Medicare spending over the next ten years?
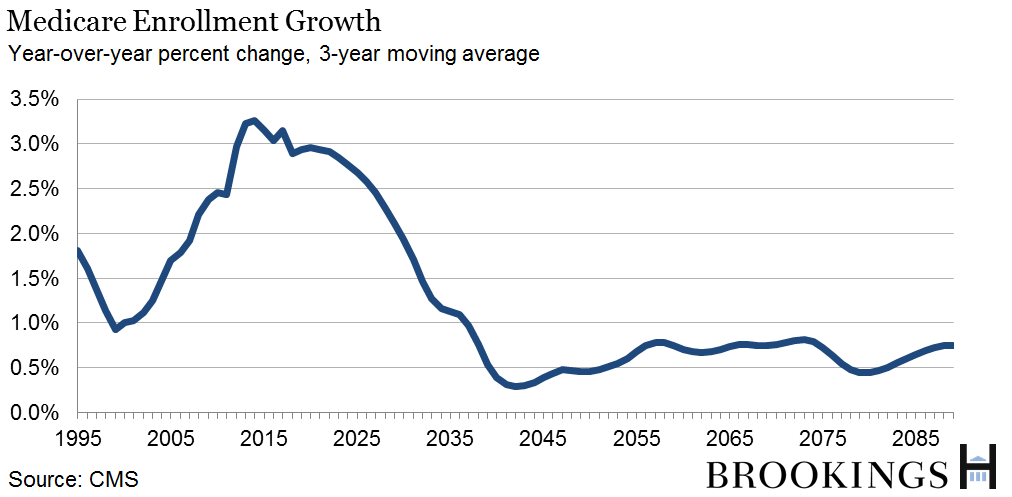
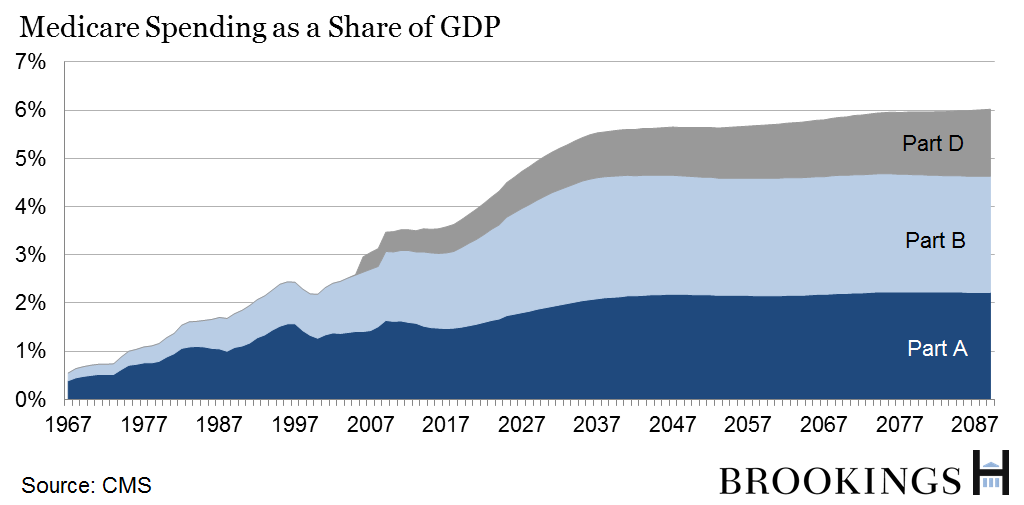
Medicare spending is projected to rise from 3.5 percent of GDP in 2014 to 4.3 percent in 2024, with the increase mostly attributable to increased enrollment as the baby boom generation turns 65.
Adjusted for inflation, spending per beneficiary rises an average of just 2% per year—about the same pace as per capita GDP growth—as reimbursement cuts under the Affordable Care Act (ACA) continue to restrain spending.
What about over the long–run?
In the longer run, the Trustees project Medicare spending to increase sharply as a share of the economy, rising from 3.5 percent of GDP in 2014 to 6 percent by 2089.
The rise in spending between 2014 and 2035 is largely driven by increased enrollment. From 2036 to 2089, spending is projected to rise primarily due to growing per-beneficiary costs.
The Medicare problem doesn’t look so bad. What happened?
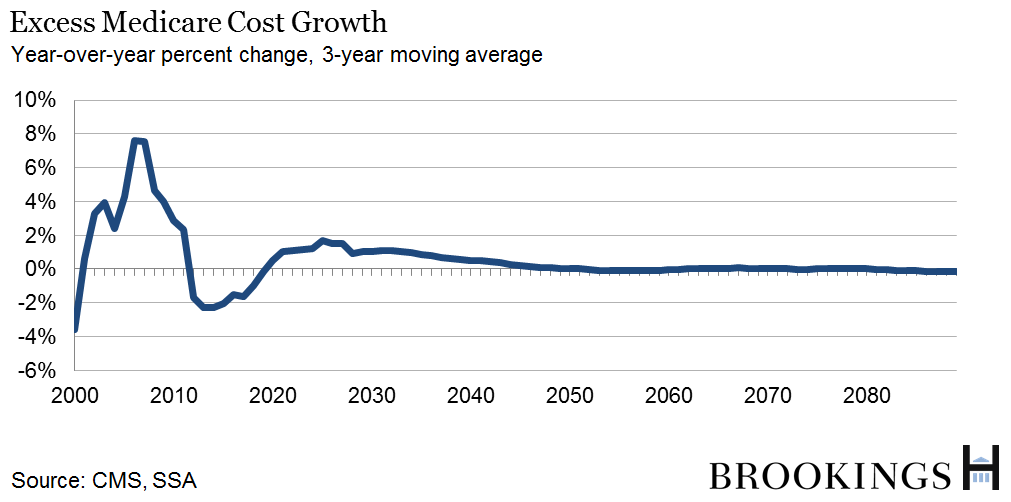
The Trustees have dramatically lowered their projections of long-run Medicare expenditure growth. In 2009, for example, the Trustees projected that Medicare spending would reach 11.2 percent of GDP by 2080—compared with just 6 percent in this year’s report. The change in the spending outlook is attributable to the effects of the ACA on provider reimbursements and a much slower rate of increase in actual Medicare expenditures since 2009. Excess cost growth in Medicare—the difference in the growth rates of per beneficiary spending and per capita GDP—is now expected to be quite low relative to historical averages.
So is the Hospital Insurance (Part A) trust fund still projected to be depleted?
Yes, in 2030—the same as in last year’s report. Medicare Part A (hospitals) is funded by payroll taxes. Because Medicare enrollment is increasing at a much faster pace than the labor force, even with relatively slow per beneficiary spending growth, outlays are still expected to outpace revenues. Part B of Medicare (doctors) and Part D (drugs) are financed by premiums and by general revenues.
What is the Illustrative Alternative Scenario, and why do the Trustees include it?
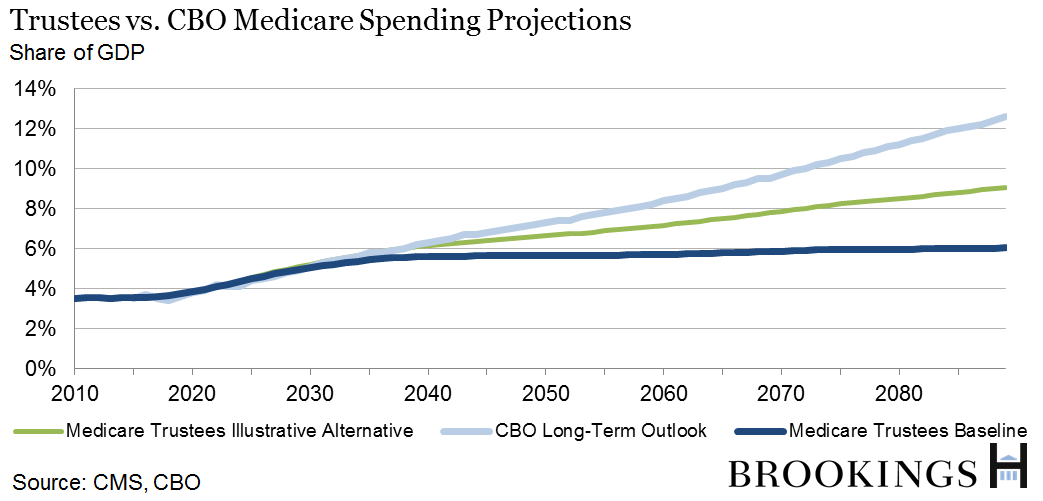
The Trustees offer an “illustrative alternative” to their baseline scenario intended to highlight the trajectory of Medicare spending under a hypothetical legislative alternative in which parts of the ACA are repealed. The Affordable Care Act included provisions that lowered the annual increases in provider reimbursements. Before the ACA, payments were to be updated each year by an amount equal to the growth of input costs (hospital wages, etc.); after the ACA, the payment update equals the growth of input costs less the rate of increase in economy-wide productivity. In addition, physician reimbursement updates were cut as part of the recently enacted “doc fix” (the Medicare Access and CHIP Reauthorization Act of 2015). The Trustees believe that, unless the health care sector manages to become much more productive over time, these payments will be too low to ensure that Medicare beneficiaries continue to have good access to health care providers. As a result, they hypothesize that future Congresses might choose to override them. Under this alternative, Medicare spending rises to 9.6% percent of GDP, about 50% higher than in the baseline scenario.
The question of whether the ACA updates are sustainable is a contentious one and depends very much on one’s view of health care productivity growth. (For more on this issue, see Louise Sheiner’s recent presentation.)
How do the Trustees’ estimates compare with CBO’s?
The Trustees and CBO have similar projections for spending over the next ten years, but they have very different methodologies for projecting Medicare spending growth in the long run. In particular, the Trustees assume that Medicare spending will rise more slowly than private health expenditures, while CBO assumes that Medicare spending will rise more rapidly. As a result, their projections diverge sharply as the horizon is extended, with CBO projecting Medicare expenditures to be more than twice as high as a share of GDP by 2089.
How much stock should I put into any of these long-term projections?
Not much after the first ten years or so. Long-term projections are inherently uncertain, and healthcare spending is particularly difficult to predict. Whether or not the recent slowdown in health expenditures will persist, the pace of technological progress in the medical field, and the effectiveness of the Affordable Care Act’s cost-saving measures can all have large impacts on long-run medical spending, but are nearly impossible to accurately predict. The wide differences between the Trustees’ and CBO’s projections highlight the enormous uncertainty of long-term health spending projections.
Who are the Trustees and how do they get appointed?
The board of trustees is a six-member body made up of four government officials—Treasury Secretary Jack Lew, Labor Secretary Thomas Perez, Health and Human Services Secretary Sylvia Mathews Burwell, and Acting Commissioner of Social Security Carolyn Colvin—along with two trustees appointed by the President and confirmed by the Senate as representatives of the public—Charles P. Blahous III and Robert D. Reischauer.


Commentary
The Hutchins Center Explains: The Medicare Trustees Report
July 23, 2015