Though many public transit systems across the U.S. have increased fares in recent years, chances are your local transit system still isn’t breaking even on your ride: According to a Hamilton Project (THP) post, of the more than 1,800 mass transit systems in the United States—including those running trains, buses, or other transport modes—only about two percent reported that fare revenue exceeded operating expenses in 2013.
And when it comes to metro rail systems across the U.S.—which include heavy rail, such as subways and elevated trains, and light rail, which operates at street level—all U.S. systems reported operating at a loss.
So just how much money are they losing? In general, average losses per trip are smaller for larger metro systems. For instance, riders in the five largest systems—New York, Washington, DC, Boston, Chicago, and the San Francisco Bay Area—pay about a dollar less than the actual cost of each trip. But when it comes to the smaller systems in cities like Seattle, Cleveland, and Pittsburgh, riders end up paying approximately four dollars less than the cost of each trip.
Overall, these 10 metro rail systems are losing the most money per passenger ride:
10. Niagara Frontier Transportation Authority (NFT Metro), NY
Average loss per passenger ride: $2.83
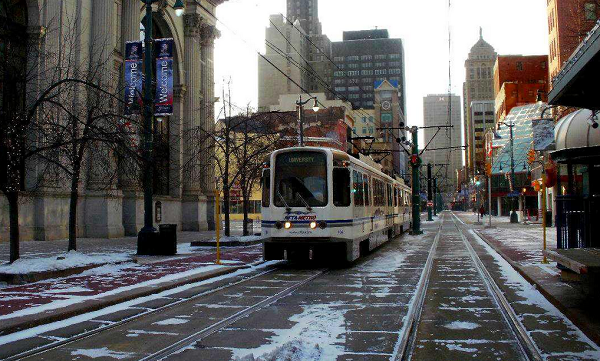
Image by Andre Carrotflower via Wikimedia.org
9. Maryland Transit Administration (MTA), MD
Average loss per passenger ride: $2.90
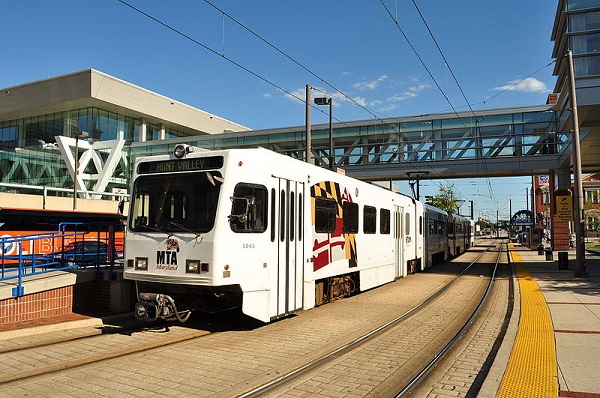
Image via Wikimedia.org
8. San Francisco Municipal Railway (MUNI), CA
Average loss per passenger ride: $3.13
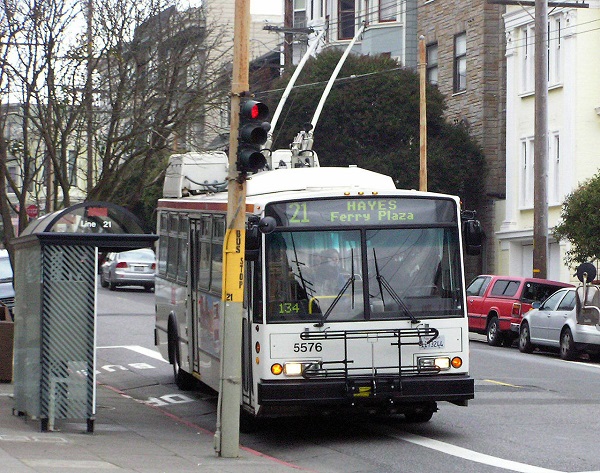
Image by Sam Bowman via Wikimedia.org
7. The Greater Cleveland Regional Transit Authority (GCRTA), OH
Average loss per passenger ride: $3.23
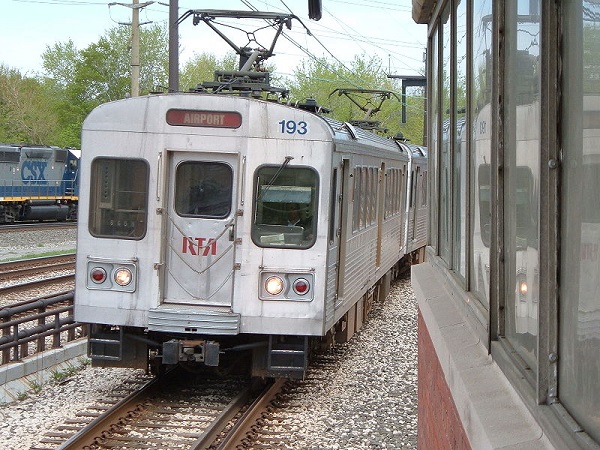
Image via
RTABus
at
en.wikipedia
6. Central Puget Sound Regional Transit Authority (ST), WA
Average loss per passenger ride: $3.91
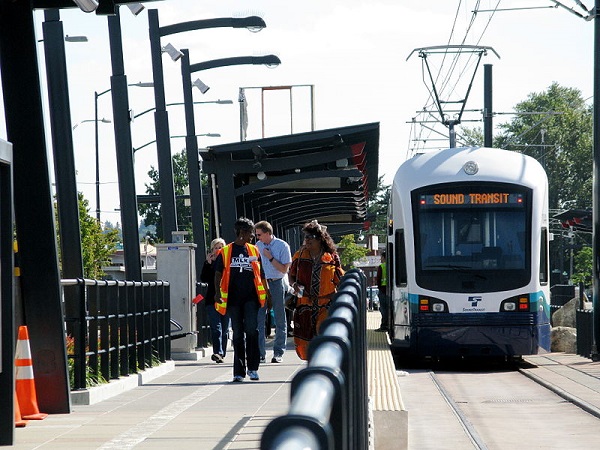
Image by Oran Viriyincy via Wikimedia.org
5. Dallas Area Rapid Transit (DART), TX
Average loss per passenger ride: $4.43
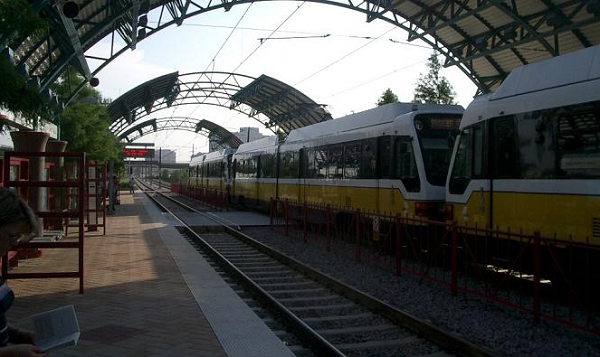
Image by DanTD via wikimedia.org
4. NJ-Philadelphia Port Authority Transit Corporation (PATCO), NJ & PA
Average loss per passenger ride: $4.47
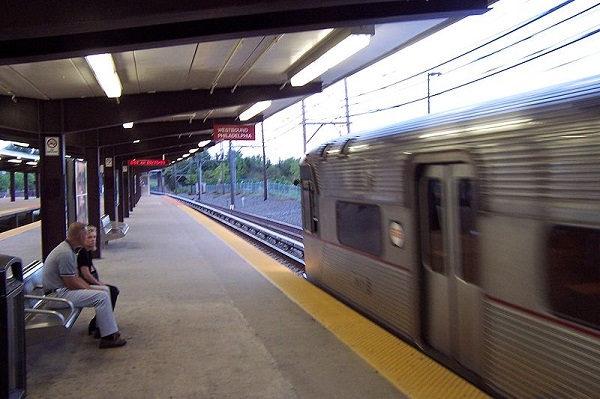
Image via wikimedia.org
3. Port Authority of Allegheny County (Port Authority), PA
Average loss per passenger ride: $5.20
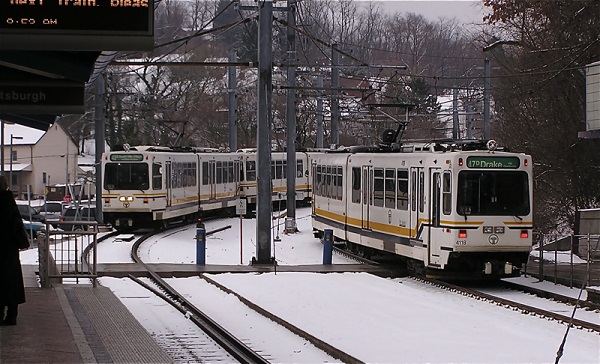
Image via wikimedia.org
2. Santa Clara Valley Transportation Authority (VTA), CA
Average loss per passenger ride: $5.53
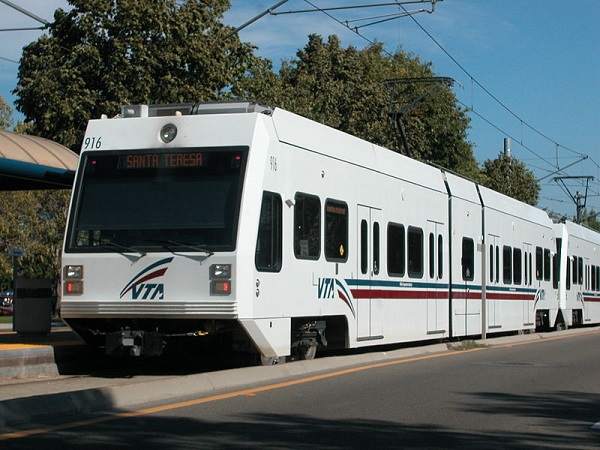
Image by Snty-tact via wikimedia.org
1. Hampton Roads Transit (HRT), VA
Average loss per passenger ride: $6.63
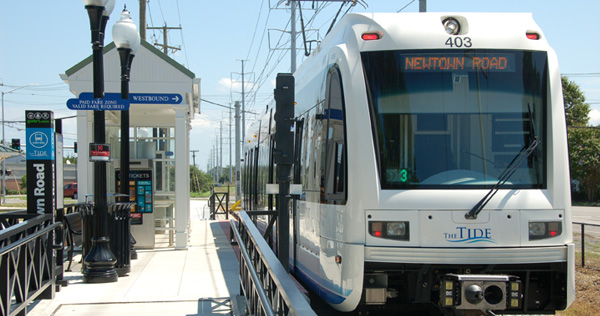
Image of Newtown Road station from Hampton Roads Transit, gohrt.com
The benefits of mass transit
Like roads, mass transit is not self-sustaining: it requires a combination of user fees and other government funding to pay for operations, maintenance, and expansion.
But according to THP’s Melissa S. Kearney, Brad Hershbein, and Greg Nantz, there is plenty of evidence that suggests government subsidies for transit might be justified: Development of transit stations has been linked to higher land values, higher office rents, and lower office vacancy rates. Mass transit also alleviates congestion for drivers. For example, a strike by Los Angeles transit workers that temporarily shut down service in 2003 resulted in a 47 percent increase in highway delays.
To learn more, read THP’s Racing Ahead or Falling Behind? Six Economic Facts About Transportation Infrastructure in the United States.
* Update: The photo for Hampton Roads Transit has been updated. Thanks to readers for comments suggesting this.

Commentary
The 10 U.S. metro rail systems that lose the most money per passenger
June 3, 2015