
Rental housing in the United States has become less affordable in recent years due to several factors, including a shift in demand for housing in the wake of COVID-19 (Mondragon and Wieland 2022). The result is low vacancy rates (i.e., the share of units available for rent without a tenant), high rent inflation, and housing expenditures that strain the budgets of lower-income households. Some of these challenges were most acute when the pandemic was at its peak, but the associated housing instability has lingered, illuminating long-term underlying issues in the rental housing market.
The very low unemployment rate and recent strength in wages makes clear that housing instability in the U.S. is, in large part, a structural problem, one that will not be fully solved by a strong economy. Fiscal support for federal housing benefits is inadequate, eligible households wait years for benefits, and the number of single individuals experiencing homelessness has risen. Any effective solution will require policy actions by lawmakers.
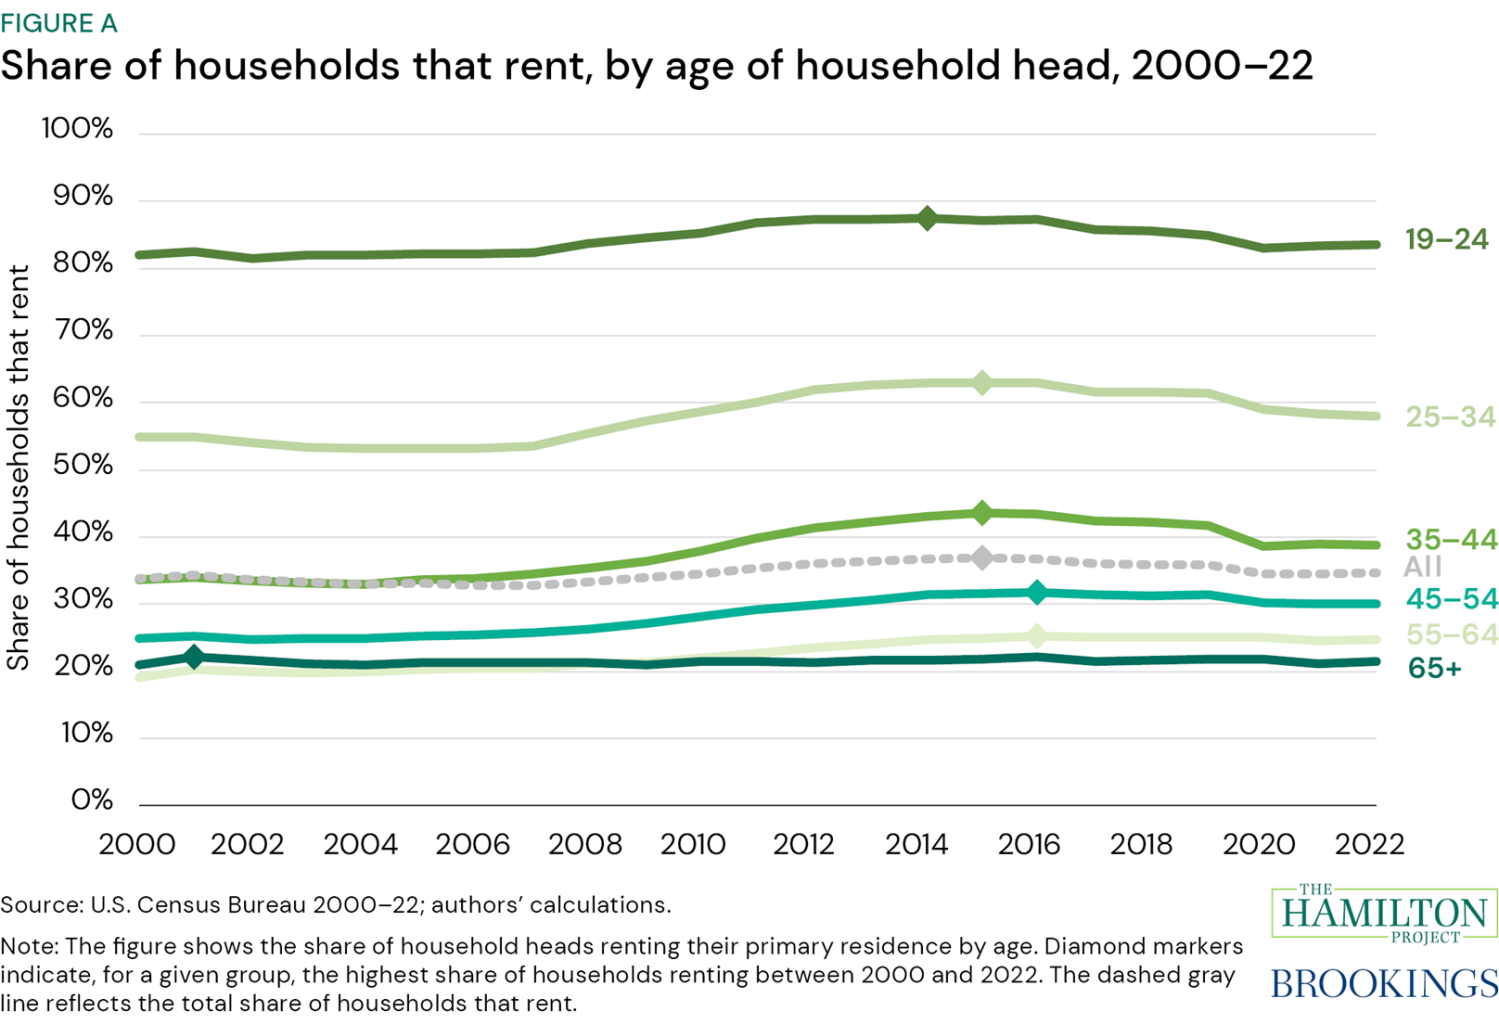
In the U.S., approximately one-third of households rent, but the share varies considerably by age of the head of household, ranging from 21 percent of households headed by someone 65 and older to 58 percent of households headed by someone ages 25 to 34 (figure A). As shown in fact 1, renting also varies considerably across the head of household’s education, income, and race or ethnicity.
The pandemic spurred consequential changes to the rental market. For example, the shift to remote work—among other factors—increased demand for homeownership (Mondragon and Wieland 2022). Simultaneously, multifamily housing starts (i.e., initiation of construction) fell sharply at the onset of the pandemic (fact 3). What followed was significantly fewer vacant units (fact 3) and a spike in rent inflation (fact 5).
More recently, housing starts, including starts of multifamily rental properties, have recovered to their pre-pandemic pace, and the national vacancy rate is rising (fact 3). Consistent with those trends, rent inflation is moderating (fact 5). At the same time, however, higher vacancy rates could be an indicator of lower economic vitality in certain metropolitan statistical areas (MSAs; fact 4). Lower economic vitality may translate to greater degrees of rent-burdened households (i.e., households that spend more than 30 percent of their income on rent). Whether a household is rent-burdened is a good proxy for whether that household is subject to housing instability, or for a higher probability of experiencing negative outcomes such as eviction and homelessness (U.S. Government Accountability Office [GAO] 2023).
The federal government funds programs to help lower-income households who face housing instability, but the funds are woefully inadequate (fact 8). Some households eligible for housing benefits spend years on waiting lists before receiving benefits, and many more households do not even make it on to waiting lists (fact 10). Relatedly, homelessness has risen notably for single adults, who can often find themselves at the back of any line of those eligible for scant housing benefits (fact 9; U.S. Department of Housing and Urban Development [HUD] n.d.a).
As many others have said, one part of the solution to the longstanding lack of affordable housing is to build more housing (Gould Ellen and Goodman 2023). But that will only address the problem over time and, in some localities, does not get to the heart of the challenge. Moreover, a stronger national labor market is helpful but might not be enough. Even now, housing instability persists in the face of a low unemployment rate and rising real wages (East, Edelberg, and Steinmetz-Silber 2023; Sarver 2023). Solutions will need to be broad-based and must recognize that millions of households with lower incomes struggle with financial insecurity in the U.S. and spend a large fraction of their income on rent with little ability to absorb negative economic shocks (GAO 2020).
-
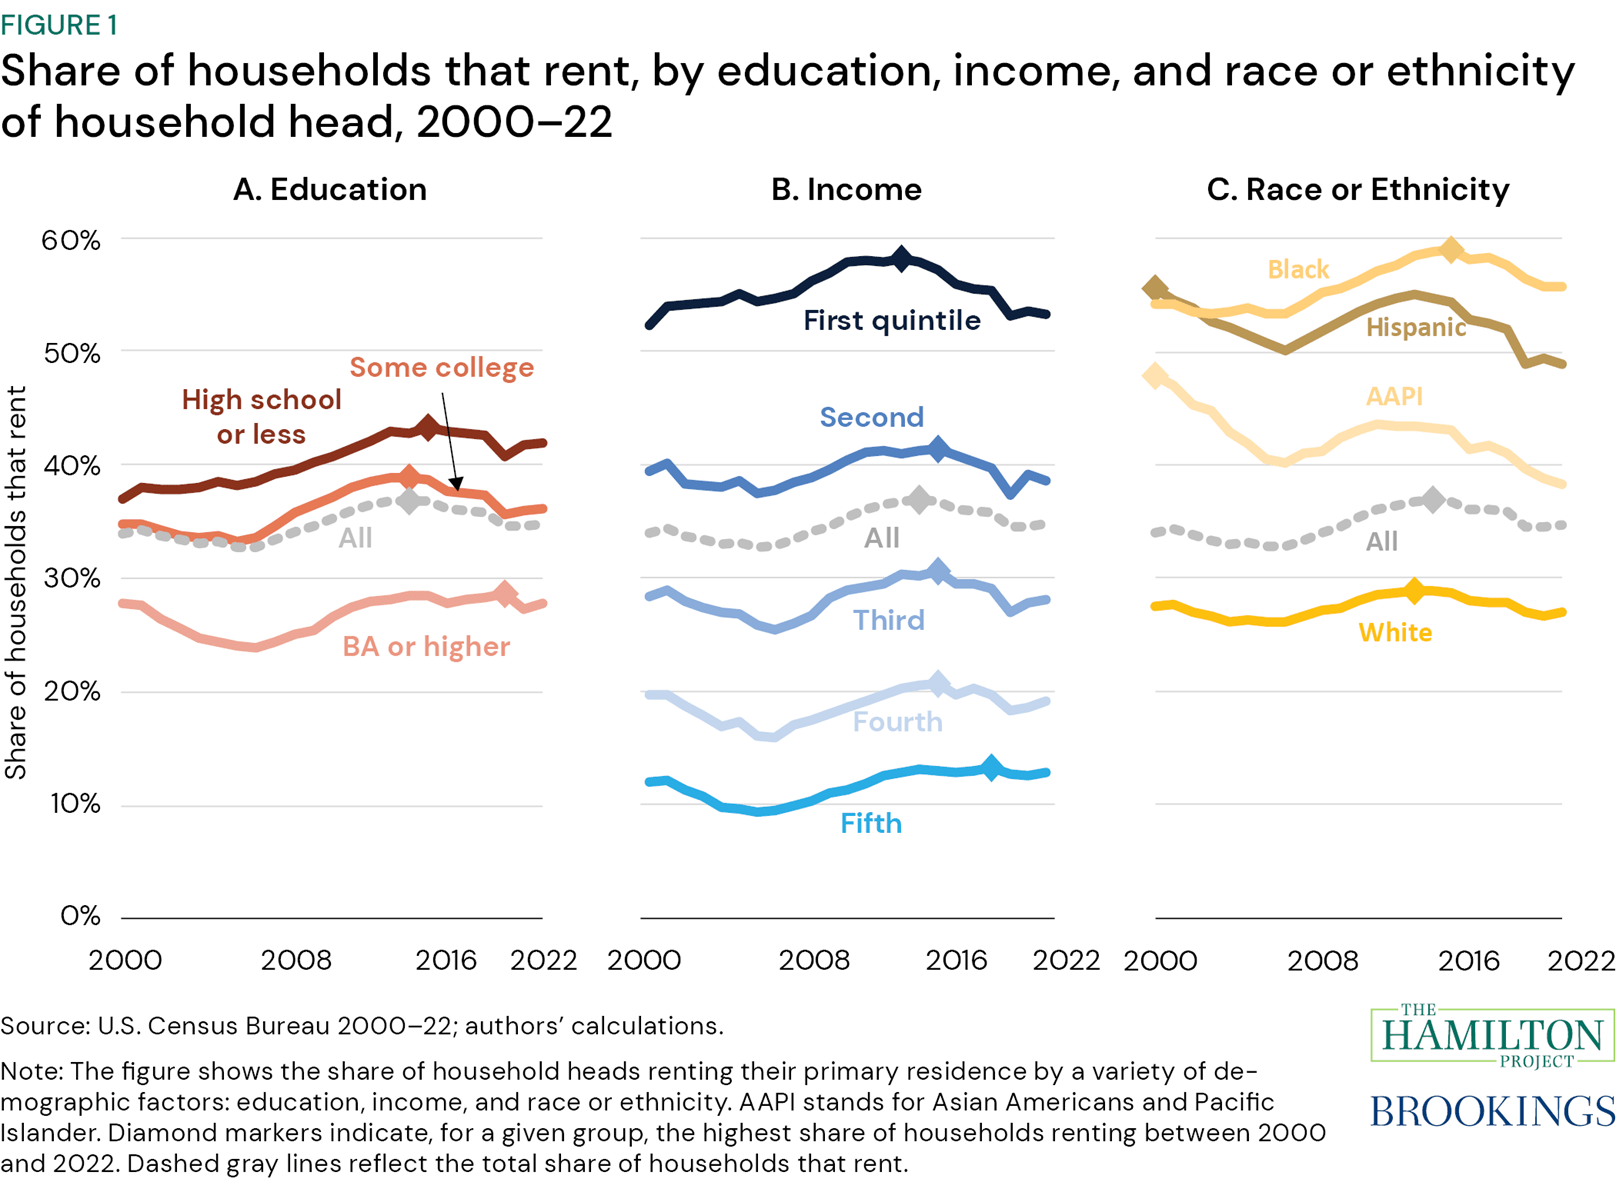
1. Households are more likely to rent if the household head has no college degree, is in a lower income quintile, or is Black.
Figure 1 shows the share of renting households from 2000 to 2022 by the household head’s education, income, and race or ethnicity. The share of households that rent and that are headed by someone who does not have a college degree (panel A), who has lower income (panel B), or who is Black (panel C) has consistently exceeded the overall share of renting households (Crump and Schuetz 2021). In 2022, 35 percent of all households were renters.
While there are differences in rates of renting by education level, there are more striking differences both by income and by race or ethnicity. Those in the bottom fifth of the income distribution (first income quintile) are much more likely to rent than those in higher income groups; in 2022, 53 percent of those with the lowest incomes rented, which was four times more than households in the top income quintile. Black individuals, who generally tend to have lower levels of income and wealth, are the most likely to rent (Derenoncourt et al. 2022). Specifically, in 2022, 56 percent of households with a Black head of household were renters compared to 27 percent of households with a White head of household.
In terms of overall rental rate trends, the period leading up to the Great Recession (between 2000 and 2008) saw a declining share of household heads renting, reflecting gains in homeownership during the housing bubble (Layton 2021). In contrast, during the period after the foreclosure crisis, which saw a tightening in mortgage standards and a reduction in homeownership, the share of all households renting increased, peaking at 37 percent in 2015 (Layton 2020, 2021). While cyclical homeownership rates are not uncommon, with rates declining during economic downturns, the increase in the share of households renting was particularly large after 2008 (GAO 2020). Indeed, as the economy continued to strengthen after 2015, the share of all households renting stabilized.
-
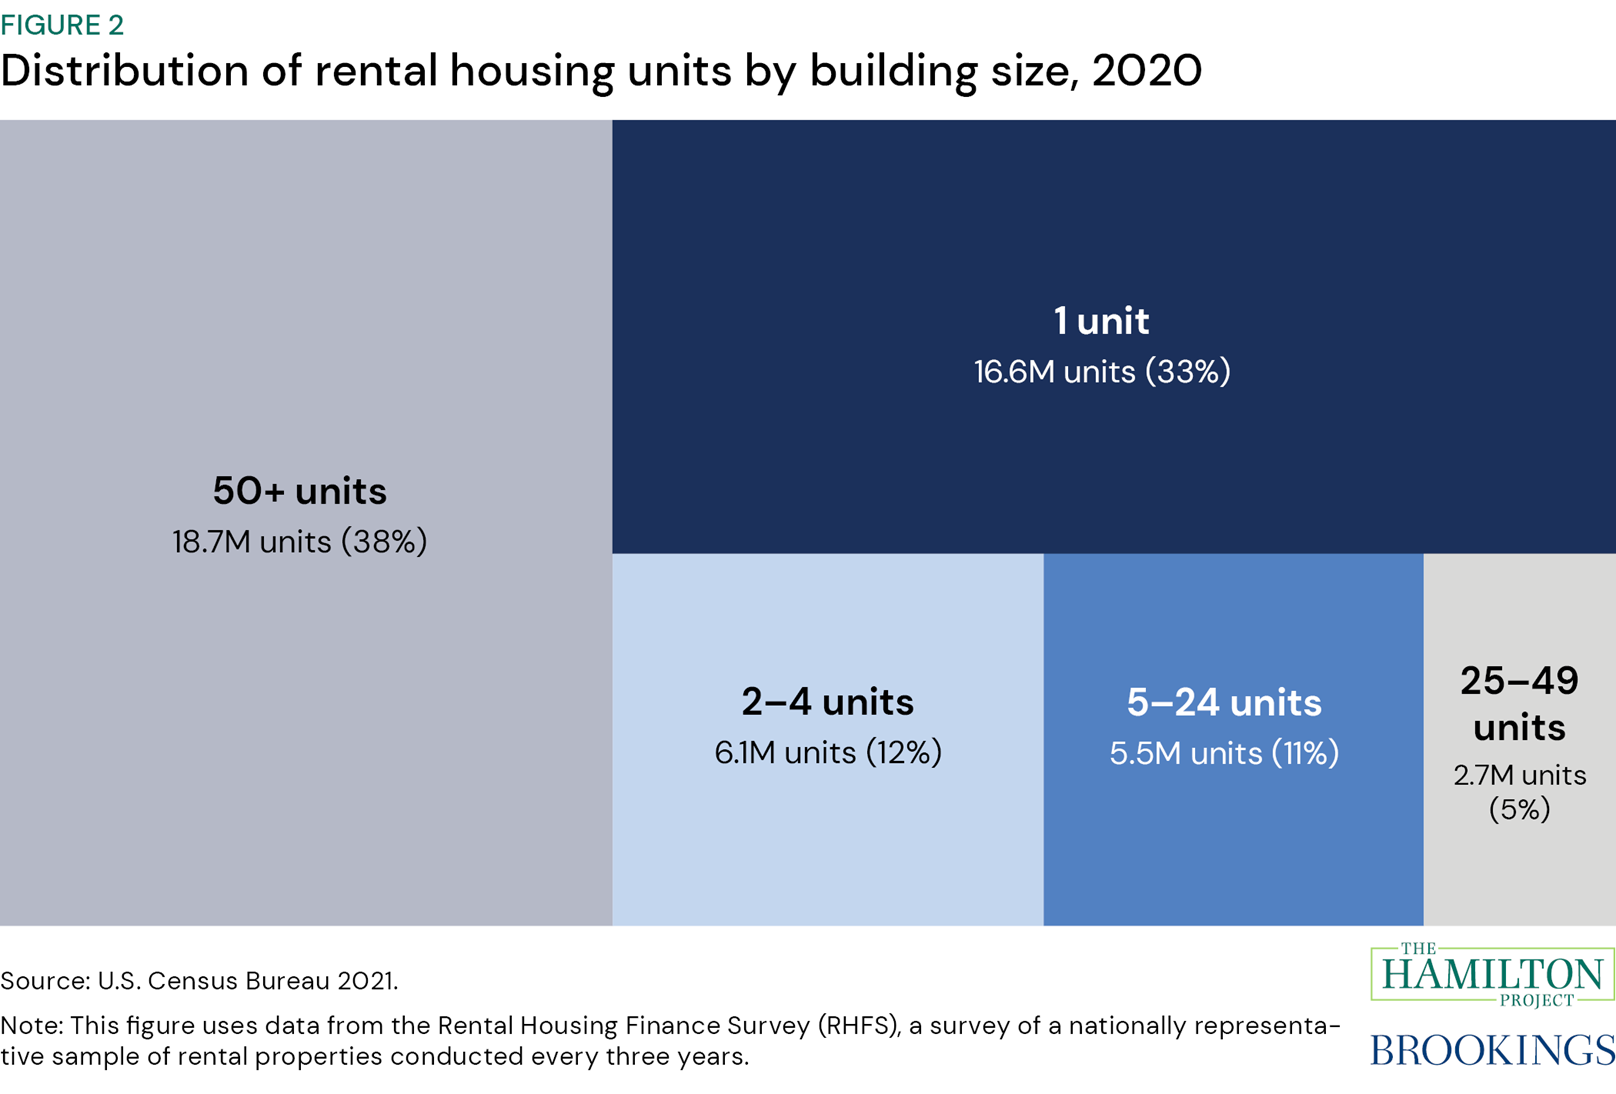
2. One-third of rental units are single-family rentals.
Figure 2 shows the distribution of rental units across the U.S. by building size in 2020 using the U.S. Census Bureau’s (2021) Rental Housing Finance Survey (RHFS). In 2020 there were somewhat fewer single-unit rental units (16.6 million) than rental units in buildings with more than 50 units (18.7 million); together those two categories represented 71 percent of rental properties. The share of single-unit rental properties was modestly lower in 2020, than it was in 2017 (U.S. Census Bureau 2018). Between 2017 and 2020, the number of single-unit rental properties shrank by around 560,000 units, or 3 percent. This shift might have been driven in part by an increase in sales of single-unit rental properties to homeowners starting in 2020, as landlords struggled to collect rent during the pandemic (Chen 2022; Conlin 2021; de la Campa and Reina 2023; Schweitzer 2020).
While institutional investors—such as Real Estate Investment Trusts (REITs), private equity firms, and other large corporations—own a small fraction of the single-family rental stock, those investors have a much larger presence in the multifamily rental market. Data from the 2021 RHFS (U.S. Census Bureau 2021) indicate that corporations own 62 percent of units in multifamily buildings, but just 17 percent of single-family rental units (Gould Ellen and Goodman 2023). Nonetheless, the business model for institutional ownership of single-family rentals has changed considerably over time (Gould Ellen and Goodman 2023). After the foreclosure crisis, distressed sales by banks and servicers allowed institutional investors to increase their holdings of single-family rental houses. Today, institutional investors rely more heavily on a build-to-rent model and partner with builders to erect large complexes of single-unit properties that are specifically designed for renters (Goodman and Zinn 2023).
-
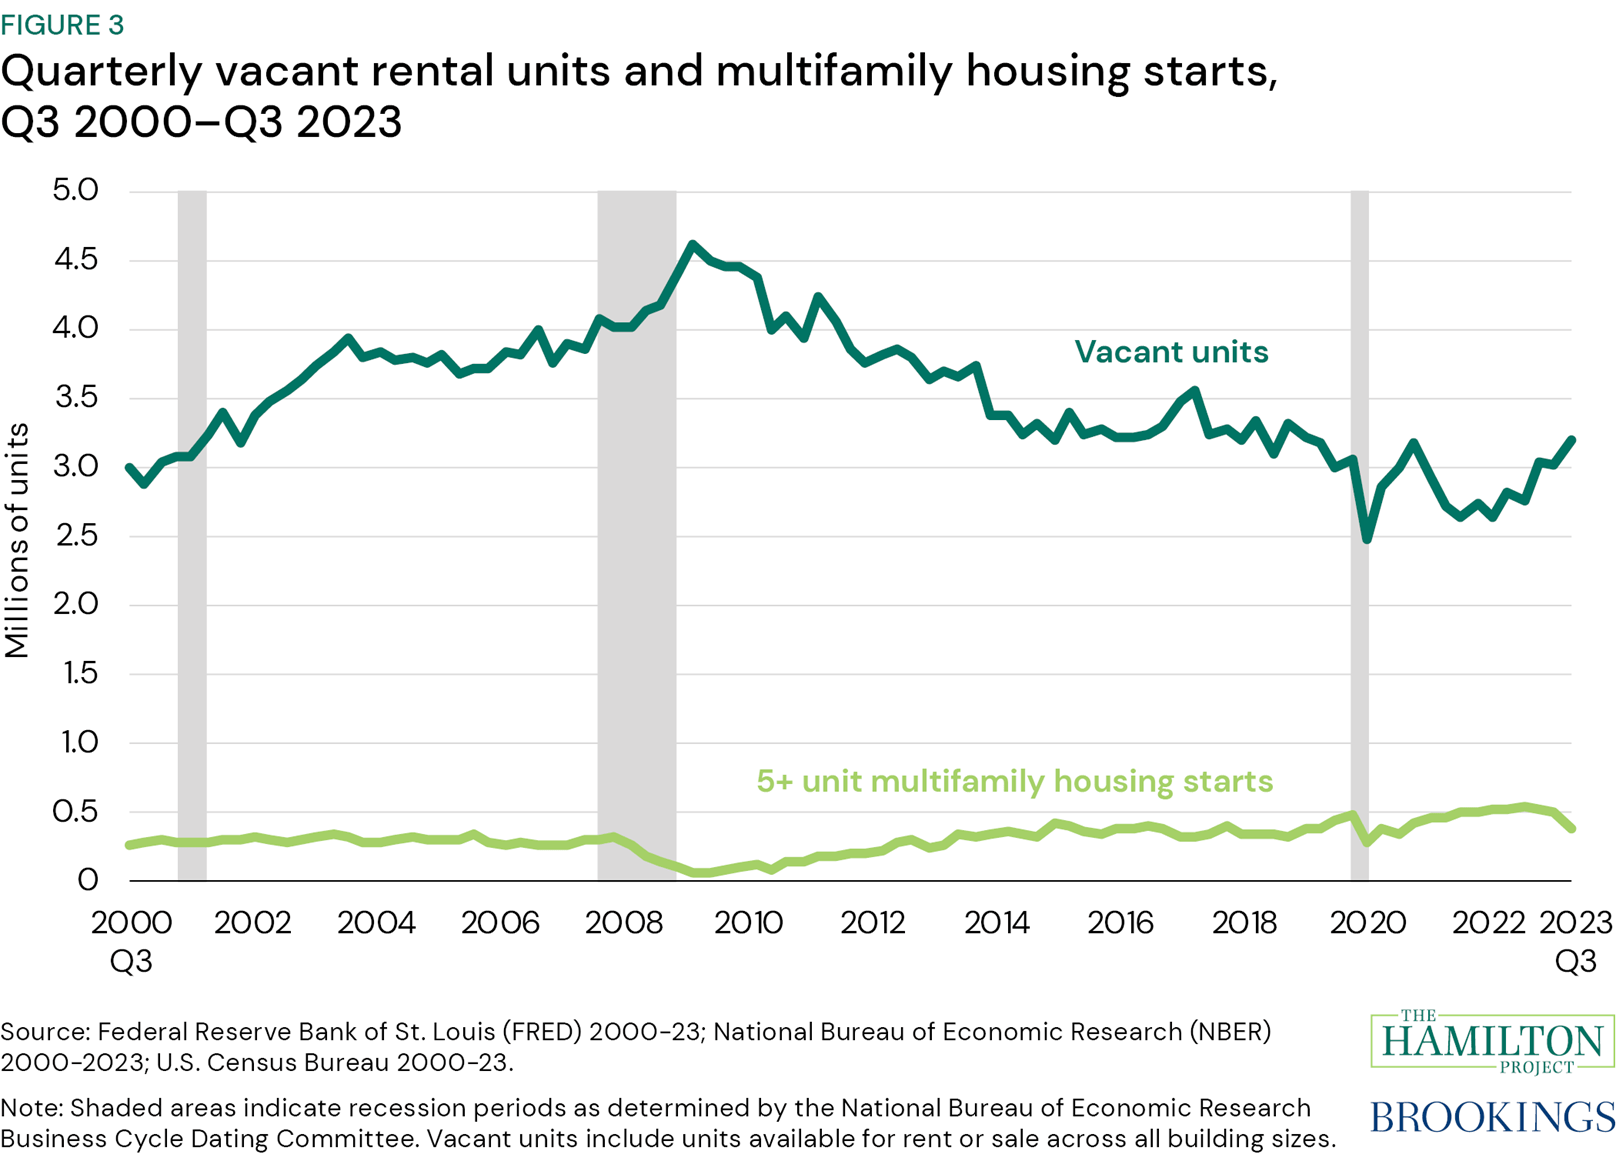
3. Rental vacancies have returned to pre-pandemic levels, while multifamily housing starts have leveled off.
Figure 3 shows both the number of multifamily housing starts (i.e., initiation of construction) for properties with five or more units and rental vacancies (i.e., the share of units available for rent without a tenant) from the third quarter of 2000 to the third quarter of 2023. As one might expect, these two indicators generally move in opposite directions: As the number of vacant rental units falls, the number of multifamily unit starts increases. For example, as vacancies soared in 2009 and 2010, multifamily housing starts declined. From 2015 to 2019 the number of vacant units hovered around 3.3 million, while the number of multifamily housing starts remained just shy of 500,000 a year.
As the pandemic shifted demand for different kinds of housing, the number of vacancies initially plummeted but then stayed at remarkably low levels in 2021 and 2022 (Van Green 2023). At the same time, multifamily housing starts rose notably starting in 2021, reaching a high of 540,000 units in 2022. In 2023, multifamily housing starts fell back to pre-pandemic levels. This reduction might have been driven by builders responding to the increase in rental vacancies by pulling back on the pace of starts as well as by an increase in building costs due to the high interest–rate environment (Joint Center for Housing Studies [JCHS] 2023a).
Although the current level of starts is relatively high, it could prove to be insufficient to meet housing demand. The level of vacancies, although up from 2022, is still very low and points to a lack of supply in housing (Congressional Research Service [CRS] 2023). Weakness in housing starts going forward could put pressure on an already tight housing market (CRS 2023).
-
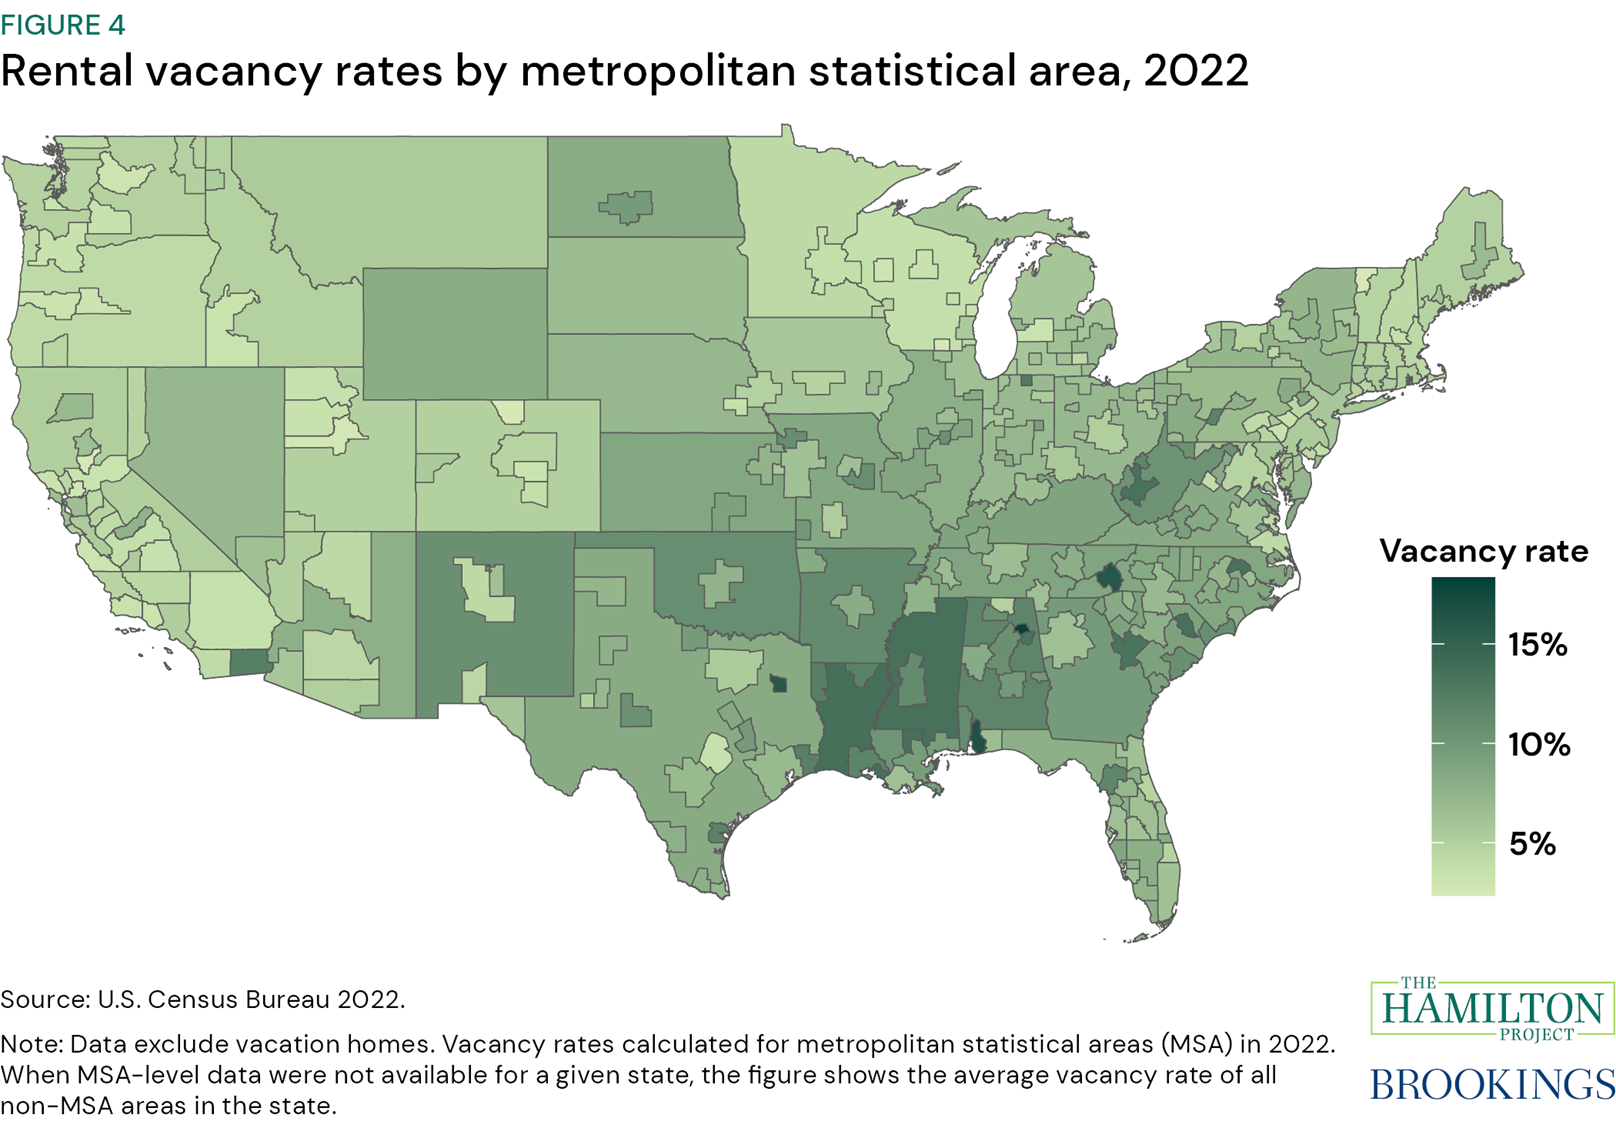
4. Rental housing vacancy rates are highest in the Southeast.
Figure 4 depicts vacancy rates, including new construction but excluding vacation homes, for MSAs in 2022. When MSA-level data were not available for a given state, the average vacancy rate of all non-MSA areas in the state was used.
In 2022 there were markedly higher vacancy rates in the South and the Southeast than in the rest of the country. Markets with high vacancy rates are susceptible to increased long-term vacancies, which could be due to either excess supply or lack of demand (Molloy 2016). When they are geographically concentrated, high vacancy rates can also be a leading indicator of housing blight as well as, potentially, fewer opportunities and lower economic vitality (Berland 2022; Newman et al. 2019; Nunn, Parsons, and Shambaugh 2018). Certain demographics are more likely to be represented in areas with high vacancy rates; in particular, high vacancy rates are associated with a higher representation of Black residents, higher poverty, and lower levels of educational attainment (Berland 2022; Schwarz, Berland, and Hermann 2018).
As shown in fact 3, a low vacancy rate indicates an insufficient supply of rental housing; lower vacancy rates are more likely in higher productivity places (Chapple et al. 2022; CRS 2023; Shoag 2019). In highly desirable areas, lower vacancy rates may indicate excess demand relative to supply, leading to slowing mobility (Myers, Park, and Cho 2023). In such locations, higher vacancy rates can put downward pressure on rents and may contribute to slower rental price growth (Airgood-Obrycki and Wedeen 2024).
-
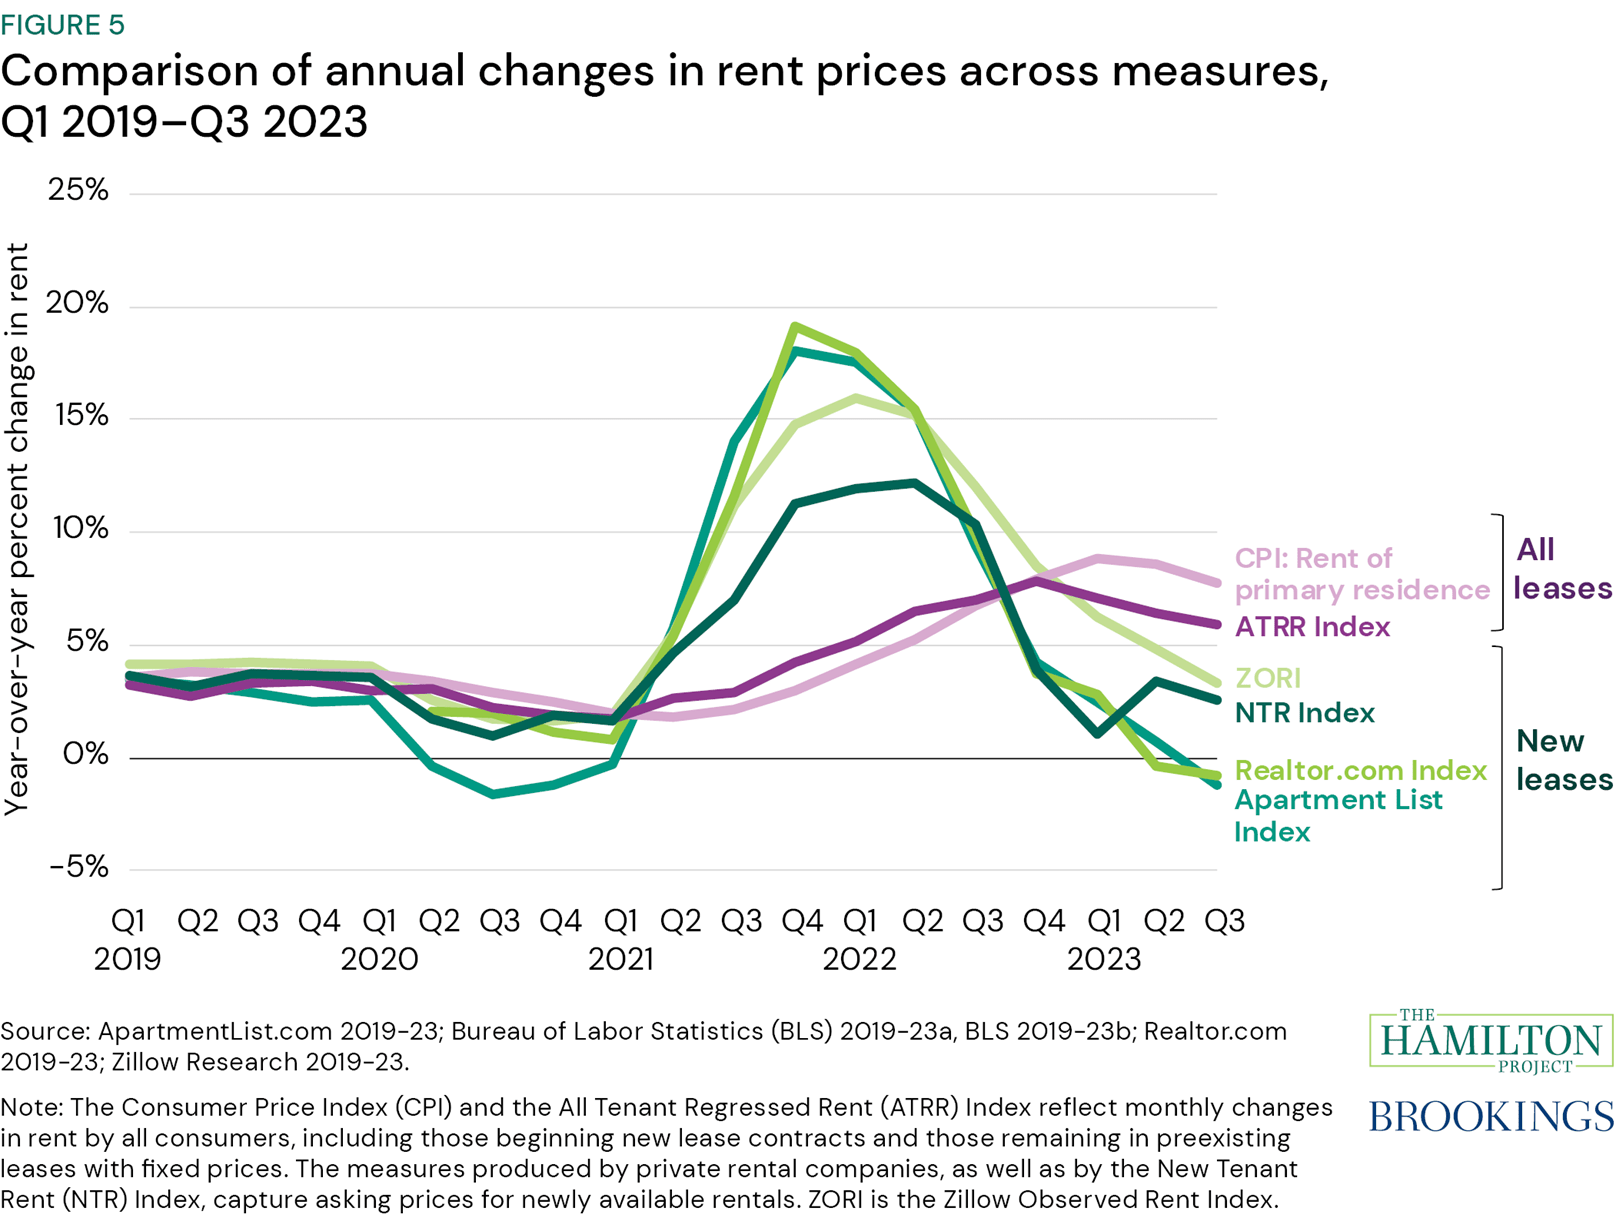
5. Rental price inflation is declining to pre-pandemic levels.
Figure 5 shows the year-over-year change in various measures of rents from the first quarter of 2019 to the third quarter of 2023. Measures of rents differ, primarily by whether they take into account all leases or only new leases, as well as by the types of housing units they incorporate (Adams et al. 2022; Weller and Correa 2023). Specifically, the Consumer Price Index (CPI) and the All Tenant Regressed Rent (ATRR) Index track rent growth facing both existing and new tenants. In contrast, the Zillow Observed Rent Index (ZORI), ApartmentList.com Index, Realtor.com Index, and the New Tenant Rent (NTR) Index all are repeat-rent indices that track rent growth that new tenants face (Adams et al. 2022).
Notwithstanding these differences, all measures consistently show that inflation in the rental market slowed somewhat in 2020 and then rose substantially thereafter. Measures that reflect only new leases show that rental inflation has started to fall from post-pandemic highs and, as of Q3 2023, have fallen below pre-pandemic levels. Because lease duration is typically set at one year, and significant rent changes are more likely when new tenants start a lease, measures that include all leases, such as the CPI and the ATRR Index, lag measures of new leases. Moreover, the CPI slightly lags the ATRR Index because the CPI attributes changes in rent to the survey date, whereas the ATRR Index backdates new leases based on the move-in date (Adams et al. 2022). Given the significant decline in the measures that reflect only new leases, we can reasonably expect the CPI and the ATRR Index to reflect a further decline in rental prices in the coming quarters.
-
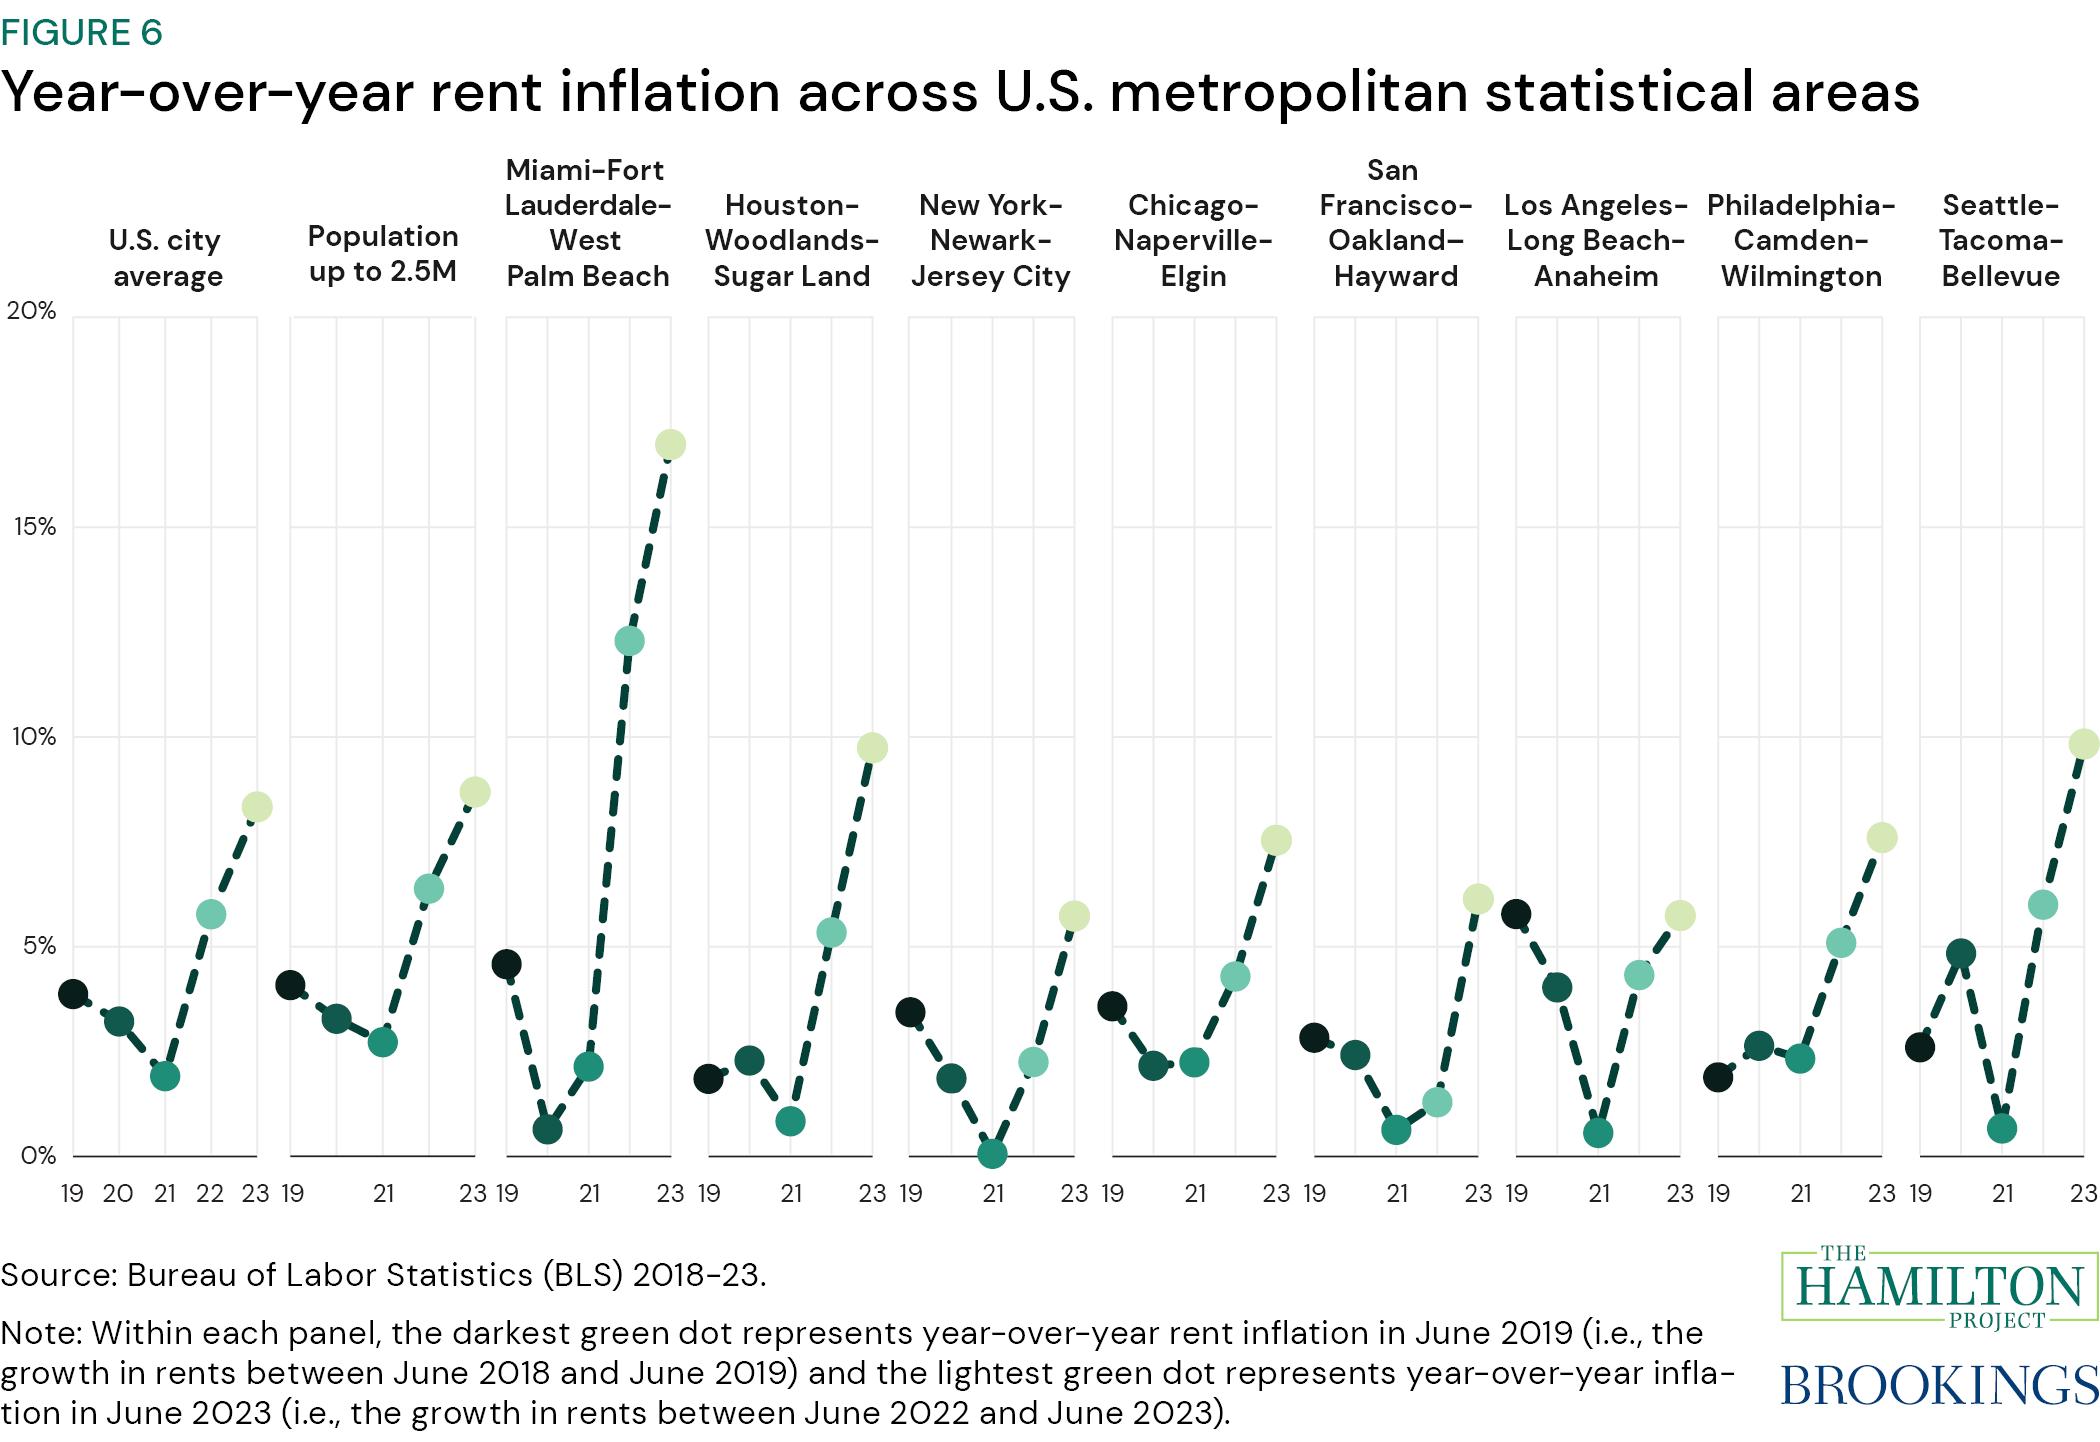
6. Rent inflation looks similar across U.S. metropolitan statistical areas.
Figure 6 shows year-over-year rent inflation across various MSAs annually from 2019 to 2023. Rent inflation has been both high and widely felt in the rental market, with similarities across many MSAs (Fulford, Saunders, and Wilson 2023). The pattern of annual rent inflation across MSAs with a population of fewer than 2.5 million individuals (second panel) and for most of the cities presented here roughly mirrored average rent inflation across U.S. cities (first panel).
Rental inflation in major MSAs, such as those encompassing Miami, Houston, and Seattle, exceeded the national average rent inflation between June 2022 and June 2023. Notably, in the Miami MSA, there was a roughly 5-percentage-point increase in the rate of inflation from 2021–22 to 2022–23, following a 10-percentage-point increase over the previous period. In other words, rent prices in the Miami MSA increased by about 12 percent from 2021 to 2022 and then increased an additional 17 percent from 2022 to 2023, for a cumulative increase of 31 percent over the 2021–23 period. International migration to the Miami area between 2021 and 2023 might have contributed to increased rent inflation (Frey 2023). In contrast, year-over-year rent inflation in the New York MSA has been at or below the national average. Population outflows from New York City might have contributed to lower rent inflation pressures compared with other cities (Frey 2023).
-
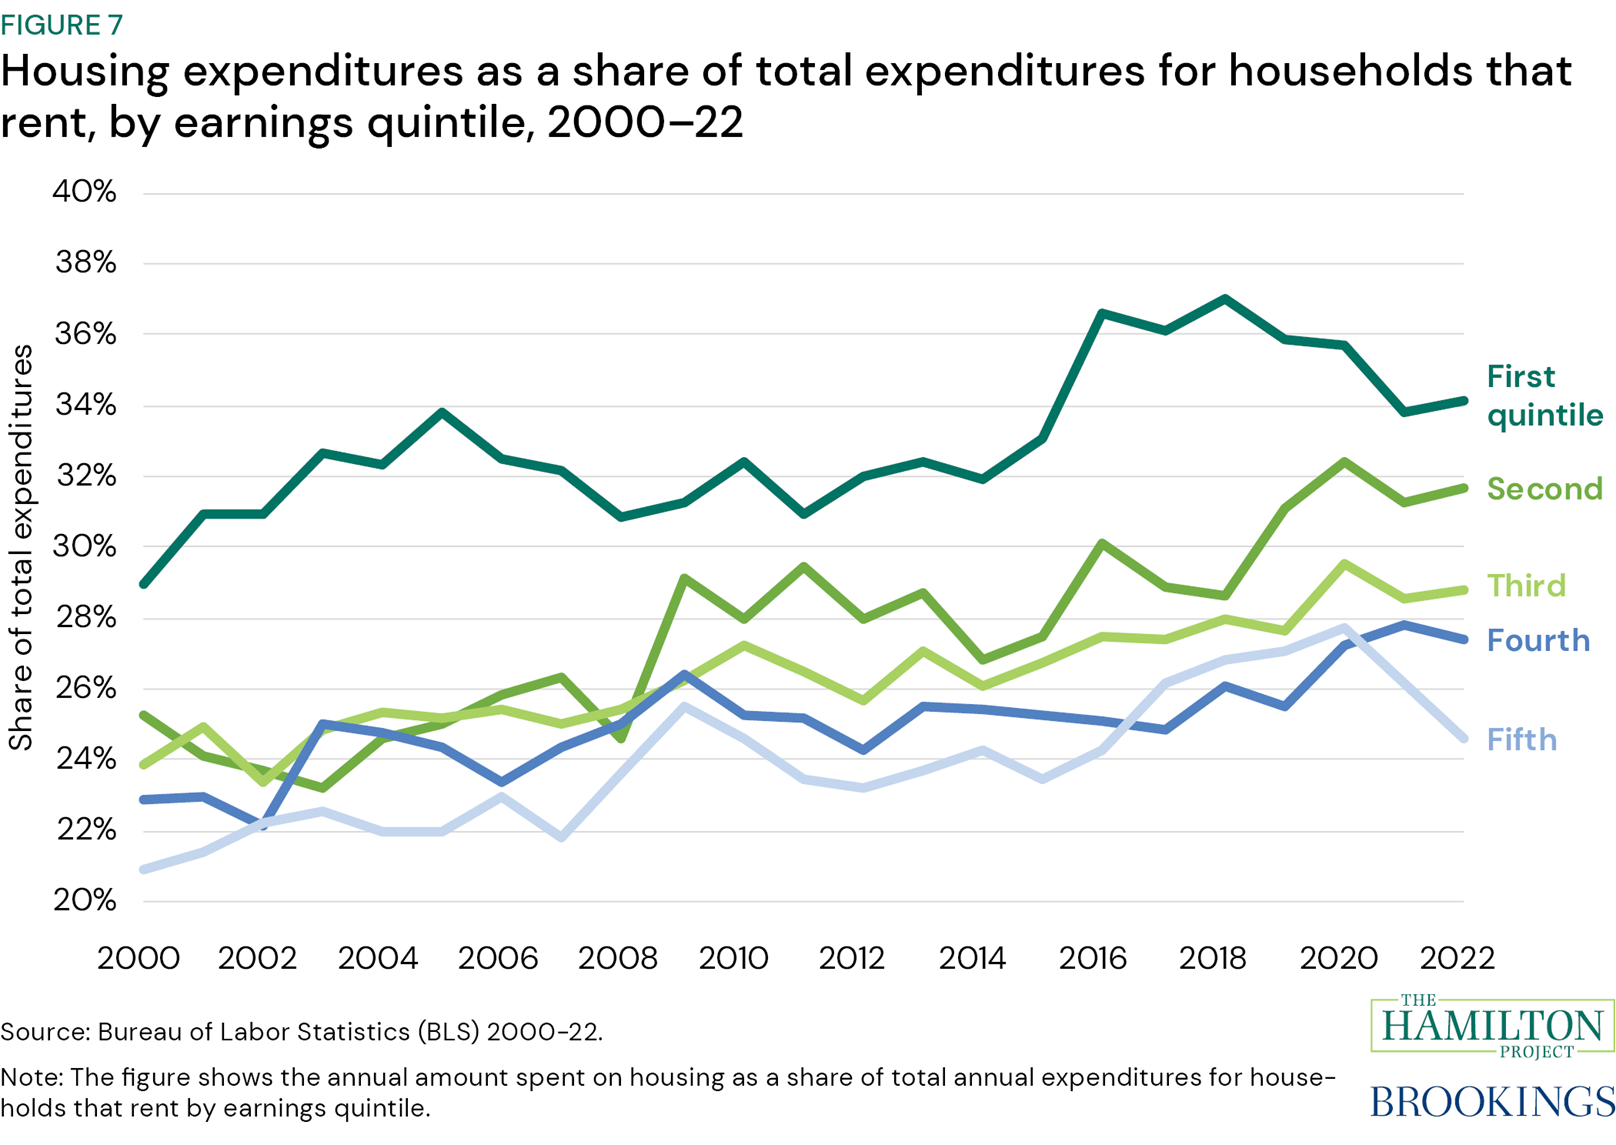
7. For renting households with low earnings, rent is consistently more than one-third of their total expenditures.
Figure 7 shows the share of total household expenditures spent on housing among renting households by earnings quintile over time. In broad strokes, over the past 20 years, renting households have allocated an increasing share of their expenditures on rent. The lowest fifth of earners (first quintile) consistently spend the highest share; in 2018 the share of expenditures spent on housing by these households peaked at 37 percent. Rising rents for lower-earnings households put them more at risk of cutting back on spending for other basic needs and potentially falling behind on various payments (Merchant and Troland 2023; Schuetz 2017).
The fact that rent comprises a significantly larger share of expenditures, on average, for the first and second quintiles relative to higher quintiles reflects the degree to which rent is largely a fixed cost for households and does not fully vary with differences in resources (Shelterforce 2019). This higher share also reflects the lack of affordable rental housing. The share of income devoted to rent has increased since 2000, largely due to the fact that increases in rental costs over this period have been greater than corresponding changes in income (Airgood-Obrycki and Wedeen 2024). Even though the data in the figure go only through 2022, we expect that 2023 saw an increase in the share of expenditures spent due to significant concurrent rent inflation (fact 6).
The large share of expenditures that lower-income households spend on rent puts those households at risk (Merchant and Troland 2023). The result is that even a temporary reduction in income can cause households to fall behind on rent, which can potentially lead to eviction. Alternatively, households in temporary financial distress may continue to make rent payments while possibly cutting back on other necessary expenditures (Schuetz 2017).
-
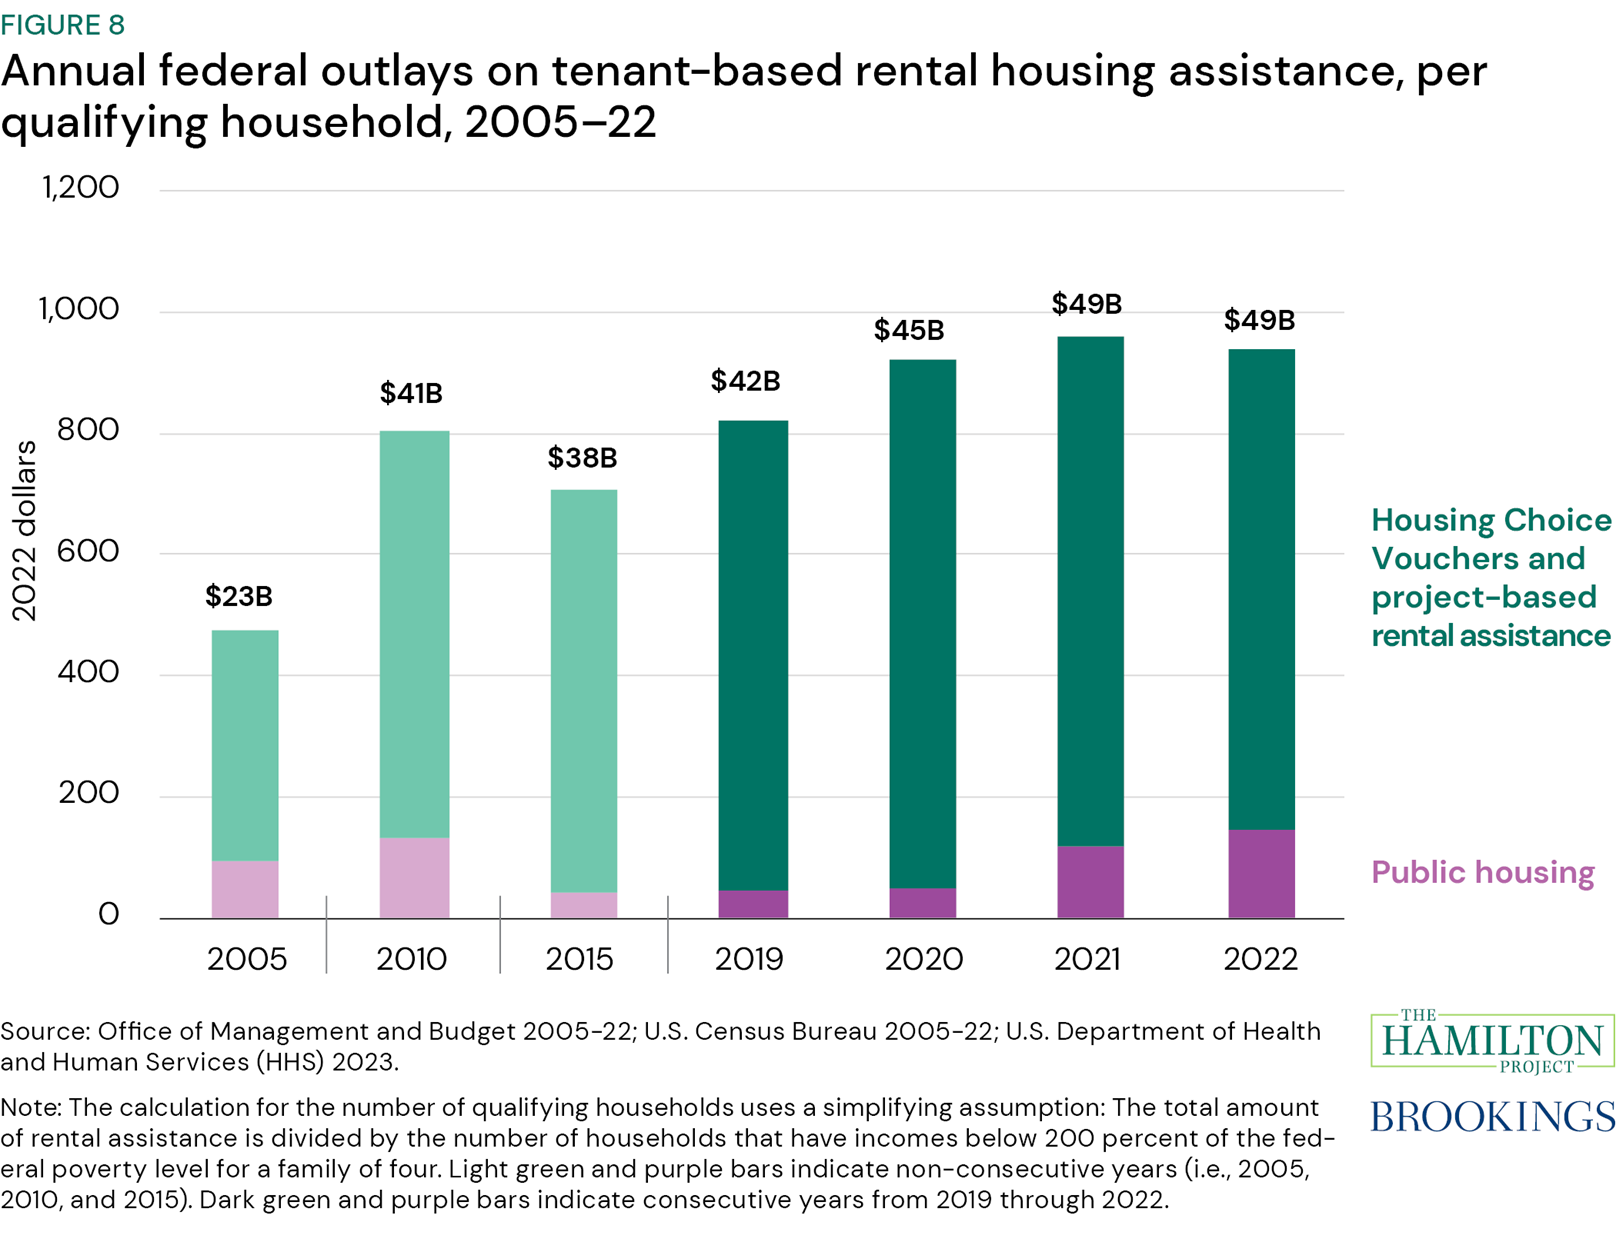
8. Federal housing assistance consistently falls short of housing needs.
Figure 8 shows annual federal outlays for housing assistance per potentially eligible household (defined as a household with income below 200 percent of the poverty threshold for a family of four) between 2005 and 2022. Annual housing assistance per household is very low relative to average housing costs. In this period, annual federal housing assistance doubled from $475 (in 2022 dollars) per qualifying household per year ($23 billion in total) to $941 per qualifying household per year ($49 billion in total). Meanwhile, the median asking rent per month in the U.S. in November 2023 was $1,967 (Redfin 2023).
Most tenant-based housing assistance comes in two forms: Housing Choice Vouchers, which subsidize the difference between 30 percent of a household’s income and their rent, and project-based rental assistance (JCHS 2023b). Housing vouchers have been shown to help low-income individuals afford adequate, stable housing (Acosta, Sonya, and Gartland 2021). In 2022, these two forms of assistance accounted for 85 percent of all tenant-based housing assistance outlays. The remaining 15 percent of tenant-based housing assistance spending was in the form of public housing.
Spending on housing programs increased as part of the COVID-19 relief efforts, notably the $47 billion Emergency Rental Assistance Program (Gerardi et al. 2022). Implementing this program (not shown in the figure) was plagued with challenges, including a lack of timely and actionable guidance (Aiken et al. 2022) and administrative burdens that likely reduced participation among eligible households (Aiken, Gould Ellen, and Reina 2023).
-
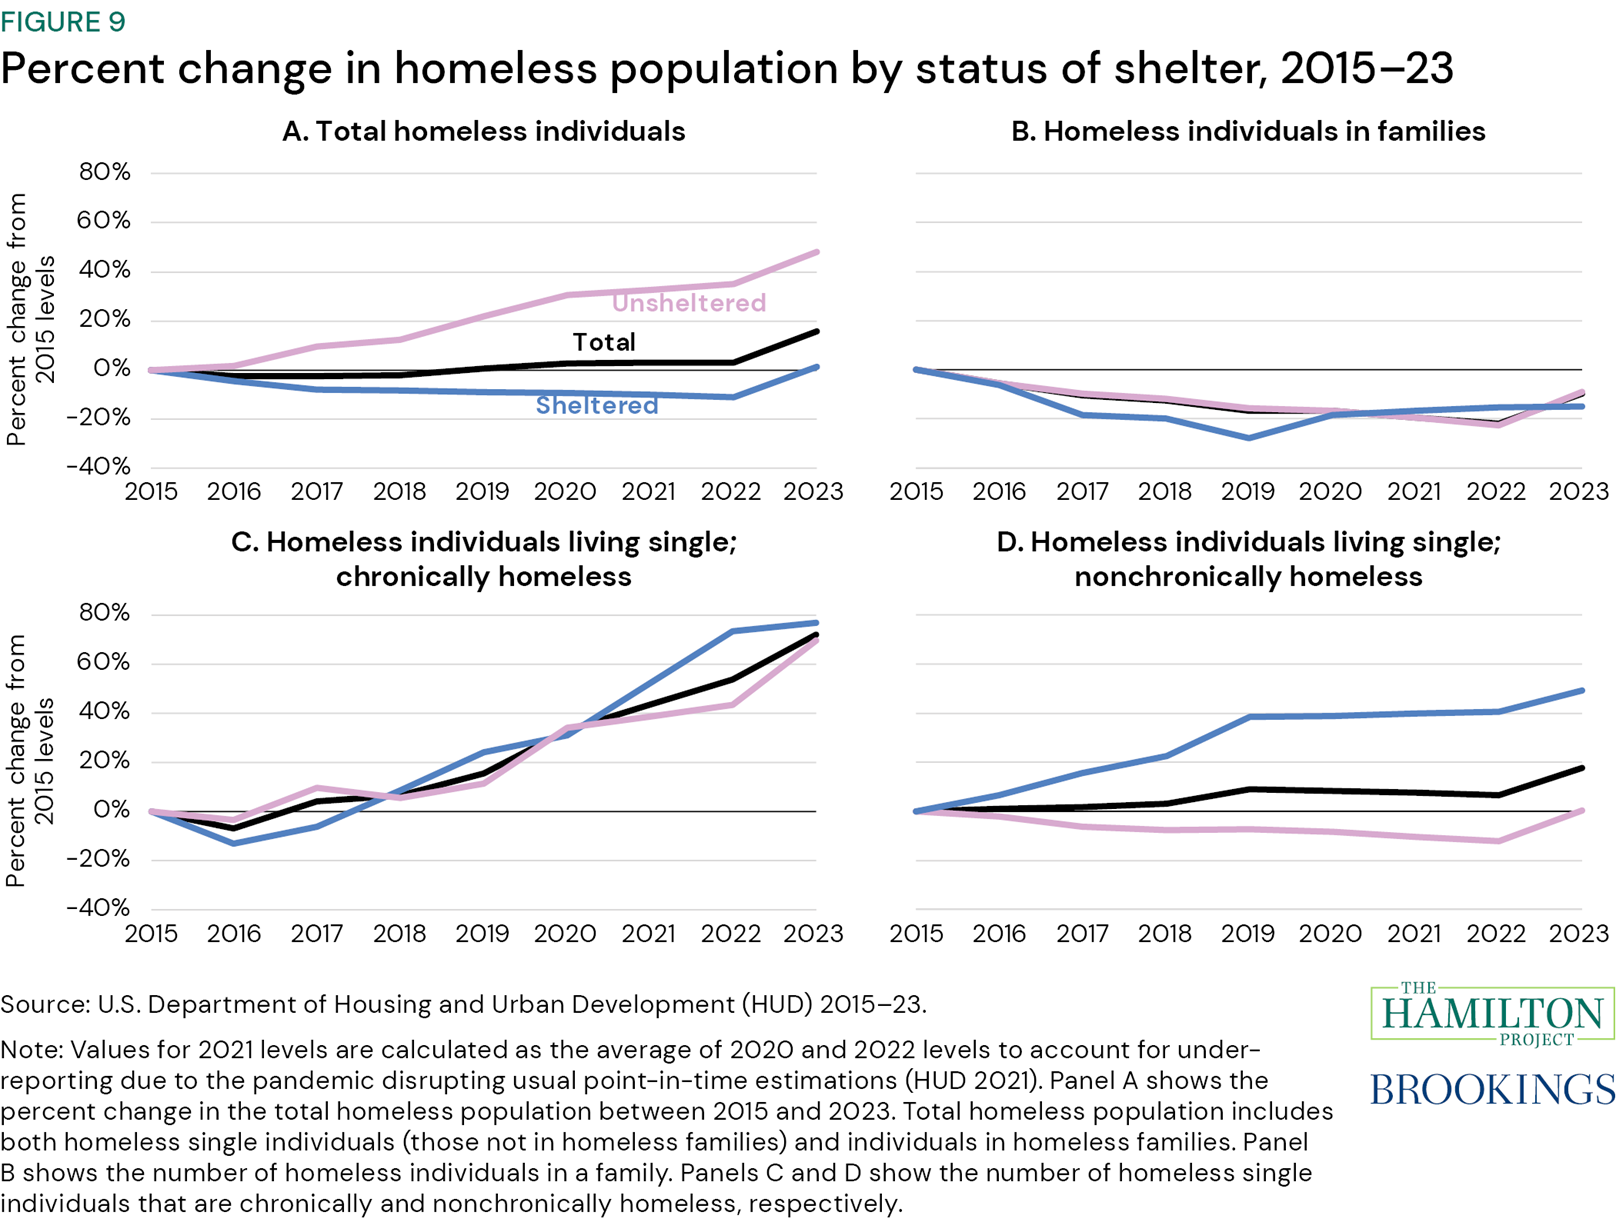
9. Single adults are driving the rise in unsheltered homelessness.
Figure 9 shows the percent change in the homeless population between 2015 and 2023 using point-in-time estimates from HUD. These estimates capture the number of individuals experiencing homelessness on the single night of data collection, including both sheltered (i.e., those in an emergency shelter, transitional housing, or Safe Haven) and unsheltered individuals (HUD 2022a). Panel A shows that the overall count of individuals experiencing homelessness was relatively stable until 2022 and saw a substantial increase in 2023. When disaggregated, the number of sheltered individuals (blue line) shrunk by 11 percent from 2015 to 2022 before returning to 2015 levels in 2023, while the number of unsheltered individuals (pink line) has grown by 48 percent since 2015. The increase in overall homelessness between 2022 and 2023 is largely due to a sharp rise in the number of people who experienced homelessness for the first time (HUD 2023).
The number of both sheltered and unsheltered individuals in families who experienced homelessness decreased between 2015 and 2023 by 10 percent (panel B) but increased between 2022 and 2023. Over the same period, the number of single individuals (i.e., those living not as part of a family) who experienced homelessness increased overall. The number of single individuals who experienced chronic homelessness rose by 72 percent between 2015 and 2023, driven by large percentage increases for both sheltered and unsheltered individuals (panel C). A chronically homeless individual or family is defined as an individual or a family whose head has been homeless for at least a year or at least four times in the past three years [HUD n.d.d]). The number of single individuals experiencing nonchronic or episodic homelessness (panel D) rose by 18 percent over this period but differed greatly for unsheltered and sheltered individuals. The number of individuals living single who experienced unsheltered nonchronic homelessness (panel D; pink line) rose by 49 percent between 2015 and 2023.
-
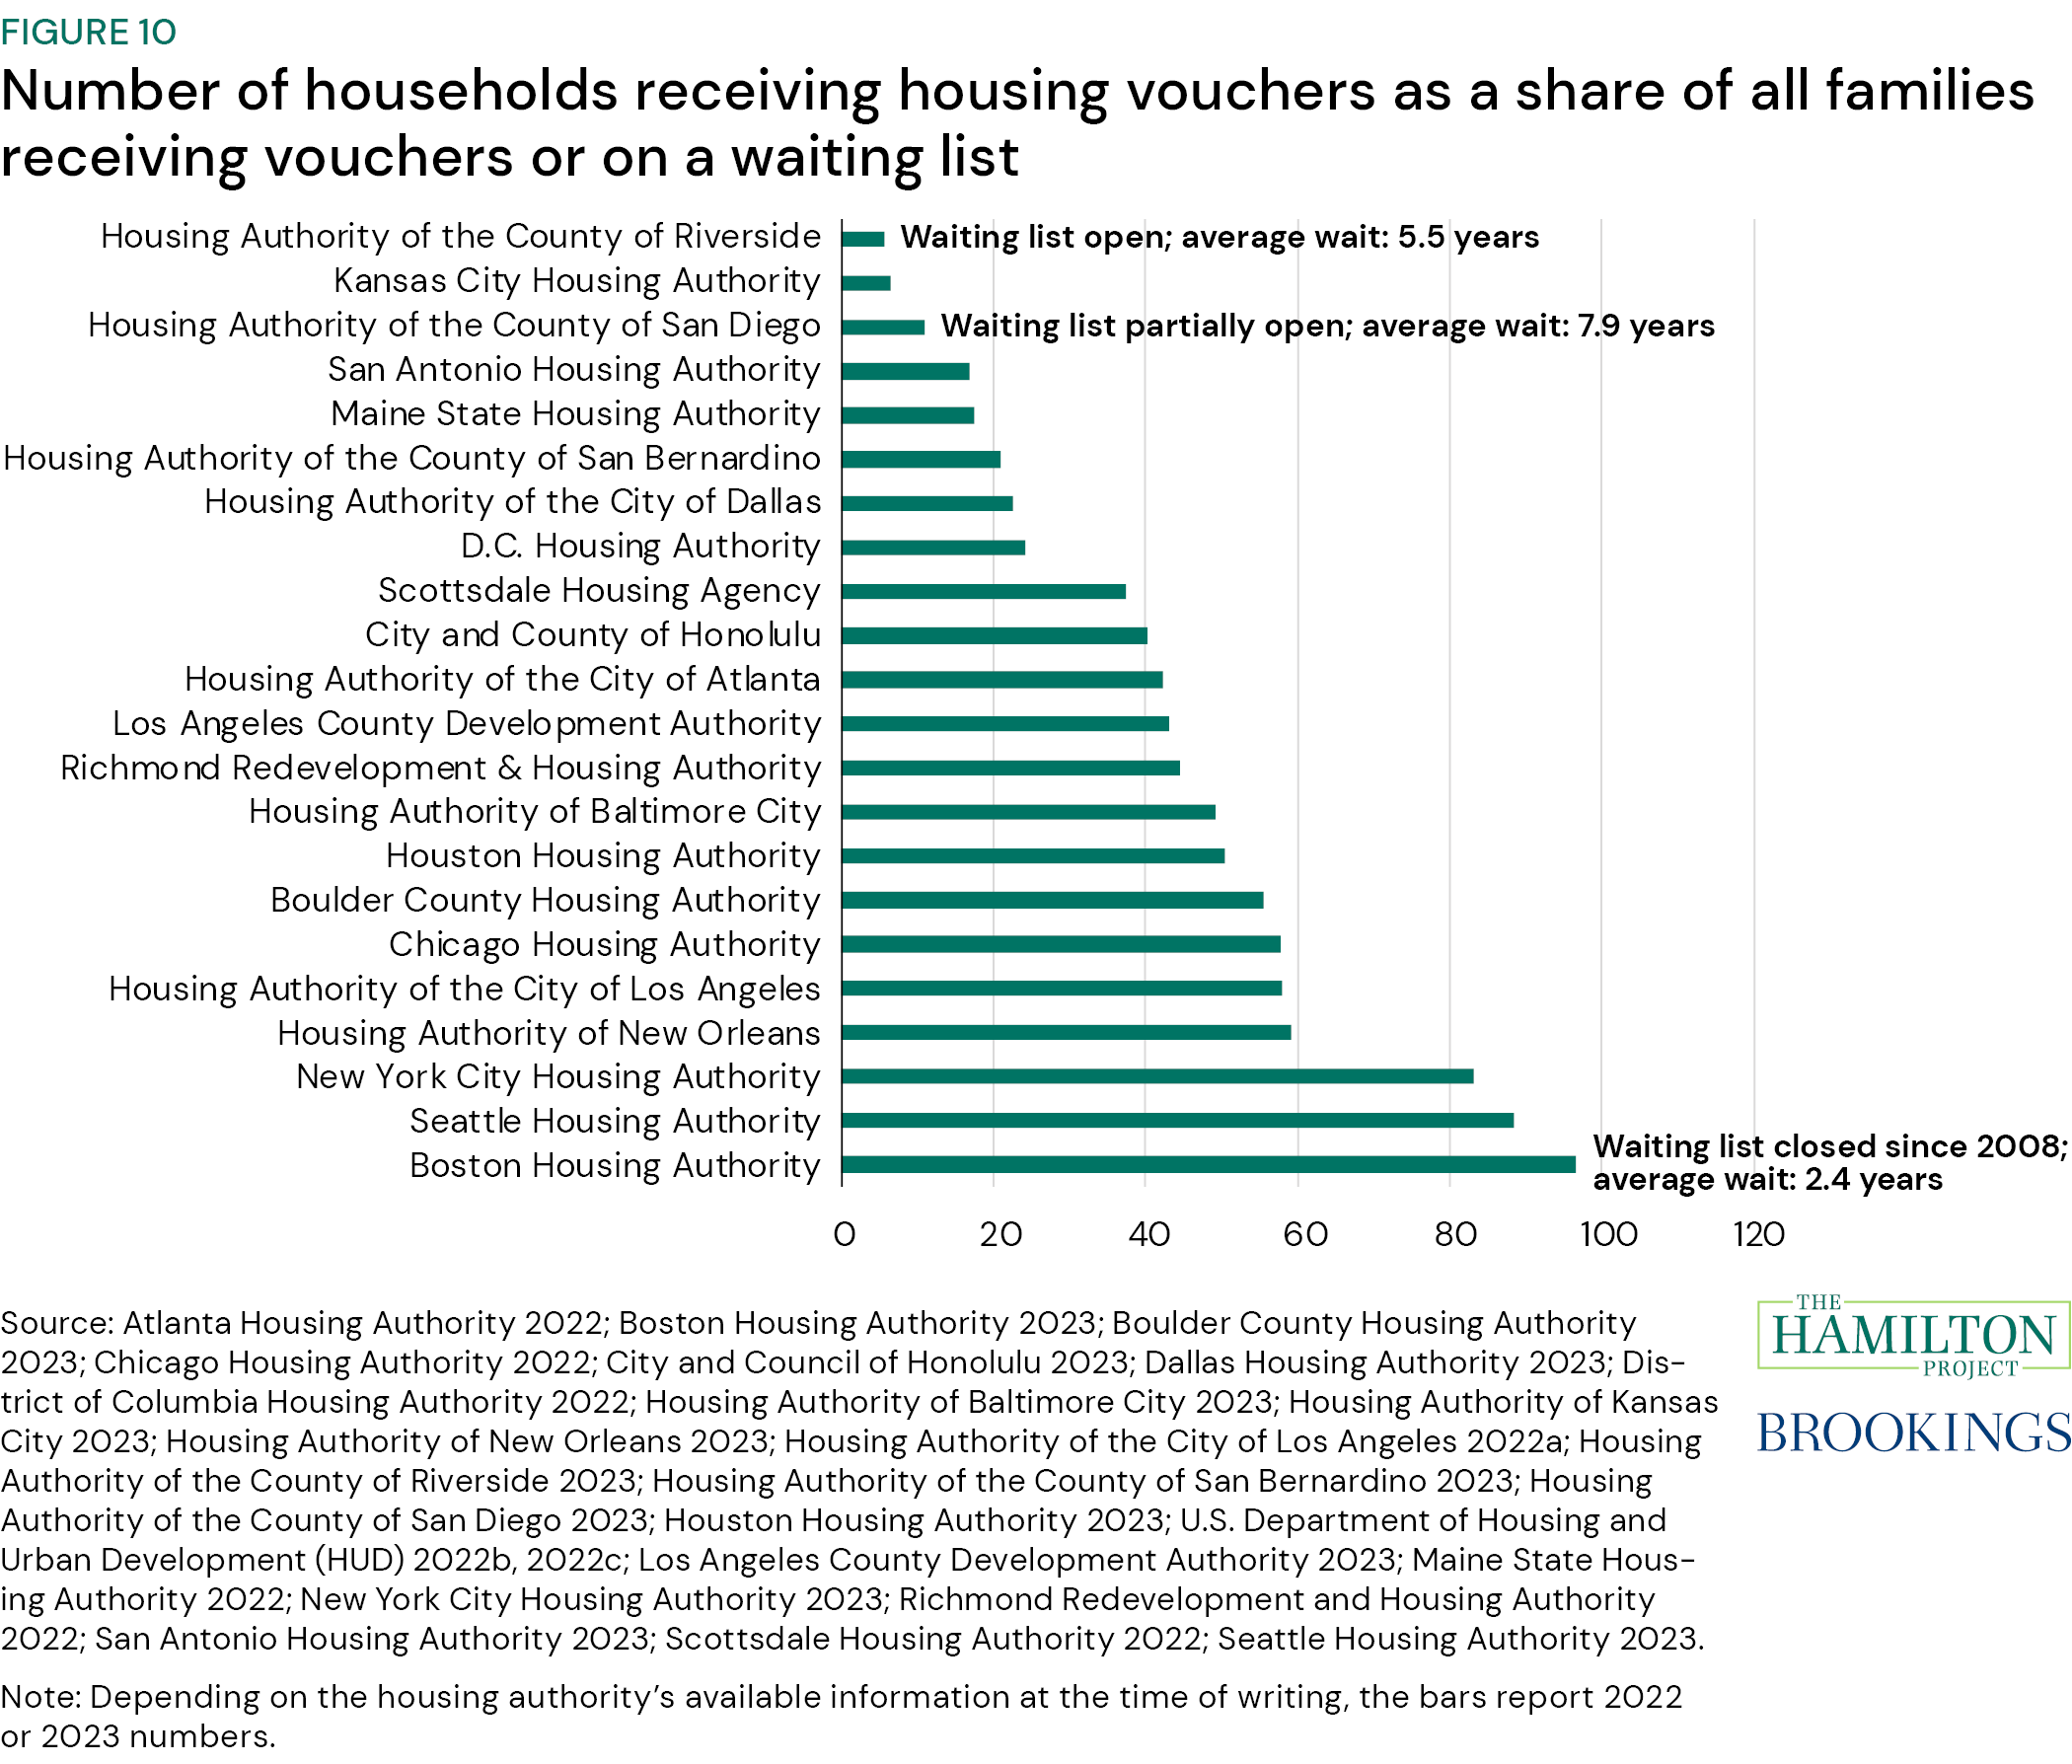
10. Families wait years to receive a housing choice voucher.
Figure 10 plots the ratio of households that have an approved housing voucher application to all those who have applied for a voucher (including both those who have received a voucher as well as those on a Section 8 waiting list) for select cities as a gauge for whether housing agencies can accommodate demand. But this ratio might mask additional variation in wait time, since voucher access also depends on whether a given waiting list is closed, partially open (i.e., open only under specific criteria), or fully open.
Qualifying families that apply for a voucher enter a waiting list through selection, which can be random or based on specific criteria set by a given Public Housing Agency (PHA) such as whether they have experienced homelessness (Housing Authority of the City of Los Angeles 2022b; HUD n.d.a). Many housing agencies experience bottleneck problems and periodically either purge or update their waiting list; in addition, they sometimes impose selective criteria (HUD n.d.b, n.d.c). As a result, getting on a waiting list can be difficult, if not impossible. In Los Angeles, for example, 188,000 people applied for just 20,000 spots on the waiting list in 2017 (Hernandez 2022).
Furthermore, application windows to enter the waiting list can be scarce. For some housing agencies, the application period can be as short as two weeks, while other agencies’ waiting lists are de facto closed (Philadelphia Housing Authority 2023). For example, while nearly everyone on the Boston Housing Authority’s waiting list has received a voucher, this waiting list has been closed since 2008 (Boston Housing Authority 2023). Finally, even when waiting lists are open, families might have to wait for years before they receive assistance (HUD 2022c).
-
Selected Hamilton Project papers on housing
Selected Hamilton Project papers on housing
The Hamilton Project has released a handful of evidence-based policy proposals to increase the supply of housing and support economic opportunity through more investment in housing.
Single-family rentals: Trends and policy recommendations
Ingrid Gould Ellen and Laurie Goodman, 2023
In the context of considerable attention to single-family rental investments and concerns about large investors, Ingrid Gould Ellen (New York University) and Laurie Goodman (Urban Institute) in their Hamilton Project policy proposal underscore the need for transparency in ownership structures, propose that regulators impose additional requirements by scale and hold large scale owners to higher standards, and recommend improving renovation financing for owner occupants.
Gould Ellen and Goodman argue that focusing on who owns single-family rentals distracts from the more important question of how to effectively address the housing shortage in the U.S. and how to boost the overall supply of homes through land-use reforms and targeted infrastructure investments.
Converting brown offices to green apartments
Arpit Gupta, Candy Martinez, and Stijn Van Nieuwerburgh, 2023
The COVID-19 pandemic caused significant shifts in real estate markets, such as increased urban-to-suburban migration, residential rent and housing affordability issues, and reduced value of urban office and retail real estate due to the mass adoption of remote work. Additionally, the climate change crisis is leading to upcoming building regulations to reduce greenhouse gas (GHG) emissions. Converting brown buildings to uses that are in greater demand, such as apartment buildings, is generally a more responsible position with regard to the climate than razing such buildings and then rebuilding from scratch.
Three conditions must be met for a conversion to take place: (1) The building has to be physically suitable, (2) the zoning and building codes have to permit such a conversion, and (3) the financial return of the conversion has to compensate the developer for the risk they are taking.
In their Hamilton Project policy proposal, Arpit Gupta (New York University Stern School of Business), Candy Martinez (Columbia Business School), and Stijn Van Nieuwerburgh (Columbia Business School) discuss all three necessary conditions and suggest pathways for making more office properties viable candidates for conversion into apartment buildings.
Lessons learned from housing policy during COVID-19
Kristopher Gerardi, Lauren Lambie-Hanson, Paul Willen, Laurie S. Goodman, and Susan Wachter, 2022
In “Support for Mortgage Borrowers,” the authors review the aid offered to the roughly 50 million homeowners with mortgages who are included in a forbearance program and the Federal Reserve’s actions that pushed down mortgage rates, allowing many mortgage holders to reduce their monthly payments by refinancing. They deem these policies to be quite effective in relieving financial distress and allowing homeowners to stay in their homes, especially in contrast with the policies pursued during the Great Recession. The authors emphasize that these policies in part worked because of rising housing prices and home equity, before and during the pandemic, and note that such conditions might not hold in future downturns. They observe that minority mortgage borrowers were much more likely to miss mortgage payments, so forbearance was particularly important to them. Black and Hispanic borrowers, however, were less likely to refinance than were white or Asian borrowers.
In “Support for Renters,” the authors evaluate aid offered to the 44 million renting households. These aid programs include federal, state, and local eviction moratoriums and the two rounds of Emergency Rental Assistance. Here, the distribution of financial assistance was distressingly slow. Data on renters are unfortunately skimpy, a major impediment to precisely measuring the effects of these policies. General income replacement might have sufficed if policymakers were concerned only with the negative effect of the recession on renters’ finances, but the eviction moratoriums and Emergency Rental Assistance were particularly important to those struggling to make their rental payments before the recession. Eviction moratoriums, while particularly justified in a pandemic, impose hardships on landlords.
Bolstering the housing safety net: The promise of automatic stabilizers
Robert Collinson, Ingrid Gould Ellen, and Benjamin Keys, 2021
While social insurance programs help to buffer the effects of economic downturns, these programs have many gaps in coverage. In the face of income losses and unexpected expenses, households are not able to quickly adjust housing consumption. Homeowners cannot immediately sell homes and face large transaction costs in refinancing and modifying mortgages. While renters are more mobile, they typically hold leases that commit them to paying rent over a full year. Furthermore, low-income housing production programs in the U.S. tend to be procyclical.
This paper proposes a set of policy reforms that would add automatic stabilizers to federal housing programs, helping both renters and homeowners stay in their homes during economic downturns and ensuring continued support for the construction and renovation of affordable housing. Specifically, the paper puts forth three proposals: (1) the creation of new emergency rental assistance that accounts for low-income households to address the income and financial shocks that can trigger housing instability; (2) an automatic homeownership stabilization program, consisting of a three-month forbearance period for vulnerable mortgage borrowers in response to a triggering event of elevated local unemployment; and (3) a permanent tax credit exchange program that allows states to exchange tax credits for direct subsidies at a fiscally neutral price when demand from tax credit investors falls. The authors discuss several design and implementation questions and acknowledge limitations. Nevertheless, and despite these limitations, these proposals would go a long way toward stabilizing households and housing markets during the next crisis.
Removing barriers to accessing high-productivity places
Daniel Shoag, 2019
Historically, Americans have moved to the parts of the country that offered the highest wages and the most economic opportunity. However, this dynamic has faltered in recent decades, as land-use restrictions have limited housing availability in America’s booming local economies. These regulatory constraints have shut millions of Americans out of the country’s most lucrative labor markets.
The author proposes local land-use reforms to allow for an expanded stock of housing. Shoag also calls for state and federal action to promote pro-development policies. In particular, he suggests that states should establish by-right development policies and that federal policymakers should provide incentives to encourage local innovation in expanding access to housing.
-
References
Acosta, Sonya, and Erik Gartland. 2021. “Families Wait Years for Housing Vouchers Due to Inadequate Funding.” Center on Budget and Policy Priorities, Washington, DC.
Adams, Brian, Lara Loewenstein, Hugh Montag, and Randal J. Verbrugge. 2022. “Disentangling Rent Index Differences: Data, Methods, and Scope.” Working Paper 22-38, Federal Reserve Bank of Cleveland, Cleveland, OH.
Aiken, Claudia, Ingrid Gould Ellen, and Vincent Reina. 2023. “Administrative Burdens in Emergency Rental Assistance Programs.” RSF: The Russell Sage Foundation Journal of the Social Sciences 9 (5): 100–21.
Aiken, Claudia, Isabel Harner, Vincent Reina, Penn Andrew, and Aurand Rebecca Yae. 2022. “Emergency Rental Assistance (ERA) During the Pandemic: Implications for the Design of Permanent ERA Programs.” Housing Initiative at Penn, Philadelphia, PA.
Airgood-Obrycki, Whitney, and Sophia Wedeen. 2024. “Six Takeaways from America’s Rental Housing.” Joint Center for Housing Studies of Harvard University, Cambridge, MA.
ApartmentList.com. 2000-23. “Historic Rent Growth, Year-Over-Year (January 2018–Present).” ApartmentList.com. Accessed January 2024.
Atlanta Housing Authority. 2022. “FY 2023 MTW Annual Plan.” Atlanta Housing Authority, Atlanta, GA.
Berland, Adam. 2022. “Are Housing Vacancy Rates a Good Proxy for Physical Blight?” Cityscape: A Journal of Policy Development and Research 24 (2): 53–68.
Boston Housing Authority (BHA). 2023. “MA002A01 2023 Plan Supplement.” Boston Housing Authority, Boston, MA.
Boulder County Housing Authority (BCHA). 2023. “BCHA Annual PHA Plan Final 2023.” Boulder County Housing Authority, Boulder, CO.
Bureau of Labor Statistics (BLS). 2000-22. “Consumer Expenditure Surveys.” Bureau of Labor Statistics, U.S. Department of Labor, Washington, DC.
Bureau of Labor Statistics (BLS). 2018-23. “Consumer Price Index.” Bureau of Labor Statistics, U.S. Department of Labor, Washington, DC.
Bureau of Labor Statistics (BLS). 2019-23a. “Consumer Price Index.” Bureau of Labor Statistics, U.S. Department of Labor, Washington, DC.
Bureau of Labor Statistics (BLS). 2019-23b. “New Tenant Rent Index.” Bureau of Labor Statistics, U.S. Department of Labor, Washington, DC.
Chapple, Karen, Jackelyn Hwang, Jae Sik Jeon, Iris Zhang, Julia Greenberg, and Bina P. Shrimali. 2022. “Housing Market Interventions and Residential Mobility in the San Francisco Bay Area.” Federal Reserve Bank of San Francisco, San Francisco, CA.
Chen, Shu. 2022. “Small Investors Chose to Sell Properties Rather Than Rent Them During the Pandemic.” CoreLogic, Irvine, CA.
Chicago Housing Authority (CHA). 2022. “Chicago FY22 Plan.” Chicago Housing Authority, Chicago, IL.
City and County of Honolulu. 2023. “2023 Housing Plan.” City and County of Honolulu, Honolulu, HI.
Collinson, Robert, Ingrid Gould Ellen, and Benjamin Keys. 2021. “Bolstering the Housing Safety Net: The Promise of Automatic Stabilizers.” The Hamilton Project, Brookings Institution, Washington, DC.
Congressional Research Service (CRS). 2023. “U.S. Housing Supply: Recent Trends and Policy Consideration.” Authored by Lida R. Weinstock. Report R47617. Congressional Research Service, Washington, DC.
Conlin, Michelle. 2021. “Insight. Selling Out: America’s Local Landlords. Moving In: Big Investors.” Reuters, London, UK.
Crump, Sarah, and Jenny Schuetz. 2021. “US Rental Housing Markets Are Diverse, Decentralized, and Financially Stressed.” Brookings Institution, Washington, DC.
Dallas Housing Authority. 2023. “2024 PHA Plan.” Dallas Housing Authority, Dallas, TX.
de la Campa, Elijah A., and Vincent J. Reina. 2023. “Landlords’ Rental Businesses Before and After the COVID-19 Pandemic: Evidence from a National Cross-Site Survey.” Journal of Housing Economics 59 (B): 101904.
Derenoncourt, Ellora, Chi Hyun Kim, Moritz Kuhn, and Moritz Schularick. 2022. “Wealth of Two Nations: the U.S. Racial Wealth Gap, 1860–2020.” Working Paper 30101, National Bureau of Economic Research, Cambridge, MA.
District of Columbia Housing Authority. 2022. “Response to the U.S. Department of Housing and Urban Development’s March 2022 On-Site Assessment Report.” District of Columbia Housing Authority, Washington, DC.
East, Chloe, Wendy Edelberg, and Noadia Steinmetz-Silber. 2023. “Have Workers Gotten a Raise?” The Hamilton Project, Brookings Institution, Washington, DC.
Federal Reserve Bank of St. Louis (FRED). 2000-23. “New Privately Owned Housing Units Started: Units in Buildings with 5 Units or More.” Federal Reserve Bank of St. Louis, St. Louis, MO.
Frey, William H. 2023. “Pandemic-Driven Population Declines in Large Urban Areas Are Slowing or Reversing, Latest Census Data Shows.” Brookings Institution, Washington, DC.
Fulford, Scott, Elizabeth Saunders, and Eric Wilson. 2023. “Office of Research Blog: Even as Rents Increase, Fewer People Are Buying.” Consumer Financial Protection Bureau, Washington, DC.
Gerardi, Kristopher, Lauren Lambie-Hanson, Paul Willen, Laurie S. Goodman, and Susan Wachter. 2022. “Lessons Learned from Housing Policy during COVID-19.” The Hamilton Project, Brookings Institution, Washington, DC.
Goodman, Laurie, and Amalie Zinn. 2023. “What Is the Build-to-Rent Sector, and Who Does It Serve?” Urban Institute, Washington, DC.
Gould Ellen, Ingrid, and Laurie Goodman. 2023. “Single-Family Rentals: Trends and Policy Recommendations.” The Hamilton Project, Brookings Institution, Washington, DC.
Gupta, Arpit, Candy Martinez, and Stijn Van Nieuwerburgh. 2023. “Converting Brown Offices to Green Apartments.” The Hamilton Project, Brookings Institution, Washington, DC.
Hernandez, Melissa. 2022 “L.A. to Reopen Section 8 Housing Waiting List for First Time in Five Years. Here’s What You Need to Know.” Los Angeles Times, September 22, 2022.
Housing Authority of Baltimore City (HABC). 2023. “HABC FY 2023 Annual Plan Final Draft.” Housing Authority of Baltimore City, Baltimore, MD.
Housing Authority of the City of Los Angeles (HACLA). 2022a. “Annual Report 2022.” Housing Authority of the County of Los Angeles, Los Angeles, CA.
Housing Authority of the City of Los Angeles (HACLA). 2022b. “HACLA to Open Section 8 Housing Voucher Waiting List Lottery.” Housing Authority of the County of Los Angeles, Los Angeles, CA.
Housing Authority of the County of Riverside. 2023. “Waiting List Demographics.” Housing Authority County of Riverside, Riverside, CA.
Housing Authority of the County of San Bernardino. 2023. “2023 Moving to Work Annual Plan.” Housing Authority of the County of San Bernardino, San Bernardino, CA.
Housing Authority of the County of San Diego. 2023. Public Housing Agency Plans. Housing Authority of the County of San Diego, San Diego, CA.
Houston Housing Authority (HHA). 2023. “HHA BOC Meeting Packet April 25, 2023.” Houston Housing Authority, Houston, TX.
Joint Center for Housing Studies (JCHS). 2023a. “Home Prices and Rents Remain High, As Steep Interest Rates Lock Homeowners in Place and Slow Construction.” Joint Center for Housing Studies of Harvard University, Cambridge, MA.
Joint Center for Housing Studies (JCHS). 2023b. “The State of the Nation’s Housing 2023.” Joint Center for Housing Studies of Harvard University, Cambridge, MA.
Layton, Don. 2020. “America’s Housing Finance System in the Pandemic: The Causes and Policy Implications of Credit Tightening.” Joint Center for Housing Studies of Harvard University, Cambridge, MA.
Layton, Don. 2021. “The Homeownership Rate and Housing Finance Policy. Part 1: Learning from the Rate’s History.” Joint Center for Housing Studies of Harvard University, Cambridge, MA.
Los Angeles County Development Authority. 2023. “Approve the Annual Plan for the Los Angeles Count Development Authority.” Los Angeles County Development Authority, Los Angeles, CA.
Maine State Housing Authority. 2022. “Ld 1269: An Act to Preserve Fair Housing in Maine.” Maine State Housing Authority, Augusta, ME.
Merchant, Zofsha, and Erin Troland. 2023. “Did the Pandemic Change Who Became Behind on Rent? Characteristics of Rents Behind on Rent Before and After the Pandemic Onset.” FEDS Notes, April 18. Board of Governors of the Federal Reserve System, Washington, DC.
Molloy, Raven. 2016. “Long-Term Vacant Housing in the United States.” Regional Science and Urban Economics 59 (July): 118–29.
Mondragon, John A., and Johannes Wieland. 2022. “Housing Demand and Remote Work.” Working Paper 30041, National Bureau of Economic Research, Cambridge, MA.
Myers, Dowell, JungHo Park, and Seongmoon Cho. 2023. “Housing Shortages and the New Downturn of Residential Mobility in the US.” Housing Studies 38 (6): 1088–109.
National Bureau of Economic Research (NBER). 2020-23. “US Business Cycle Expansions and Contractions.” National Bureau of Economic Research, Cambridge, MA.
New York City Housing Authority (NYCHA). 2023. “NYCHA Fact Sheet 2023.” New York City Housing Authority, New York, NY.
Newman, Galen, Ryun Jung Lee, Donghwan Gu, Yunmi Park, Jesse Saginor, Shannon Van Zandt, and Wei Li. 2019. “Evaluating Drivers of Housing Vacancy: A Longitudinal Analysis of Large U.S. Cities from 1960 to 2010.” Journal of Housing and the Built Environment 34 (3): 807–27.
Nunn, Ryan, Jana Parsons, and Jay Shambaugh. 2018. “The Geography of Prosperity.” The Hamilton Project, Brookings Institution, Washington, DC.
Office of Management and Budget (OMB). 2005-22. “Table 5.1—Budget Authority by Function and Subfunction: 1976–2028.” Office of Management and Budget, White House, Washington, DC.
Philadelphia Housing Authority. 2023. “PHA Opens Housing Choice Voucher Waiting List.” Philadelphia Housing Authority, Philadelphia, PA.
Realtor.com. 2019-23. “Monthly Rental Reports.” Realtor.com, Santa Clara, CA.
Redfin. 2023. “Press Release: The Tide Turns for Renters as Asking Rents Post Biggest Decline in Over 3 Years.” Redfin, Seattle, WA.
Richmond Redevelopment and Housing Authority (RRHA). 2022. “Approved RRHA Annual Agency Plan FY2022–2023 with Exhibits.” Richmond Redevelopment and Housing Authority, Richmond, VA.
San Antonio Housing Authority. 2023. “Annual MTW Plan.” San Antonio Housing Authority, San Antonio, TX.
Sarver, Maureen. 2023. “Why Is It So Hard for People Experiencing Homelessness to ‘Just Go Get a Job?’” Urban Institute, Washington, DC.
Schuetz, Jenny. 2017. “Is the Rent ‘Too Damn High’? Or Are Incomes Too Low?” Brookings Institution, Washington, DC.
Schwarz, Kirsten, Adam Berland, and Dustin L. Herrmann. 2018. “Green, But Not Just? Rethinking Environmental Justice Indicators in Shrinking Cities.” Sustainable Cities and Society 41 (August): 816–21.
Schweitzer, Ally. 2020. “Small Landlords in D.C. Worry Pandemic Will Force Them to Sell Their Property.” October 28, 2020. National Public Radio, Washington, DC.
Scottsdale Housing Authority. 2022. “FY 2022–23 Annual Agency Plan.” Scottsdale Housing Authority, Scottsdale, AZ.
Seattle Housing Authority (SHA). 2023. “Seattle FY23 Plan.” Seattle Housing Authority, Seattle, WA.
Shelterforce. 2019. “Rents Will Only Go So Low, No Matter How Much We Build.” Shelterforce, Montclair, NJ.
Shoag, Daniel. 2019. “Removing Barriers to Accessing High-Productivity Places.” The Hamilton Project, Brookings Institution, Washington, DC.
U.S. Census Bureau. 2000–22. “American Community Survey.” U.S. Census Bureau, Suitland, MD.
U.S. Census ureau. 2000-23. “Housing Inventory Estimate: Vacant Housing Units for Rent in the United States.” U.S. Census Bureau, Suitland, MD.
U.S. Census Bureau. 2005–22. “Current Population Survey.” U.S. Census Bureau, Suitland, MD.
U.S. Census Bureau. 2018. “Rental Housing Finance Survey (RHFS).” U.S. Census Bureau, Suitland, MD.
U.S. Census Bureau. 2021. “Rental Housing Finance Survey (RHFS).” U.S. Census Bureau, Suitland, MD.
U.S. Census Bureau. 2022. “American Community Survey.” U.S. Census Bureau, Suitland, MD.
U.S. Department of Health and Human Services (HHS). 2023. “2023 HHS Poverty Guidelines.” U.S. Department of Health and Human Services, Washington, DC.
U.S. Department of Housing and Urban Development (HUD). 2015–23. “Point-in-Time Count Report.” U.S. Department of Housing and Urban Development, Washington, DC.
U.S. Department of Housing and Urban Development (HUD). 2021. “The 2021 Annual Homeless Assessment Report (AHAR) to Congress.” U.S. Department of Housing and Urban Development, Washington, DC.
U.S. Department of Housing and Urban Development (HUD). 2022a. “Annual Homeless Assessment Report to Congress.” U.S. Department of Housing and Urban Development, Washington, DC.
U.S. Department of Housing and Urban Development (HUD). 2022b. “A Picture of Subsidized Households.” U.S. Department of Housing and Urban Development, Washington, DC.
U.S. Department of Housing and Urban Development (HUD). 2022c. “Assisted Housing: National and Local.” Office of Policy Development and Research. U.S. Department of Housing and Urban Development, Washington, DC.
U.S. Department of Housing and Urban Development (HUD). 2023. “HUD releases 2023 annual homeless assessment report.” U.S. Department of Housing and Urban Development, Washington, DC.
U.S. Department of Housing and Urban Development (HUD). n.d.a. “Housing Choice Vouchers Fact Sheet.” U.S. Department of Housing and Urban Development, Washington, DC.
U.S. Department of Housing and Urban Development (HUD). n.d.b. “Chapter 4: Waiting List and Tenant Selection.” U.S. Department of Housing and Urban Development, Washington, DC.
U.S. Department of Housing and Urban Development (HUD). n.d.c. “Chapter 5: Eligibility and Denial of Assistance.” U.S. Department of Housing and Urban Development, Washington, DC.
U.S. Department of Housing and Urban Development (HUD). n.d.d. “Definition of Chronic Homelessness.” HUD Exchange. U.S. Department of Housing and Urban Development, Washington, DC.
U.S. Government Accountability Office (GAO). 2020. “Rental Housing: As More Households Rent, the Poorest Face Affordability and Housing Quality Challenges.” GAO-20-427. U.S. Government Accountability Office, Washington, DC.
U.S. Government Accountability Office (GAO). 2023. “Homelessness: Better HUD Oversight of Data Collection Could Improve Estimates of Homeless Population.” Report to the Chairwoman, Committee on Financial Services, House of Representatives. GAO-20-433. U.S. Government Accountability Office, Washington, DC.
Van Green, Ted. 2023. “Majority of Americans Prefer a Community with Big Houses, Even If Local Amenities Are Farther Away.” Pew Research Center, Washington, DC.
Weller, Christian, and David Correa. 2023. “It’s All About Housing: Rental Inflation and Its Measurement Play an Outsize Role in the Consumer Price Index.” Center for American Progress, Washington, DC.
Zillow Research. 2000-23. “Zillow Observed Rent Index.” Zillow, Seattle, WA.
Authors


Related Content


-
Acknowledgements and disclosures
The authors are grateful to Peggy Bailey and Jenny Schuetz for their helpful comments. The authors also thank Cameron Greene, Olivia Howard, and Linsie Zou for their research support.
The Brookings Institution is financed through the support of a diverse array of foundations, corporations, governments, individuals, as well as an endowment. A list of donors can be found in our annual reports published online here. The findings, interpretations, and conclusions in this report are solely those of its author(s) and are not influenced by any donation.
The Brookings Institution is committed to quality, independence, and impact.
We are supported by a diverse array of funders. In line with our values and policies, each Brookings publication represents the sole views of its author(s).