
Just a few months into office, the Trump administration has put in place a restrictive immigration policy while pursuing aggressive deportations. These anti-immigrant actions come just as new Census Bureau data show that the rise of immigration over the past few years, including both legal and undocumented immigrants, bolstered population growth across the nation and, in particular, large metro areas. The early 2020s hit those areas’ populations particularly hard, in large part due to COVID-19: more deaths, fewer births, domestic out-migration, and reduced immigration from abroad. While most of these components are now turning around, the new census data show that the recent rise in immigration is the main reason big urban area populations are now recovering.
These new numbers, detailing growth in the nation’s metro areas and counties though the middle of last year, follow those released earlier for the nation and states, and incorporate updated immigration numbers.1 They indicate that the rise in immigration over the 2023-24 period drove national population growth to the largest level in two decades, and accounted for most of the growth in 38 states.
The new data show immigration to be especially essential for the growth of the nation’s major metro areas (those with populations exceeding 1 million), as well as the cities and core counties within them. The data also reveal a softening of peak pandemic-era domestic migration patterns, with smaller out-migration flows from coastal and Midwest metro areas and reduced in-migration to “pandemic magnets” in the South and West.
The analysis and accompanying downloadable tables draw from the new census estimates to show that recent immigration drove the population rebound of almost all major metro areas after sharp slowdowns and declines during the pandemic—suggesting these areas’ future growth will hinge on continued immigration gains.
A growth rebound for major metro areas, driven by immigration
The nation’s major metropolitan areas took a huge demographic hit during the pandemic, as deaths rose, births declined, and, in many, a substantial spike in domestic out-migration took place as residents and workers moved to smaller places and other regions. Immigration from abroad also sank close to historic lows due to policies applied during the later stages of the first Trump administration and pandemic-related restrictions.


As a consequence, the nation’s 55 major metro areas saw their populations decline in the aggregate: a loss of 118,000 people in 2020-21, their first decline in at least 34 years. They then saw population increases of 1.1 million, 1.8 million, and 2.3 million, respectively, over the next three years (see Figure 1).
Of the three demographic components of change—net domestic migration, net international migration, and natural increase (births minus deaths)—it was the rise in domestic out-migration that contributed most to the overall major metro area population decline in 2020-21, although lower natural increase and immigration contributed as well (see Figure 2). This shifted as immigration rose nationally; in 2023-24, immigration accounted for 94% of major metro area growth.
Among the 55 major metro areas, only one (Memphis, Tenn.) lost population in 2023-24, compared with 20 in 2020-21, 14 in 2021-22, and five in 2022-23 (see downloadable Table A). Fifty-two grew more rapidly in 2023-24 than in 2020-21, led by New York, Houston, Dallas, Miami, and Washington, D.C. While natural increase rose somewhat in most areas and domestic out-migration softened in the last three years, immigration contributions grew substantially in the last two years, affecting all areas in 2023-24.
Immigration drove half or more of recent population growth in 45 major metro areas
The recent rise in immigration has been a demographic godsend for major metro areas. While immigration has historically boosted growth in certain large metro areas, the still-low levels of natural increase nationally have made immigration a welcome source of growth, especially in areas experiencing domestic out-migration.

Figure 3 shows the components of population change (immigration, domestic migration, and natural increase) for the nine major metro areas with largest immigration gains in 2023-24. These are the coastal behemoths of New York and Los Angeles; southern immigrant magnets Miami, Houston, and Dallas; Chicago in the Midwest; and the other coastal magnets of Washington, D.C., Boston, and San Francisco.
In six of these metro areas (all but Houston, Dallas, and Washington, D.C.), immigration accounted for all of the population gains. In each, immigration levels more than compensated for the (negative) sum of their domestic migration and natural increase levels. Both Houston and Dallas saw gains from domestic migration and natural increase, but even so, immigration contributed the lion’s share of their growth.
Map 1 classes all 55 major metro areas by their 2023-24 population gains and further depicts immigration’s share of those gains (also see downloadable Table B). Note that 54 of these metro areas gained population that year, and in 45, immigration accounted for half or more of population gains.
Moreover, in 21 major metro areas, immigration accounted for all of the population gains because the sum of domestic out-migration and natural increase in those areas was negative. This group is not just the largest metro areas, nor those with the most immigration. They are located in all regions of the country; aside from the areas discussed above, they include San Diego; Portland, Ore.; Salt Lake City; Milwaukee; St. Louis; Cleveland; Buffalo, N.Y.; Pittsburgh; and Providence, R.I. Many of these areas now rely on immigration for growth due to the low levels of natural increase and continued domestic out-migration.
Domestic migration patterns across major metro areas softened
Returning to the shifts that occurred since the peak pandemic years, it is useful to see how many major metro areas improved their demographic circumstances due to the contributions of rising immigration from abroad as well as a softening of the sharp domestic migration that directed movers away from several coastal and Midwest metro areas to those in the Sun Belt.

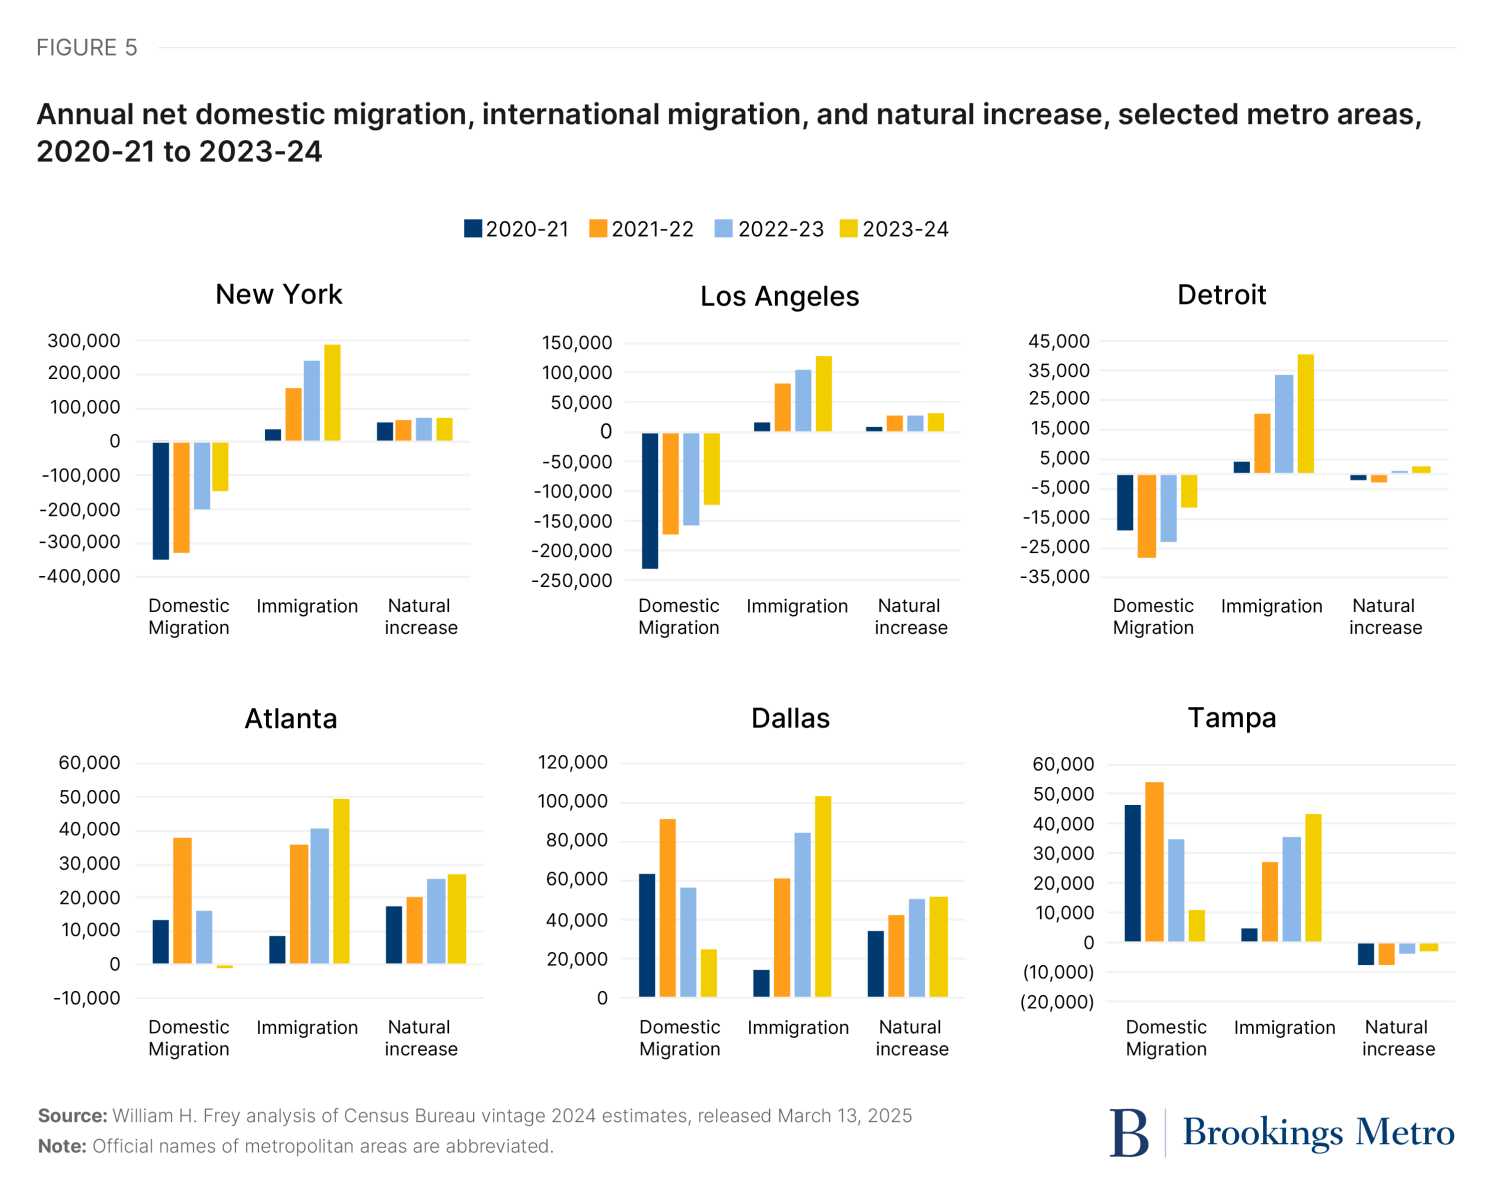
Looking first at annual metropolitan change from 2020-21 to 2023-24, Figure 4 shows three metro areas that rose from negative to positive population growth (New York, Los Angeles, and Detroit), and three whose positive growth declined somewhat in the past two years (Atlanta, Tampa, Fla., and Dallas).
The former three represent major metro areas that bore the brunt of population loss during the first two years of the decade, only to rebound to smaller losses or gains in the most recent two years, especially 2023-24. These are areas where the pandemic most affected people’s behavior, with stricter office and public transportation shutdowns and a desire among residents to avoid crowded spaces.
The latter three represent Sun Belt metro areas that saw gains, often in the second peak pandemic year of 2021-22. Movers from denser areas in other parts of the country found these places attractive during the pandemic.
A look at the demographic components of change in these six areas makes plain how domestic migration patterns have impacted their growth (see Figure 5). Each of the first three areas showed sharp declines in domestic out-migration over the past two years, at the same time domestic in-migration was reduced in the latter three (and, in the case of Atlanta, shifting to out-migration in 2023-24).
The broader pattern of this “softening” of domestic migration can be seen in Map 2, which classes major metro areas by shifts in their domestic migration patterns between the early 2020s and 2023-24. Most areas with net domestic out-migration remained that way throughout this period, but saw their out-migration lessen over time. Of the 29 major metro areas with net domestic out-migration in 2023-24, 23 showed smaller out-migration than earlier in the decade. Concurrently, most metro areas with net in-migration saw those levels decrease; of the 26 areas that gained migrants in 2023-24, that gain was smaller than earlier in the decade for 17. Moreover, seven metro areas flipped from net out-migration earlier in the decade to net in-migration, including Minneapolis-Saint Paul; Omaha, Neb.; and Providence, R.I.
While this softening of domestic migration has impacted both origin and destination metro areas, the rise of immigration from abroad has increased the growth of all of them. Immigration for 2023-24 was higher in each metro area than was the case in 2020-21 or 2021-22. As such, it has improved growth in net domestic out-migration areas such as New York, Los Angeles, and Detroit. In the case of metro area New York, domestic out-migration declined from a loss of 351,000 in 2020-21 to a loss of just 147,000 in 2023-24. At the same, immigration to New York increased from 37,000 to 288,000. These shifts, plus a rise in natural increase, moved metro area New York from registering the biggest population decline (at 277,000) in 2020-21 to the registering the greatest gain (at 213,000) in 2023-24 among major metro areas (see downloadable Table C).
At the other end of the spectrum, as domestic migration gains ebbed in many Sun Belt metro areas, they were frequently offset by immigration gains, as shown for Atlanta, Tampa, Fla., and Dallas in Figure 5. Thus, immigration benefited most large metro areas, including both those showing reduced declines and reduced gains in domestic migration.
A revival of major metro areas’ core cities and counties
Just as major metro areas experienced a demographic rebound through the midpoint of 2024, many of their cities and core counties also enjoyed notable gains. During the early 2020s, the term “urban doom loop” emerged to characterize the flight of city residents or new movers away from urban core areas that were ending in-office work and discouraging face-to-face interactions of all kinds. Yet the newly released data reveal positive shifts for many core counties in metro areas.2

Figure 6 shows the changes for selected areas that fared poorly demographically in the first part of the decade but saw rebounds by 2023-24. These include the cities of New York, Philadelphia, Denver, and Washington, D.C., as well as Cook County, Ill., Milwaukee County, Wis., and Cuyahoga County, Ohio (the central counties of the Chicago, Milwaukee, and Cleveland metro areas, respectively). Each registered population declines in 2020-21, with several turning positive in one or more subsequent years. In each, growth rates were highest in 2023-24. In fact, among 37 selected core counties in the major metro areas examined here, all but one showed positive growth rates in 2023-24, compared to when 33, 18, and 11 lost population in 2020-21, 2021-22, and 2022-23, respectively. Especially noteworthy was the city of San Francisco, where the population declined by 6.8 % in 2020-21, but increased by 1% in 2023-24 (see downloadable Table D).
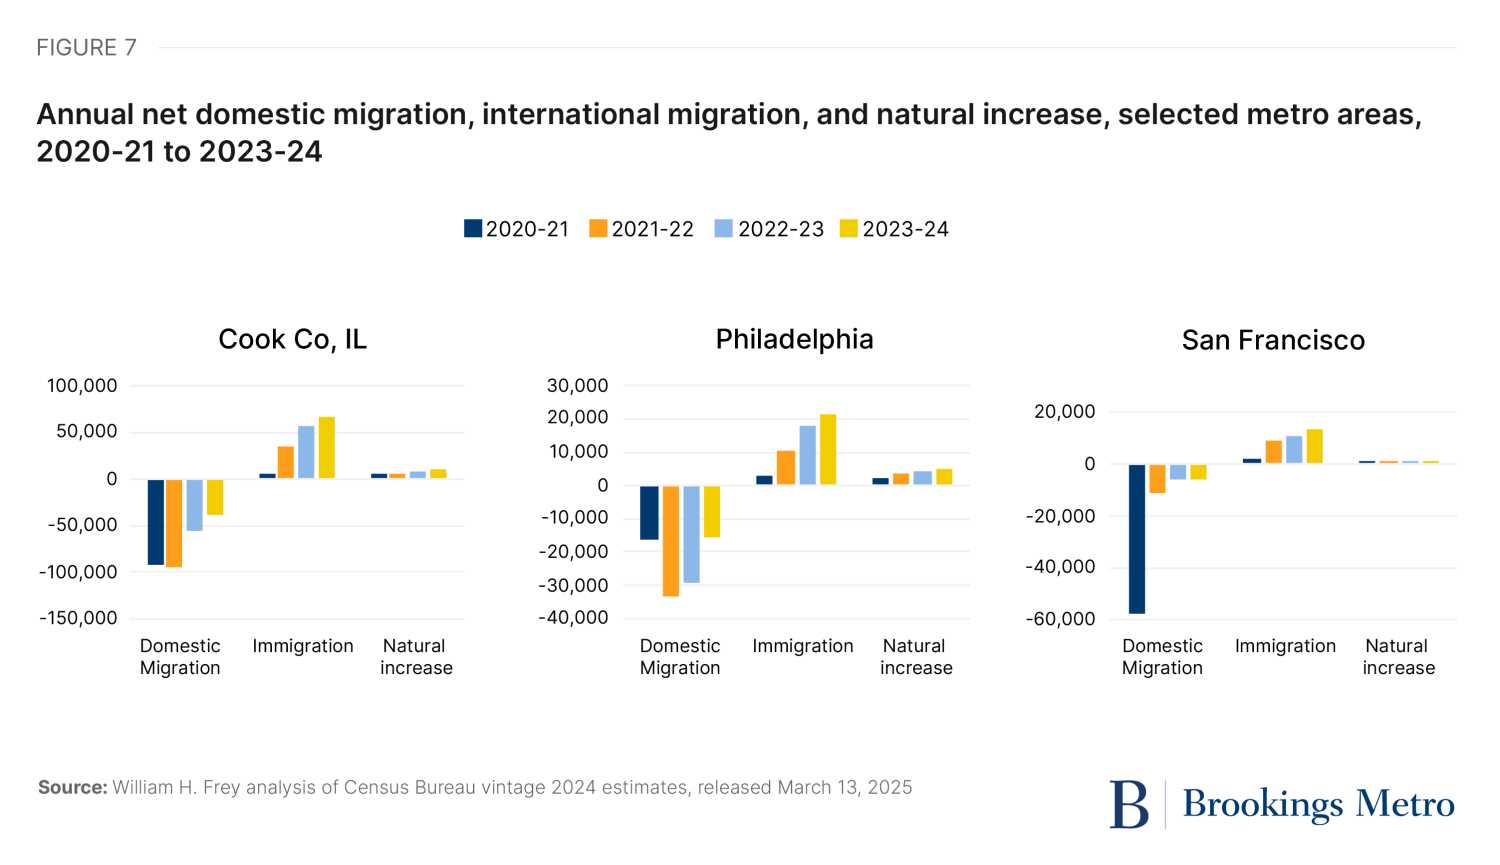
Perhaps even more than for major metro areas, urban core counties have experienced turnarounds that have benefitted from reduced domestic out-migration and recent immigration surges. Figure 7 depicts numeric components of change for Cook County, Ill., Philadelphia, and San Francisco. All three saw recent reductions in their domestic out-migration and gains in immigration, as well as smaller gains in natural increase. Clearly, the former component reduced population losses in all three, especially in San Francisco, where the dramatic 2020-21 losses were less severe in the subsequent three years. Yet for the most recent year, immigration is most responsible for core county gains.
A look at the demographic components of change for the 37 core counties reveals that even in 2023-24, 35 experienced net domestic out-migration—though for most, it was smaller than in earlier years. The reason these counties nevertheless gained population in 2023-24 had to do with the rise of immigration from abroad. Among the 36 core counties that gained population in 2023-24, immigration accounted for all of that growth in 29 of them, and half or more of growth in the other seven. Thus, the rise of immigration has not only impacted major metro areas, but their core counties and cities as well.
National immigration levels are responsible for urban population growth
The new census estimates make clear that recent rises in the nation’s immigration levels were most responsible for the population rebounds in most major metro areas that were hit hard during the peak pandemic years, as well as many of their core counties. Moreover, as domestic migration to several Sun Belt metro areas softened, immigration helped them maintain their growth levels.
While this analysis focuses on the nation’s biggest metro areas and core counties, recent immigration also improved the demographic circumstances of smaller metro areas and counties. Among the 332 smaller metro areas (those with populations less than 1 million) that gained population in 2023-24, immigration contributed to half or more of the growth in 165. Moreover, when looking the 2,054 counties that gained population last year, immigration accounted for half or more of the growth in 819, including many of the nation’s largest counties (see Map 3). Together, these 819 counties are home to 63% of the nation’s 2024 population.
The role of immigration to growth in large metro areas and counties has not only helped these areas rebound from the unusual demographic circumstances of the pandemic. They also point to the significance of immigration for future growth in these areas during a period where, without immigration, the nation’s population growth levels would diminish. The attraction of immigrants to urban areas is responsible for much of their population gains in the recent past, as Brookings’ Alan Berube has noted. These contributions to urban areas occurred during periods of healthy national immigration. Immigration to these areas will be even more necessary in the future as the nation’s population ages, leading to fewer births, more deaths, and continued domestic out-migration.
Nationally, recent population projections indicate that with low levels of immigration (the kind observed during the first Trump administration), the nation’s population would start to decline after 2043, and its labor-force-age population will show no gains by 2035. Even with the higher levels of immigration observed during the early 2010s, national population growth would dip to levels far lower than observed in recent decades. As such, lower national immigration levels will lead to more substantial population declines or lower growth in many of the nation’s biggest metro areas and counties. It will also lead to negative national economic impacts that will yield adverse consequences on metropolitan economies as well.
All of this underscores the need for new thinking about the nation’s fraught immigration debate. Moving beyond the current obsession with deportations, it is going to be necessary simply from a “numbers” standpoint to implement a comprehensive system of immigration that will enable the nation and especially its large metro areas to sustain a future of economic and demographic growth.
Author

-
Footnotes
- The new census estimates for the period of 2010 to 2024, known as “vintage 2024 estimates,” should be used in place of earlier estimates for this period. A major change is the estimate of net international migration, which now takes greater account of recent asylee, humanitarian, and other immigration types, as discussed in the methodology provided by the Census Bureau.
- The recent census release included metropolitan areas and counties, but not all cities. However, several counties are coincident with city boundaries, including Philadelphia County, Denver County, and San Francisco County. New York City is the sum of Bronx, Kings, New York, Queens, and Richmond counties. Other cities, including Baltimore, St. Louis, and Washington, D.C., are known as county equivalents and were also part of this release.
The Brookings Institution is committed to quality, independence, and impact.
We are supported by a diverse array of funders. In line with our values and policies, each Brookings publication represents the sole views of its author(s).