The U.S. budget deficit is on track to be much bigger this year than last. Interest rates—a big issue given the level of the federal debt–have risen notably in recent months. And the U.S. faces long-run fiscal challenges associated with population aging that will require tax increases and spending cuts. But there is no reason to panic. The rise in the deficit this year isn’t because of a sudden surge in spending—it mostly reflects a fall in revenues from unusually high levels last year. As for interest rates, it is too soon to know whether the recent increases will persist, and if so, why. If the recent increase in rates is temporary, or if reflects an increase in expected GDP growth, then it will not affect the sustainability of the federal debt.
The deficit over the first 11 months of fiscal year 2023 (from October 2022 to August 2023) was $1.5 trillion, up $600 billion from last year. As a share of GDP, the deficit has increased from around 3.8% in the first 11 months of 2022 to 5.7% this year. (Measuring the deficit as a share of GDP adjusts for inflation and, more broadly, shows the deficit in comparison to a measure of the nation’s ability to finance it.)
Meaningful comparisons between this year’s deficit and last year’s require an adjustment for the rise and fall of President Biden’s student loan forgiveness plan. In September 2022, CBO increased its estimates of federal outlays for fiscal year 2022 to reflect the cost of the loan forgiveness (which was calculated as the present value of the loan repayments that would have been forgiven under the Biden plan.) Then the Supreme Court ruled the plan was unconstitutional. So, in August 2023, CBO recorded a reduction in outlays in FY 2023 essentially reversing its previous accounting. That reduction in outlays sharply reduces this year’s deficit. Excluding this outlay reduction, the deficit in the first 11 months of FY 2023 is actually 7% of GDP—almost twice as large as in the same period in FY 2022.
What has caused the deficit to increase this year?
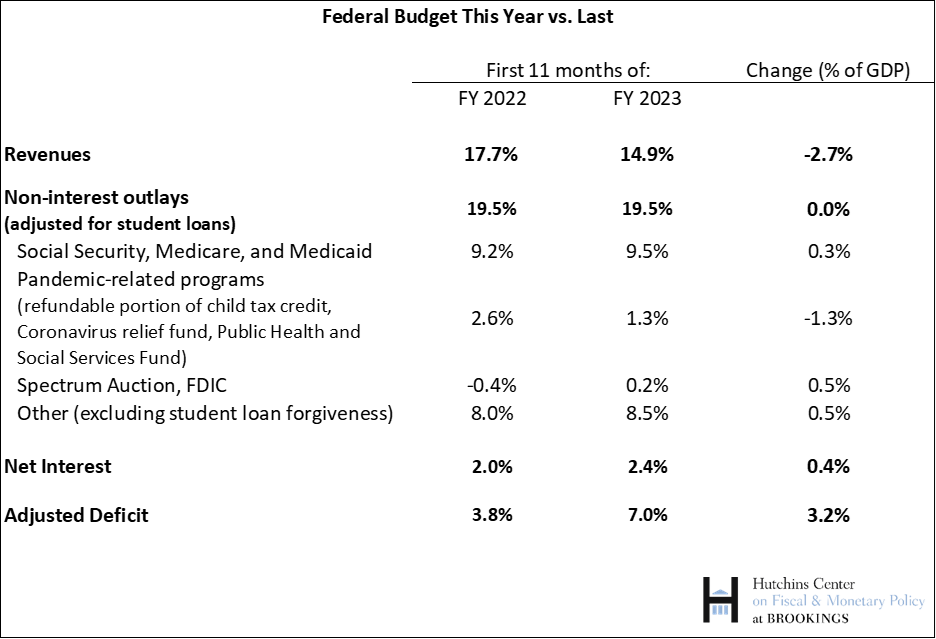
As can be seen in the table below, the main cause of the increase in the deficit is lower revenues in FY 2023 compared to FY 2022. Non-interest outlays (excluding the effects of student loan forgiveness) have been, on net, unchanged as a share of GDP, while interest costs have increased. I discuss each of these in turn.
Lower revenues
Revenues as a share of GDP were 2.7 percentage points lower in the first 11 months of FY 2023 than the same period last year. While the data to parse the sources of the decline are not yet available, the following factors are likely the most important:
- Lower capital gains than last year because of the performance of the stock market.
- Higher-than-normal tax collections last year because of the lag in the indexation of the tax brackets for inflation.
- Unexpectedly high (and potentially fraudulent) take-up of the employee retention credit.
- The tax filing extension until October 16, because of severe weather, provided to most California residents and business for taxes otherwise due between January and September of 2023.
- And, possibly, people choosing to minimize estimated tax payments given high interest rates.
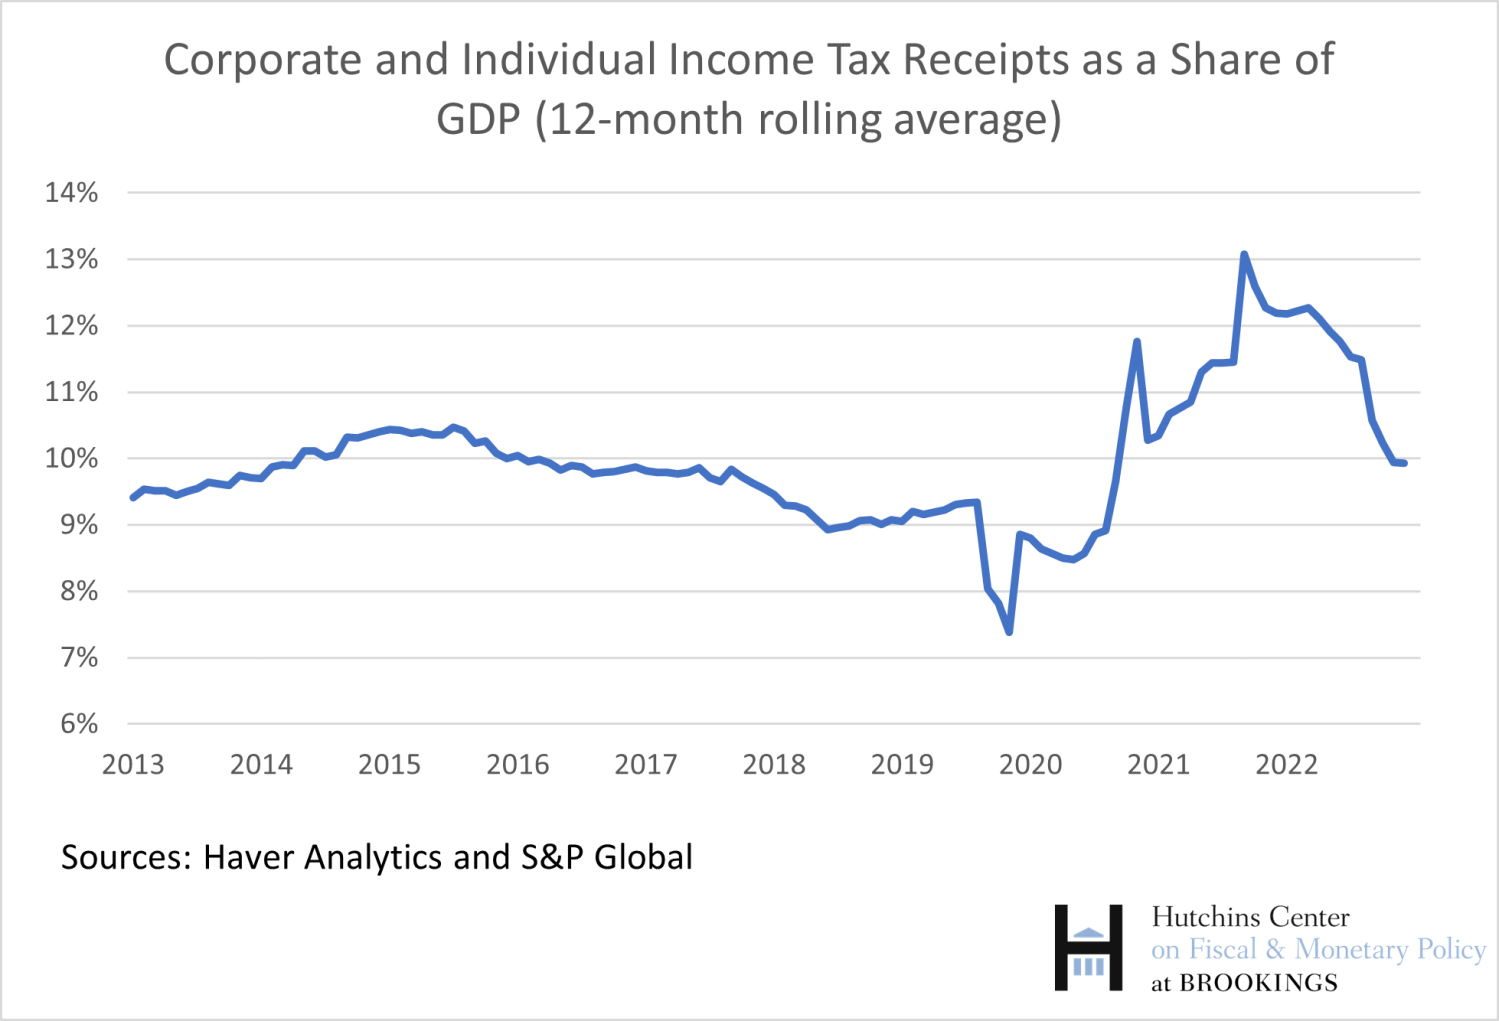
The first two factors explain why tax revenues are down this year from last year’s unusually high level. The figure below shows individual and corporate income tax collections as a share of GDP through July 2023 (I use S&P’s estimate of monthly GDP to make these calculations). Tax receipts in 2023 have been about in line with their longer-run averages—it is 2021 and 2022 that were unusual.
Furthermore, some (but not most) of the recent weakness will be made up in October, when the California tax filing extension expires. The IRS has also announced a moratorium on making payments on the employee retention credit, as many of the claims appear to be fraudulent. In any case, this credit was a one-time pandemic program and has no impact on tax liabilities beyond 2021, so it won’t be a source of weakness for much longer.
Non-interest outlays
Non-interest outlays (adjusted for student loans) as a share of GDP over the first 11 months of FY 2023 were unchanged from the FY 2022 level. But, given that some pandemic-era spending—notably, the expanded child tax credit—ended in 2022, why didn’t outlays decline?
As shown in the table above, spending on pandemic-related programs did decline, reducing outlays as a share of GDP by 1.3 percentage points. However, this decline was offset by an increase in other outlays.
Spending on Social Security, Medicare, and Medicaid edged up as a share of GDP, reflecting the ongoing retirement of the baby boomers as well as decreased recoveries of advance Medicare payments made during the pandemic. (See the box below for a discussion of the effects of inflation on spending as a share of GDP.) But other spending increased more. Much of this increase is either temporary or one-time—including an increase in FDIC spending related to the bank failures in spring 2023 (money which the FDIC expects to largely recoup), a decrease in spectrum auction proceeds, and an increase in outlays owing to the Employee Retention Tax Credit discussed above.
Interest on the debt
Net interest payments as a share of GDP increased 0.4 percentage point—reflecting higher interest rates on the debt. If these higher rates are the result of inflation, then, as discussed in the box, they do raise the deficit—but that rise in the deficit doesn’t end up increasing the level of debt relative to GDP.
What does the recent increase in real interest rates imply for the federal debt trajectory?
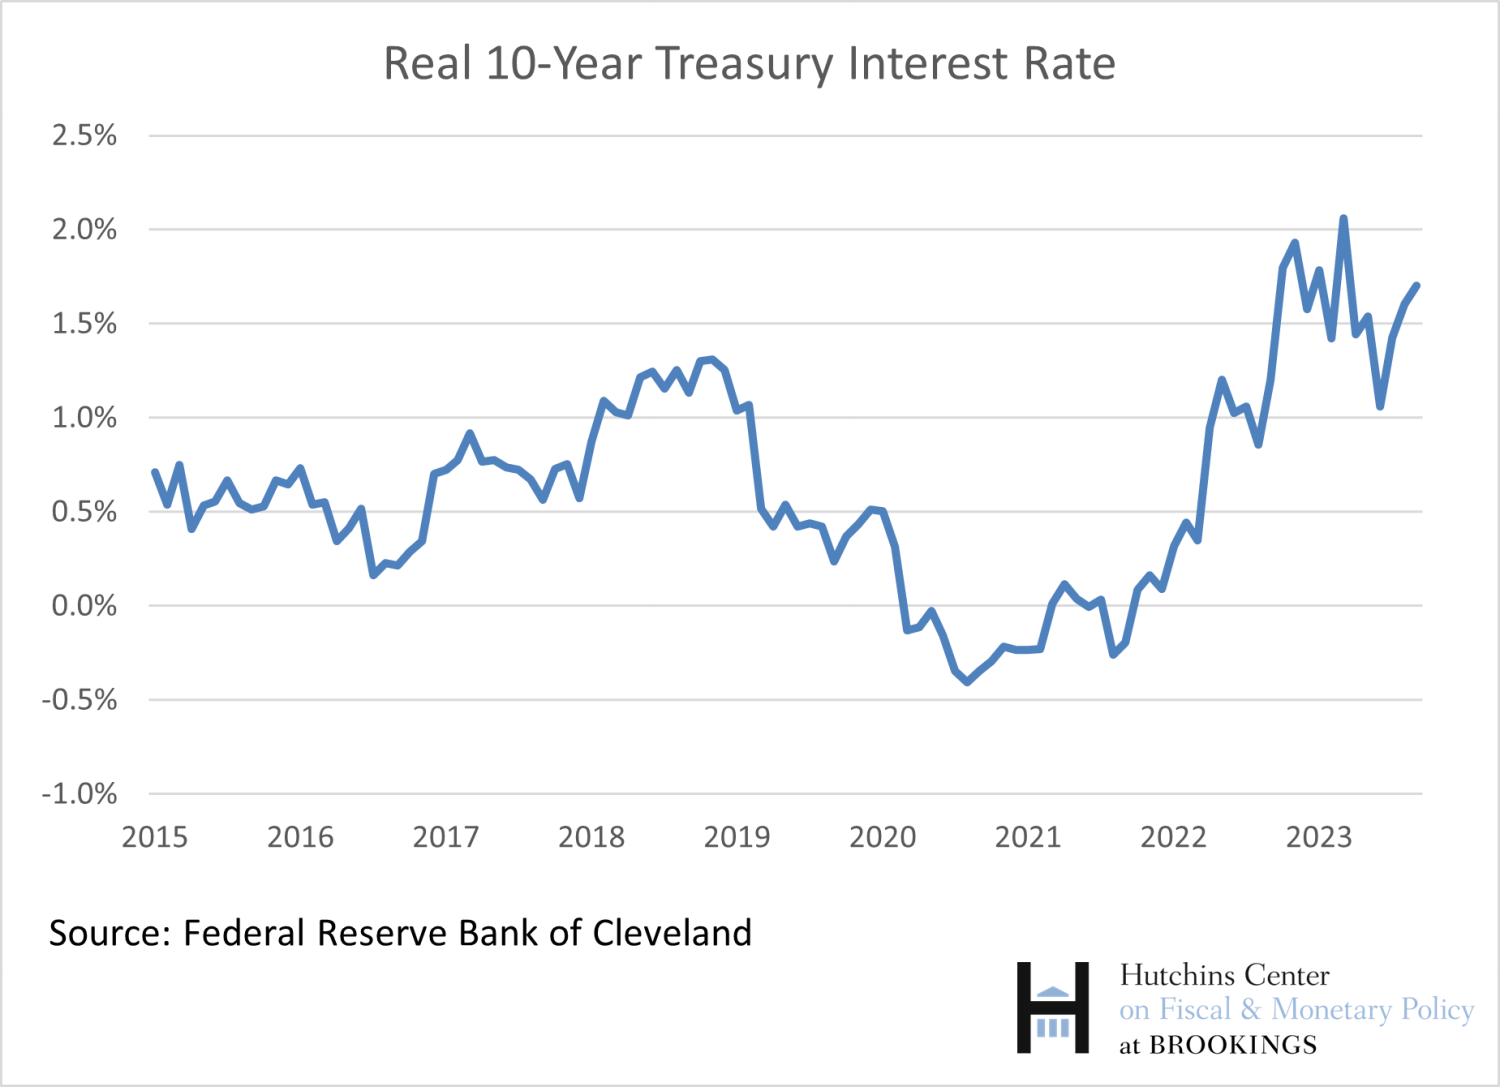
Real interest rates have increased sharply in recent months. The most recent reading from the Federal Reserve Bank of Cleveland (which uses a variety of measures of inflation expectations to calculate real rates) shows that the real interest rate on the 10-year Treasury was 1.7% in September—much higher than in the recent past.
Does this mean that the era of low interest rates is over—and does it mean that we should worry a lot more about the federal debt? Maybe, but it is much too soon to tell.
First—given the unusual economic conditions since the beginning of the pandemic, it is way too soon to know whether these higher real rates will persist. Second, even if they do persist, it matters why rates have increased. If rates have increased because productivity growth has increased—for example, in response to AI—then such an increase will also be neutral for the fiscal outlook, as shown in the equation in the box. If real rates have increased for other reasons—increasing worries about the fiscal trajectory, or the Fitch Ratings downgrade of the U.S. debt, for example, then it is possible that we will look back on this recent rise in rates as a turning point.
But CBO has long assumed that real interest rates would rise over time. For example, in their economic projections published this summer, they assume that, in 2025, once inflation is back to its pre-pandemic level, the real rate on 10-year Treasuries will be 1.6 percent—just a little lower than the most recent reading from the Cleveland Fed. That means that the recent rise in rates, even if it were to persist, would have only small effects on CBO’s long-run budget projections—projections on which most budget analysts rely, and which do show that we are on an unsustainable course.
Of course, for those who believed that interest rates would rise less than what CBO was projecting and felt more sanguine about the fiscal trajectory because of that belief, the recent rise in rates might be a reason to worry more. But there is still too much uncertainty to conclude that the fiscal outlook has materially changed because of higher interest rates.
How does higher inflation affect the budget?
Some commentators have pointed to inflation as a factor boosting the deficit. And while inflation does increase the dollar value of the deficit, it lowers the ratio of debt to GDP, the key metric of fiscal sustainability. In other words, high inflation is good for the federal budget.
To see why, we need to get just a bit wonky. The change in the ratio of debt to GDP from one year to the next is equal to the primary deficit (revenues less non-interest spending) plus the debt to GDP ratio multiplied by the difference between the nominal interest rate paid on the debt less the nominal growth rate of GDP:
What does an increase in inflation do? First, it reduces the primary deficit as a share of GDP somewhat, because GDP rises with inflation, whereas not all federal expenditures do. For example, Medicare payments to physicians are fixed in nominal terms and don’t rise with inflation. So the first term in the equation falls a bit when inflation increases.
Second, a rise in inflation raises the interest rate actually paid on federal debt by less than it raises the growth rate of nominal GDP, because not all federal debt is rolled over every year—that is, the federal government locked in lower interest rates in the past on some of its debt. A rise in interest rates due to higher inflation does raise interest payments and the deficit as a share of GDP because some debt is issued at the higher rates, but it lowers the debt to GDP ratio. (If all debt were continually rolled over, a rise in interest rates due to higher inflation would have no effect on the debt to GDP ratio even as it raised the deficit relative to GDP.)
-
Acknowledgements and disclosures
The Brookings Institution is financed through the support of a diverse array of foundations, corporations, governments, individuals, as well as an endowment. A list of donors can be found in our annual reports published online here. The findings, interpretations, and conclusions in this report are solely those of its author(s) and are not influenced by any donation.
The Brookings Institution is committed to quality, independence, and impact.
We are supported by a diverse array of funders. In line with our values and policies, each Brookings publication represents the sole views of its author(s).




Commentary
Op-edNo need to panic about the budget deficit
September 20, 2023