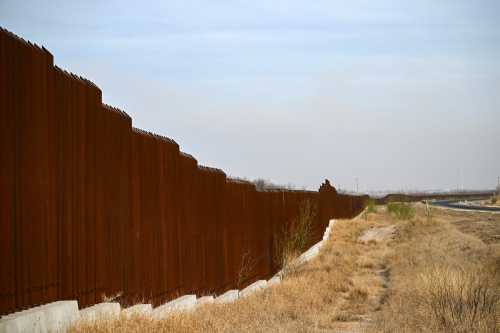
The terms “diversity” and “immigration” are constantly in the news in light of the current administration’s focus on eliminating diversity, equity, and inclusion (DEI) programs, increasing deportations, and reducing refugee admissions. Some scholars estimate that these and other programs could lead to zero or negative net international migration in this calendar year.
This stands in contrast with Census Bureau population estimates released late last year, which revealed that the nation’s population growth rate of nearly 1% for the year July 2023 to July 2024 was driven mostly by immigration. This growth represented a much-needed uptick from the historically low population growth of the COVID-19 period, along with the diminishing growth of recent decades.
Moreover, recently released census data documenting attributes of this growth point to the significant contributions made by the nation’s fastest-growing race-ethnic populations: Hispanic residents, Asian American residents, and persons identifying as two or more races, who registered growth rates of 2.9%, 4.2% ,and 2.7%, respectively.1 Together, these three groups accounted for 93% of the nation’s 2023-24 growth. In contrast, Black and American Indian and Alaska Native (AIAN) populations grew at rates of 1% and 0.4%, respectively, while the white population declined by 0.1%.
The growth of these three race-ethnic groups is significant for the nation’s future. They have been the fastest-growing groups since at least the year 2000, and are associated with immigration—the most viable demographic component for our future national population growth, along with natural increase (the excess of births over deaths).
Discussed below are the contributions of these fast-growing race-ethnic groups and others in recent years, with a focus on the 2023-24 population rebound. There is special attention paid to the nation’s youth population, for which these fast-growing groups are stemming population declines both nationally and at the state level. The last section discusses projected changes in the nation’s youth population as the population ages. It makes the case that the continued immigration of these same groups should not be reduced if we hope to counter a substantial future decline of America’s younger population.
Fast-growing race-ethnic groups contributed to the nation’s population rebound
The nation’s substantial 2023-24 population growth uptick, shown in Figure 1, stands in stark contrast to the 2020-21 growth nadir during the pandemic. This past year saw a rise in natural increase (from 146,000 to 519,000) and a substantial rise in immigration (from 376,000 to 2.8 million). The latter increase is larger than the nation has seen in decades, and provides a glimpse of what will be necessary to maintain population growth as natural increase levels are projected to decline.
Moreover, the new Census Bureau population estimates through 2024, broken down by race and ethnicity, give a sense of how fast-growing race-ethnic groups associated with recent immigration and positive natural increase can contribute to current and future population growth.
As in the recent past, Hispanic and Asian American residents comprise large shares of the nation’s immigrant populations, and because they are younger than the overall U.S. population, these groups and persons identifying as two or more races will contribute higher levels of births than deaths. As the oldest race-ethnic groups in the U.S., white residents have experienced a natural decrease (more deaths than births) in recent years, which, when combined with their relatively low level of immigration, have yielded negative overall white population growth (see downloadable Table A).
Figure 2 displays annual trends in the U.S. population from 2018-19 through 2023-24 (see downloadable Table B). For the total population and each race-ethnic group, the pandemic year of 2020-21 represents the smallest gain or greatest decline, only to bounce back strongly since, especially in 2023-24. White population losses were reduced, and larger 2023-24 gains are shown for the Hispanic and Asian American populations. Of the overall 2023-24 national population increase of 3.3 million, the combined Hispanic, Asian American, and two-or-more-race populations account for 3.1 million.
The impact of these fast-growing race-ethnic groups is especially significant when applied to the under-18 population. The 2020 census revealed that this young population showed an absolute decline nationally over the previous decade. Figure 3 shows that this trend is continuing (see downloadable Table B).
Looking at race-ethnic shifts, it is clear that the overall youth population loss is heavily driven by the decline in the under-18 white population. This decline has been occurring for well over a decade, in part due to the aging of the white population, which has proportionately fewer adult women in their prime childbearing years than other race-ethnic groups. As a result of more white people “aging out” of the youth group along with fewer white births and immigrants, there is a continued decline of white youth, which has not changed greatly since the pandemic. In addition to this loss of white youth, there is also a modest decline in Black and AIAN young people.
Hence, the Hispanic, Asian American, and two-or-more-races populations are the only three groups to register positive gains in their youth populations over the past three years and, together, served to stem the overall decline in this population. The actual 2023-24 youth population loss was -135,695. However, without the contributions of the three high-growth minorities, the youth population loss would have been -498,865.
These groups contributed to modest shifts in the sizes and race-ethnic profiles of the nation’s overall and youth populations. Figure 4 displays shifts that occurred from 2020 to 2024. It shows that the total U.S. population rose from 331 million to 340 million. Over this period, the Hispanic share of the population rose from 18.8% to 20%; the Asian American population from 6.1% to 6.7%; and the two-or-more-races population from 2.1% to 2.5%. At the same time, the white population share declined from 59.5% to 57.5%, and the Black and AIAN shares stayed steady at 12.6% and 0.7%, respectively.
Following the trend of the 2010s decade, the under-18 population continued to decline from 74.3 million July 2020 to 73.1 million in 2024. Again, the three fast-growing race-ethnic groups showed rising population shares: from 25.7% to 26.9% for Hispanic youth; 5.6% to 6.1% for Asian American youth; and 4.6% to 4.9% for two-or-more-races youth. At the same time, the white youth population share declined from 49.5% to 47.5%; the Black youth share rose modestly from 13.7% to 13.9%; and the AIAN youth share declined from 0.8% to 0.7%. While these four-year shifts are small, they point to the relative rise of the three fast-growing minorities which, as a group, are keeping the national youth population from declining even further.
Overall, this illustrates the role that these fast-growing, immigration-related race-ethnic groups can play over the long term in raising youth population growth and reducing the total aging of the nation’s population in the future.
How fast-growing race-ethnic groups impacted state population levels
When looking at the state level, the three fast-growing race-ethnic groups have an impact in all states, either by adding to population gains, reducing losses, or flipping from losses to gains. Of course, at the state level, population change is not only due to the contributions of immigration and natural increase, but domestic migration across state lines as well. So the impacts of these minorities on state growth will vary.
All states experienced gains in their 2023-24 Hispanic, Asian American, and two-or-more-races populations, including states with greatest population gains (see downloadable Table C).
Figure 5 displays 2023-24 gains for the six biggest-gaining states (Texas, Florida, California, North Carolina, New York, and New Jersey), along with the hypothetical gains if there were no contributions by these three groups. In three of these states (California, New York, and New Jersey), actual population gains would have been negative in the absence of these groups’ contributions. California is especially noteworthy, as it registered losses in its 2023-24 white, Black, and AIAN populations, but its gains among each of the high-growth race-ethnic groups resulted in the state seeing the third-largest 2023-24 population gain of all the states. Texas, Florida, and North Carolina showed net gains in their Black and AIAN populations (and in the case of Florida and North Carolina the white population as well), but those gains were far outpaced by those of the three rapidly growing race-ethnic groups.
Map 1 shows a broader view across all states. There are 16 population-gaining states where the three fast-growing race-ethnic groups accounted for all of their population gains. These include the Western states of California, Oregon, Washington, Nevada, and New Mexico; the Eastern states of New York, New Jersey, Pennsylvania, Maryland, Connecticut, and Rhode Island; and the Midwest state of Illinois.
Among the remaining 32 population-gaining states (including Washington, D.C.), the three fast-growing race-ethnic groups accounted for more than 75% of the gains in 18, and at least 40% of the gains in the rest. And among the three population-losing states of West Virginia, Vermont and Mississippi, the contributions of the three fast-growing race-ethnic groups sharply reduced those losses. Clearly, these groups had widespread impacts on state population gains.
Fast-growing race-ethnic groups reduced youth population losses in states
As discussed above, the nation is experiencing an absolute decline in its under-18 population, due in large part to substantial losses from the aging white population and modest national declines in Black and AIAN populations. This youth population decline is also pervasive across states (and Washington, D.C), with 39 sustaining under-18 population losses in 2023-24. All 50 states registered declines in their young white populations; 21 registered losses in their young Black populations; and 43 registered losses in their young AIAN populations (see downloadable Table D).
In each of the 12 states that did display 2023-24 youth population gains, all of those gains were attributable to their Hispanic, Asian American, and two-or-more-races populations. This is especially the case for the two states with the greatest youth population gains: Florida and Texas. As Figure 6 shows, Texas’ gain of 50,000 youths would have turned into a loss of 7, 400 were it not for the contributions of those three race-ethnic groups. Likewise, Florida’s youth gain of 49,400 would have become a loss of 12,800 without those groups’ contributions. This is also the case in several other states in the South, including Tennessee, North Carolina, South Carolina, Kentucky, and Alabama, as well as Northern states such as Massachusetts and New Jersey (see Map 2). Unlike any state, the District of Columbia gained white youth in 2023-24, but even here, the rapidly growing race-ethnic groups accounted for most of the youth population growth.
Just as significant were the contributions of these three fast-growing race-ethnic groups toward reducing the magnitude of youth declines across the rest of the country. Among the 39 states that registered youth population losses, 20 had their losses reduced by more than half due to the combined gains of Hispanic, Asian American, and two-or-more-races youth. These include the Western states of Arizona and Washington, as shown in Figure 6.
Due to recent and previous years’ race and ethnic demographic shifts, the combined Hispanic, Asian American, and two-or-more-races group—which represents 38% of the nation’s under-18 population—now comprises a sizeable share of the youth populations in quite a few states (see downloadable Table E). As Map 3 shows, these groups represent more than half of the youth in six Western and Southwestern states that have had a long-held presence of one or more of these groups: Hawaii, California, New Mexico, Nevada, Texas and Arizona.
In an additional 14 states in all regions of the country (including New York, Florida, Illinois, Virginia, Oregon, and Colorado), more than 3 in 10 young people belong to one of these three groups. And in another 16 states, more than 1 in 5 youth belong to one of the three groups. The last batch includes quite a few Midwestern states, including Kansas, Nebraska, Iowa, Minnesota, Wisconsin, and Indiana. In only two states, Maine and West Virginia, do less than 10% of youth identify as Hispanic, Asian American, or two or more races.
Immigration, fast-growing race-ethnic groups, and the future size of the nation’s youth population
As the nation’s population continues to age, one of its demographic challenges will be to stem the decline of its youth population. This is made plain with the newly released census estimates, which showed a continued rise in the older population compared with the young, leading to a rise in age dependency. Over time, smaller and younger generations displace larger, older generations in the labor force, leading to slower national productivity and more difficulties in funding old age assistance programs such Medicare and Social Security.
This raises the question: How can the nation’s youth population decline be abated? As I and other Brookings scholarshave suggested, this issue is best addressed with healthy immigration levels. Immigrants and their children are younger than the remainder of the population; this means that not only do immigrants add more people to younger segments of the population, but they also disproportionately increase the size of the female population that is in its prime childbearing years. Already, as Figure 7 shows, the nation’s under-18 population is heavily dependent on immigration. As of last May, nearly 3 out of 10 children were either foreign-born or children of at least one foreign-born parent. Clearly, immigration is an essential ingredient to augmenting the size of the youth population and dampening its continued decline.
Perhaps just as important is the race and ethnic makeup of these “immigrant additions” to today’s youth. As the analysis above suggests, most of these gains are attributable to first- and second-generation Hispanic and Asian Americans, as well as multiracial children to mixed-race couples who are also, to a large degree, immigration-related. If these patterns persist, it is likely that Hispanic, Asian American, and two-or-more-races youth associated with these immigrant additions will be key to reducing future youth population losses.
To get a sense of how this could work, Figure 8 draws from the Census Bureau’s population projections of the under-18 population through the year 2040 under four different net immigration scenarios.2 These are: a “high” scenario that assumes annual immigration of around 1.5 million people, which is substantially lower than 2023-24 but greater than most earlier years; a “medium” scenario that assumes annual immigration levels between 850,000 and 980,000 people, consistent with recent history prior to 2018; a “low” scenario of annual immigration between 350,000 and 600,000, consistent the latter years of the first Trump administration; and a “zero” scenario that assumes modest negative net immigration resulting from some out-migration and no in-migration.
When looking these 2040 projections, the “high” scenario is the only one that shows something close to a flat youth growth trajectory, ending with a 2040 youth population at 71.9 million. Each of the other scenarios shows a smaller 2040 youth population, with the “zero” scenario lowering the youth population to 59.4 million. Clearly, immigration will make a substantial difference in the size of the future youth population, where anything close to low or zero immigration would yield substantial losses.
These scenarios also yield quite different race-ethnic profiles of children in 2040. Each shows a substantial decline in the nation’s white youth population from current levels, along with smaller declines for the Black and AIAN youth populations. But the bigger variations occur for Hispanic and Asian American youth populations, with the former showing 2040 sizes ranging from 16.1 million under zero immigration to 21.4 million under high immigration, and the latter ranging from 2.8 million under zero immigration to 5.9 million under high immigration. The two-or-more-races youth population rises to more modest ranges.
While these projections are not precise predictions, they do show how much future immigration levels will matter in stemming sharp declines in the nation’s youth population. They extend the above analysis, which documents how fast-growing race-ethnic populations contributed to last year’s renewed population growth. As such, the future immigration of these groups in particular will provide important counterweights to the youth population declines that will occur if the nation’s aging population is not augmented with new, younger groups drawing from the regions and racial-ethnic backgrounds that have dominated our immigrant flows in recent decades.
This dynamic needs to be understood in the midst of discussions about the role of immigration and immigrants in the current political environment. There are certainly issues involved with policy, and it is high time to work on comprehensive immigration reform that addresses a variety of concerns. But from a “numbers” standpoint, there is no doubt that continued or even higher levels of immigration will be necessary to keep the nation’s demographic and economic growth vibrant. And from a societal standpoint, there is little question about the importance of welcoming and assimilating these new groups into an aging but multiracial nation that can greatly benefit from their contributions.
-
Footnotes
- The term “Hispanic” used in this article consistent with Census Bureau use. Alternative terms that could be used are “Latino,” “Latine,” or “Latinx,” among others. Other than the Hispanic group, all racial groups discussed here are non-Hispanic members of those races. The Asian American population pertains to persons who identify as “Asian” and those who identify as “Native Hawaiian and Other Pacific Islander.” Aside from that, racial categories refer to persons identifying as one race alone. Those identifying as more than one race are classified as “two or more races.”
- These census projections begin in the year 2022 and estimate annual population gains by age and race-ethnicity under different immigration scenarios.
The Brookings Institution is committed to quality, independence, and impact.
We are supported by a diverse array of funders. In line with our values and policies, each Brookings publication represents the sole views of its author(s).