
When the NAEP scores were released last week, math achievement had fallen by 1.3 points in fourth grade and 2.4 points in eighth grade. It was the first time that math achievement had fallen in either fourth grade or eighth grade scores since 1990. Given the controversy surrounding the Common Core State Standards, and the Partnership for Assessment of Readiness for College and Careers (PARCC) and Smarter Balanced Assessment Consortium (SBAC) exams aligned to them, many commentators have been asking two questions:
- Did the states taking the PARCC or SBAC assessments underperform other states with similar prior achievement?
- Could PARCC/SBAC participation explain the decline?
The answer to the first question, regarding whether the PARCC/SBAC participants had a larger decline than expected, is a tentative “yes.” The states which administered the PARCC or SBAC tests scored lower in 2015 relative to states with similar 2013 scores. However, the difference was small, less than one scale score point. As a result, the answer to the second question is “no.” Even taking the estimated underperformance as a causal effect, the difference between PARCC/SBAC participants and other states accounted for less than one-third of the absolute decline in math achievement between 2013 and 2015. Many states—not just the PARCC and SBAC participants– saw a decline in math achievement between 2013 and 2015.
Trends
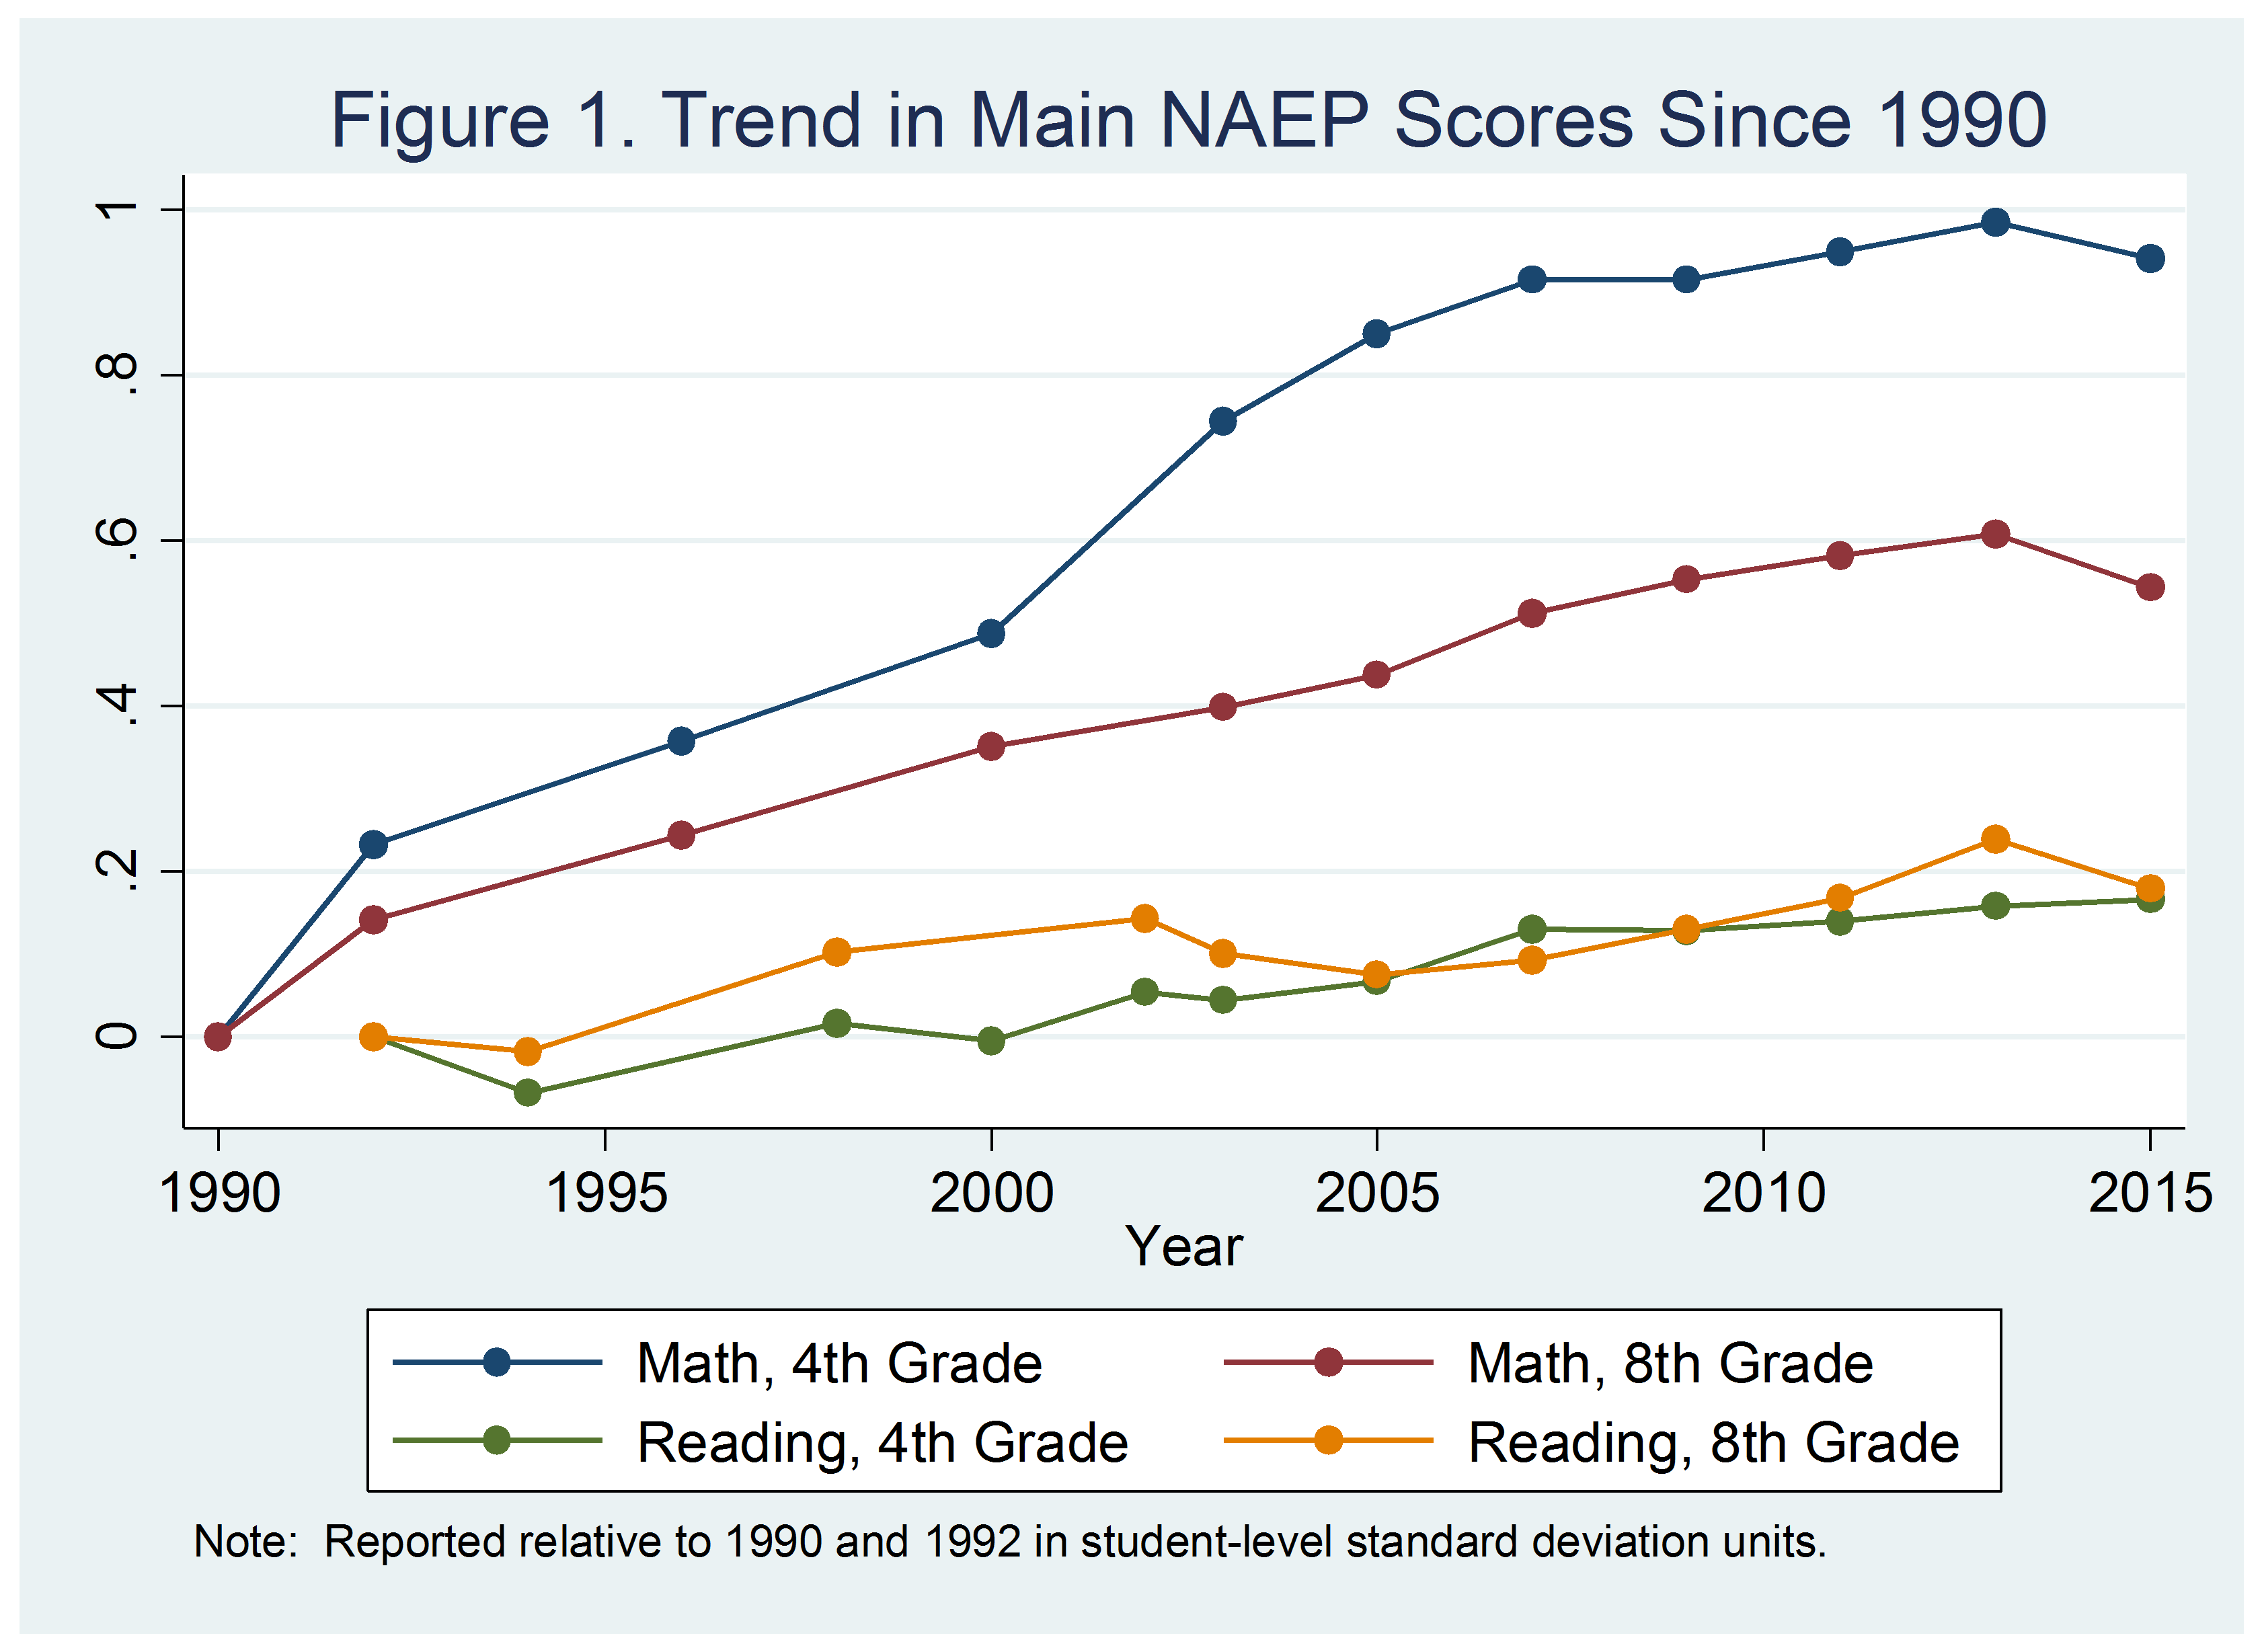
Figure 1 reports trends in fourth and eighth grade math and reading scores, relative to 1990 and 1992 respectively on the main NAEP assessment. Although the cumulative magnitude is not widely appreciated, math scores on the main NAEP assessment have risen steadily since 1990, rising by roughly .9 student-level standard deviations in fourth grade and .6 standard deviations in eighth grade over the past two and a half decades. However, math scores in both grades dipped in 2015.
The scores also dipped in eighth grade reading. However, that dip was much less anomalous, since the cumulative increases in reading scores have been smaller and the biennial changes less consistent over time.
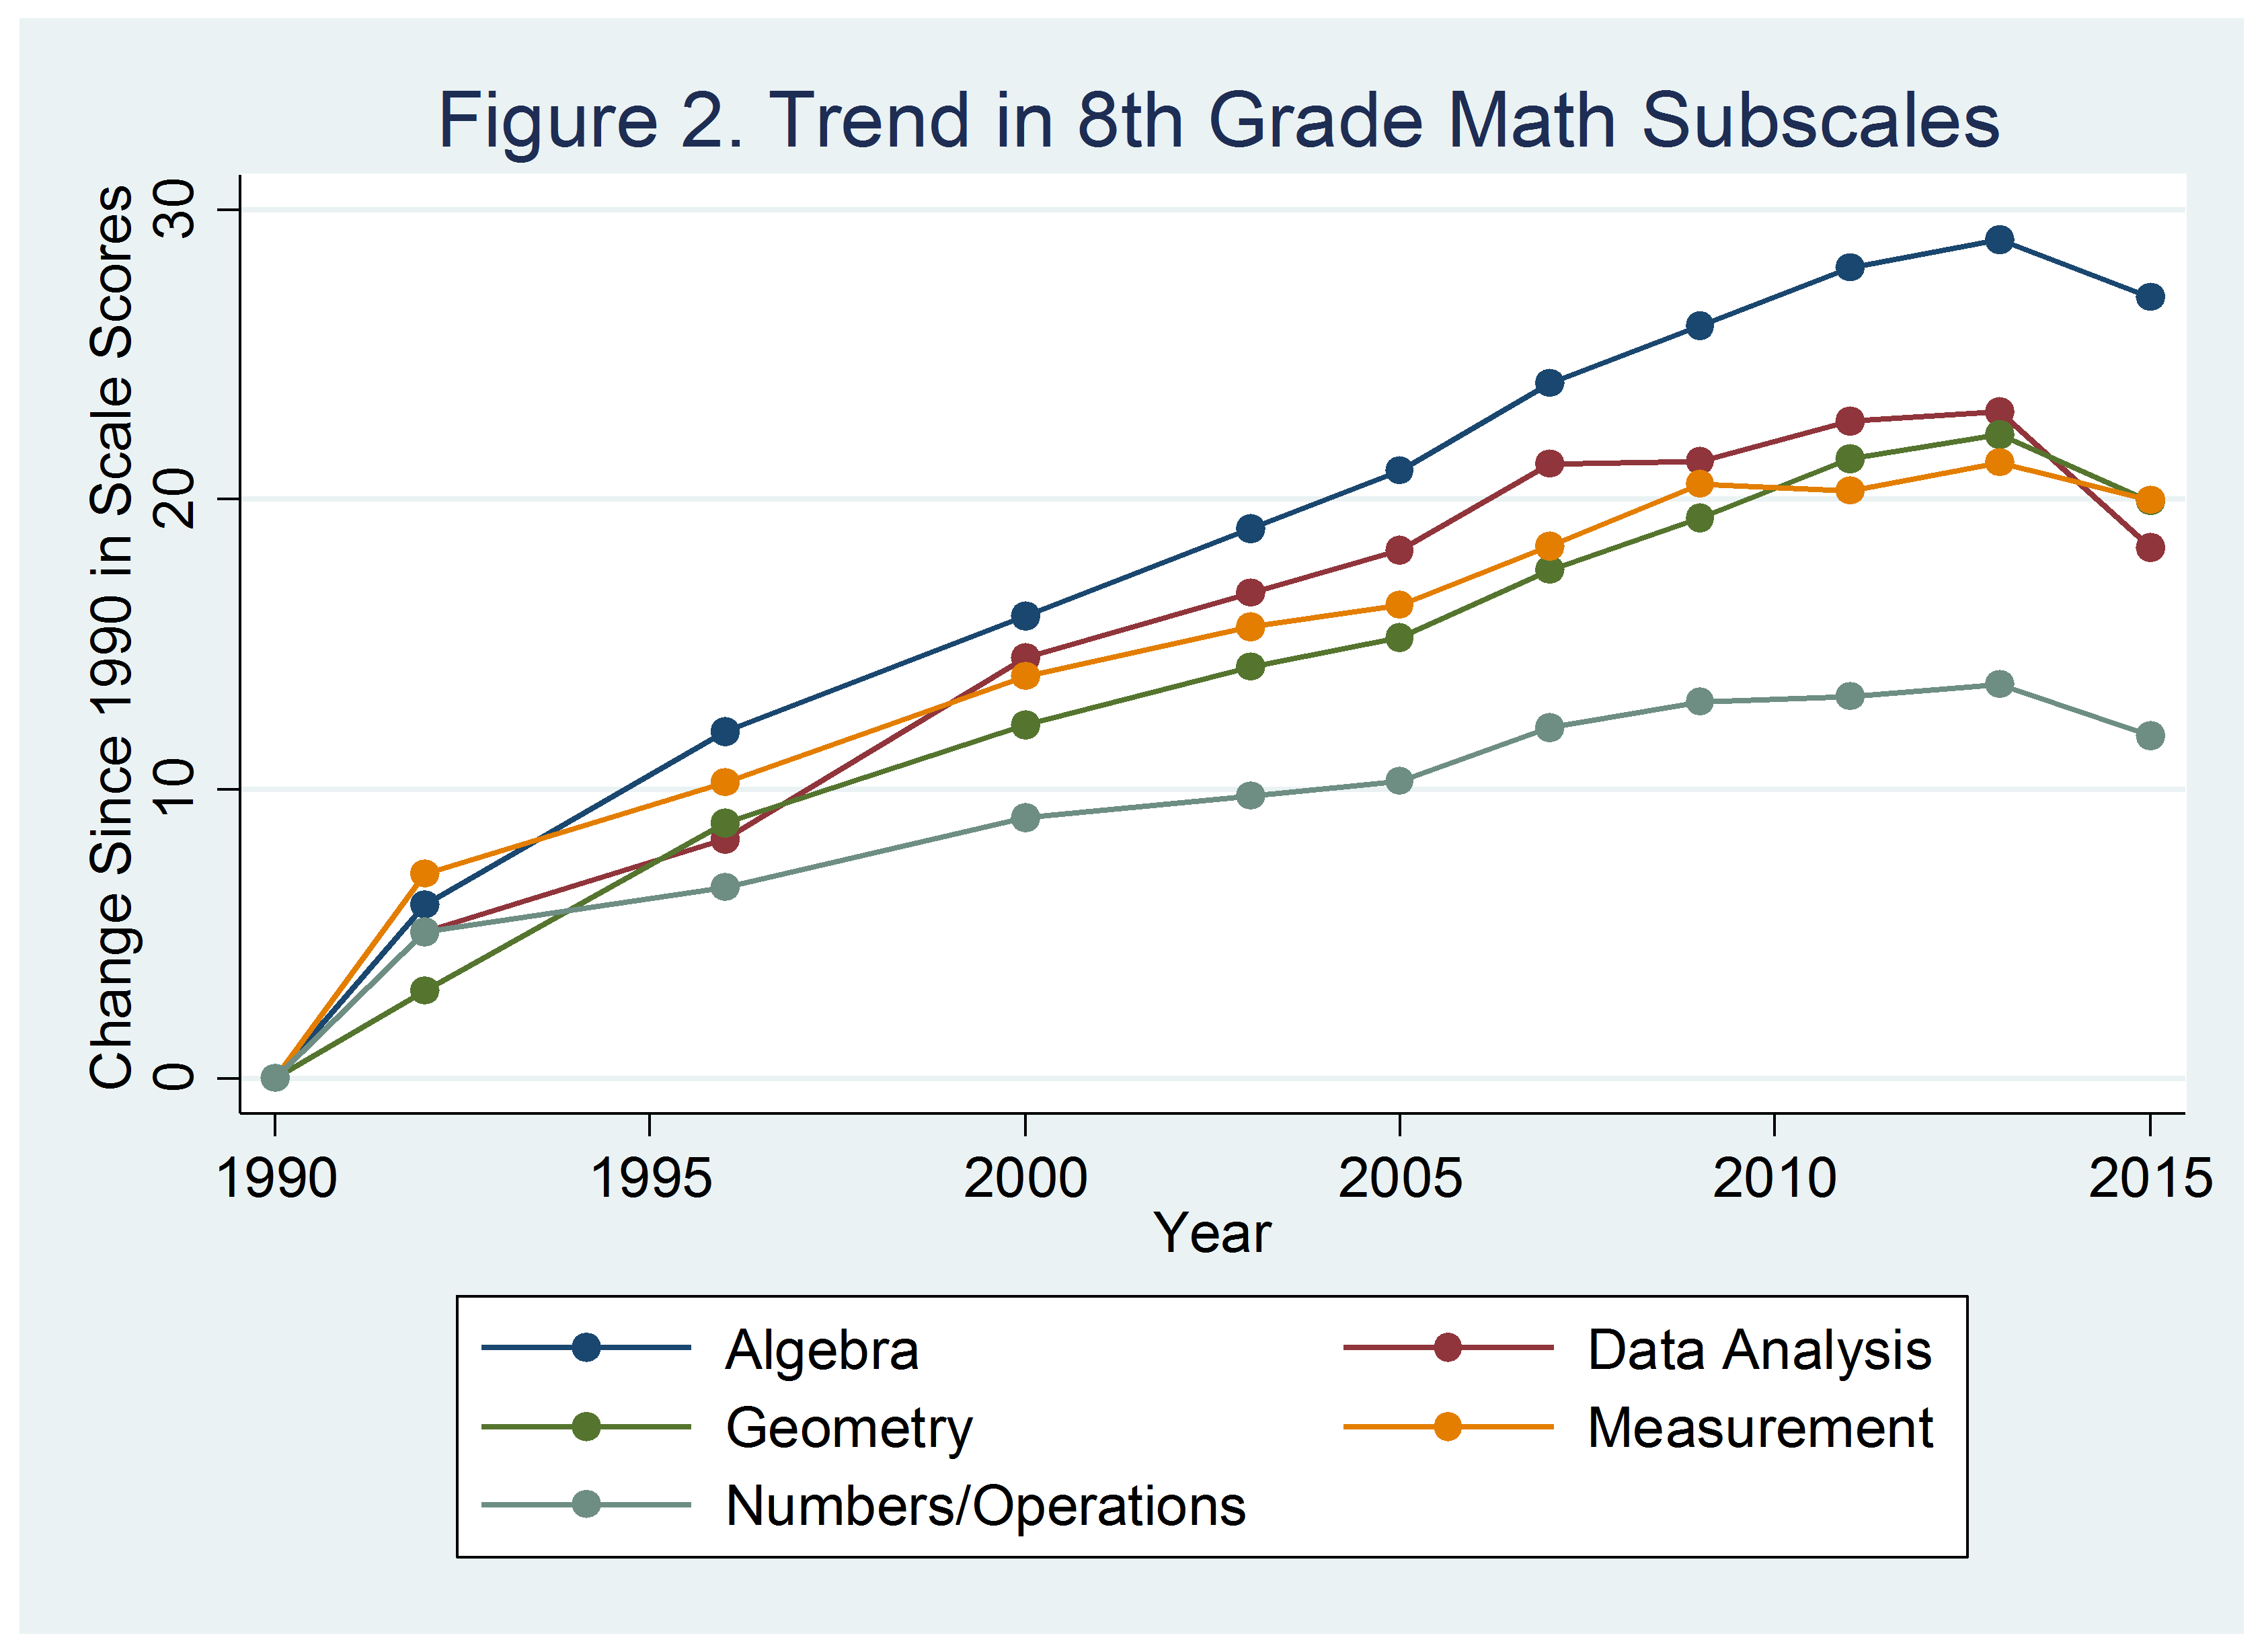
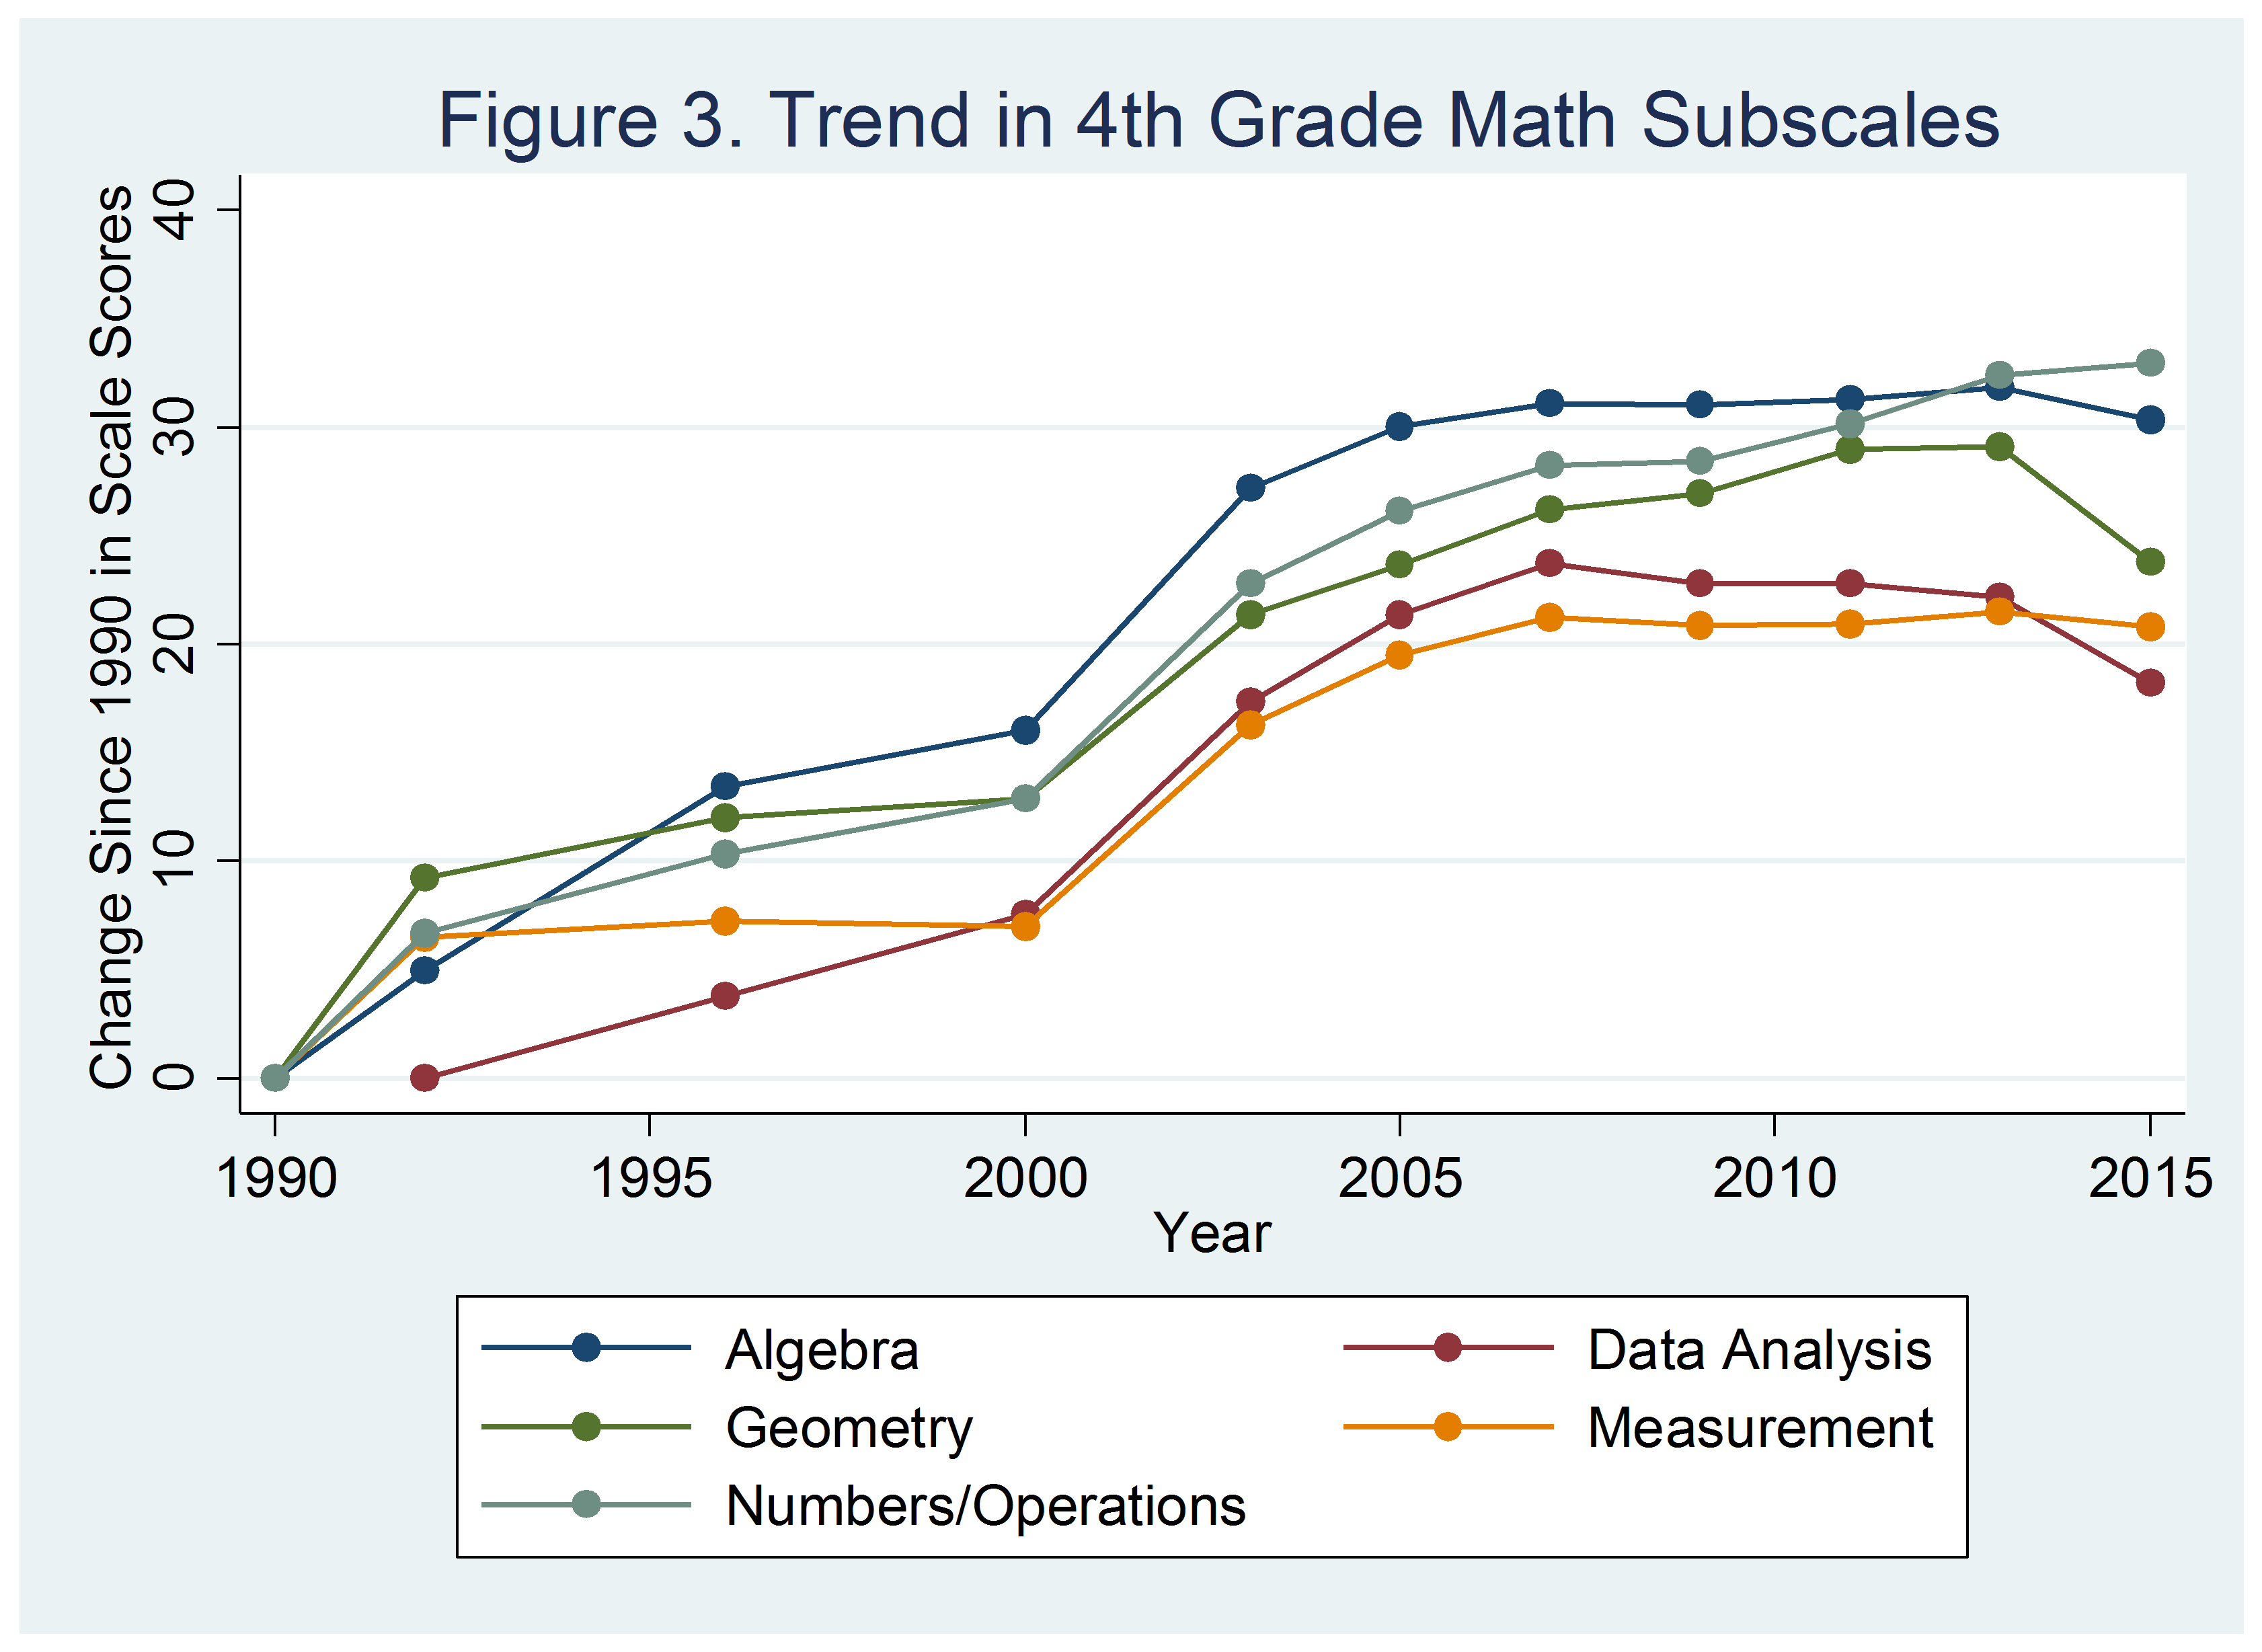
Figures 2 and 3 report the trend in subscale scores in fourth and eighth grade math respectively. In fourth grade, the decline in 2015 was statistically significant for three subscales, with scores on numbers/operations and measurement remaining largely unchanged. In eighth grade, the 2015 decline occurred in all five subscales. (The declines for Algebra, Geometry, Data Analysis and Numbers/Operations were all statistically significant at the .05 level. The decline for measurement was significant at the .10 level.) In both fourth grade and eighth grade, the largest declines were measured in the data analysis subscale.
Analysis
In the spring of 2015, 28 states plus the District of Columbia administered either the PARCC or SBAC exams. Because 2015 was the first full administration of either assessment, teachers in those states were likely to have been particularly focused on shifting their instruction to address the new standards.
In an Evidence Speaks article last week, Russ Whitehurst compared the change in scores in the PARCC and SBAC states to the remaining states. For his test score measure, he used the average of the fourth and eighth grade math scores in 2013 and 2015. He found that the average combined math score fell by approximately one scale score point more in the PARCC/SBAC states than in the remaining states.
In Table 1, I perform a similar exercise, regressing the 2015 score on the 2013 score and an indicator for whether or not the state participated in PARCC or SBAC in 2015. In the interest of transparency and to explore the robustness of the findings, I repeat the analysis for multiple outcomes and a variety of student subgroups. Using the average score of fourth grade and eighth grade scores, the PARCC/SBAC states underperformed states with similar 2013 scores by .8 scale score points (p-value=.059). The estimate in Table 1 is largely consistent with that reported by Whitehurst (although, due to the use of robust standard errors, the estimated precision is somewhat lower.) As reported in the columns on the right of Table 1, the estimates are similar in magnitude (albeit less precise) when estimated for fourth and eighth grade separately.
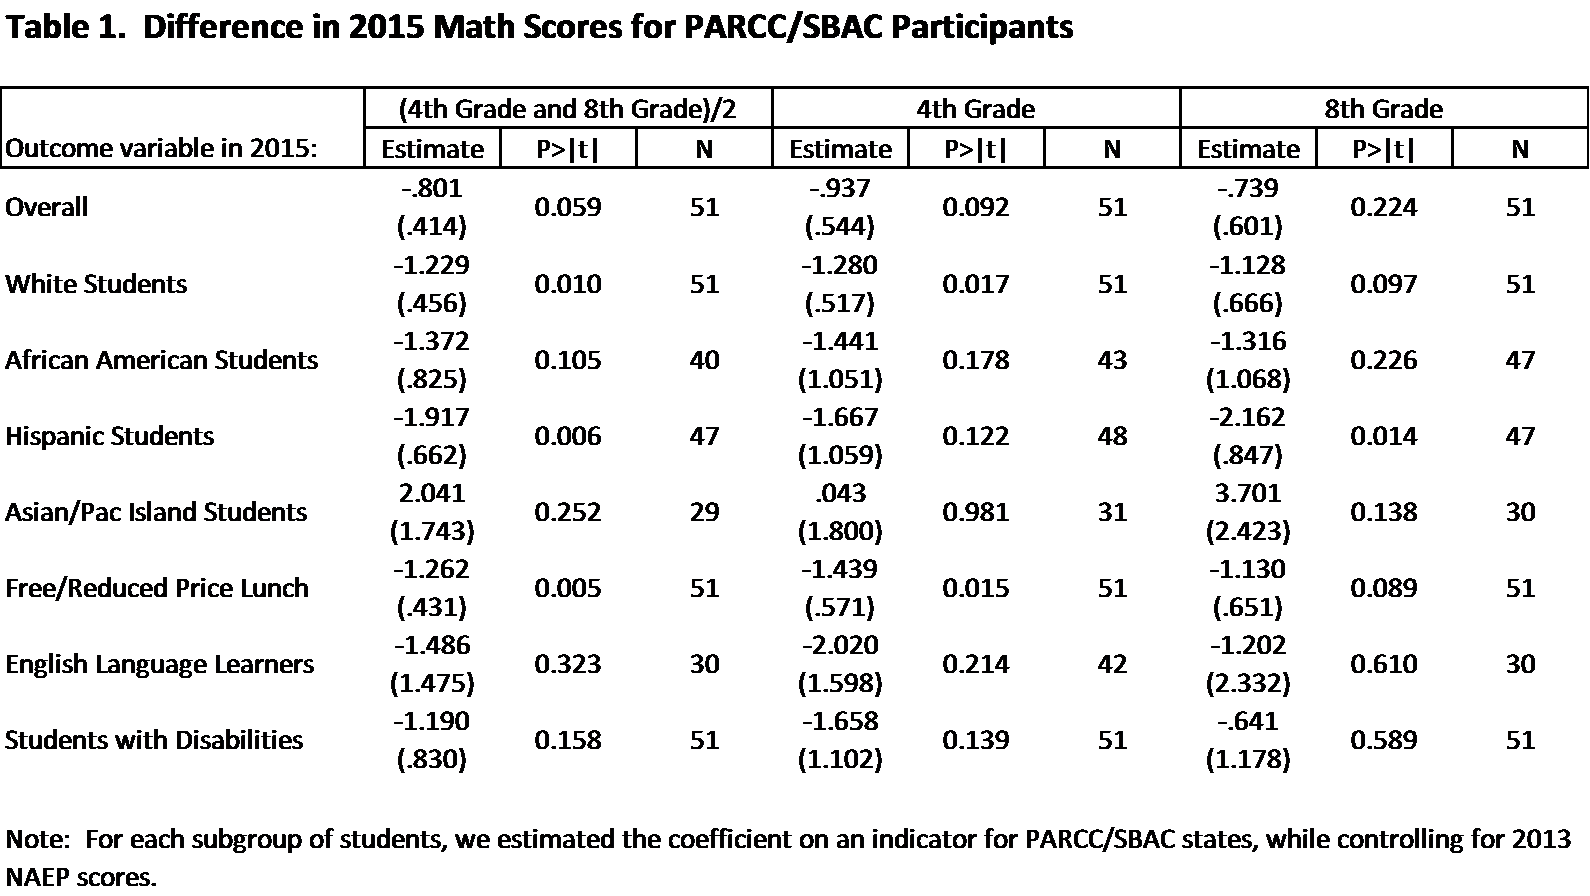
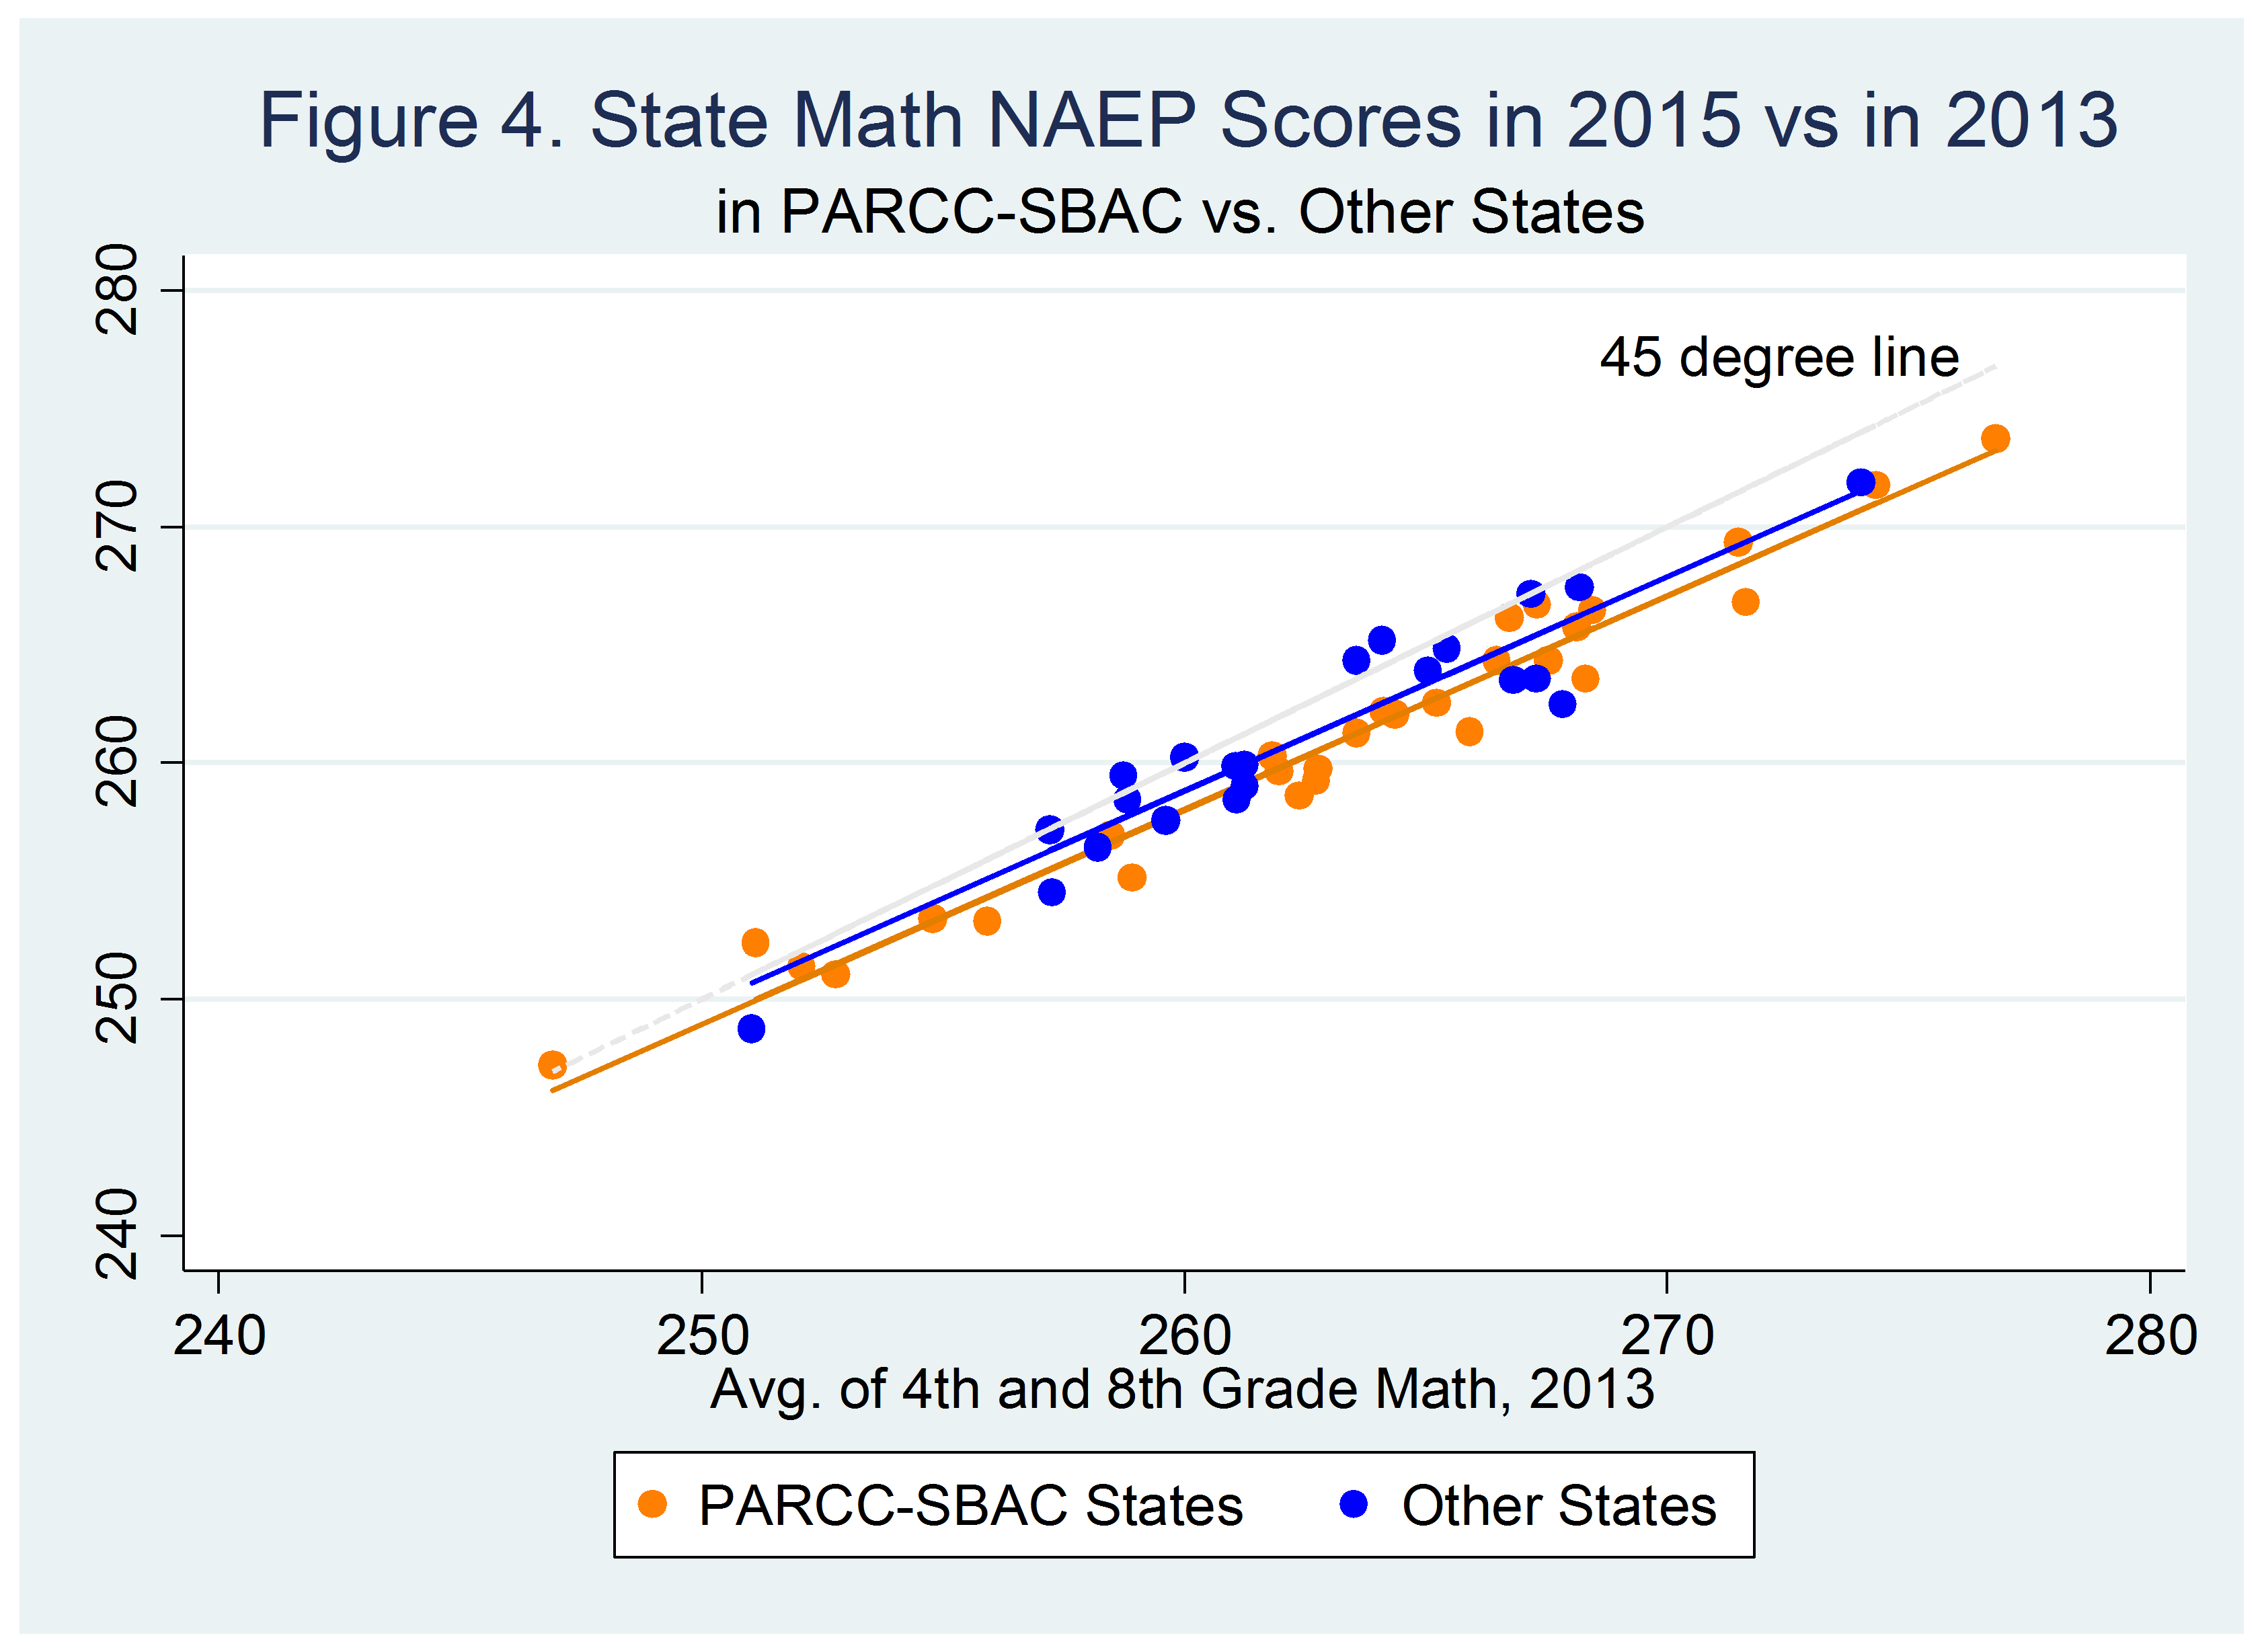
Figure 4 provides a helpful visual summary of the evidence as it stands. On the vertical axis is the average of each state’s fourth and eighth grade math score in 2015. On the horizontal axis is the average state score in 2013. The orange dots correspond to the PARCC-SBAC states, with the blue dots representing the remaining states. The distance between the fitted lines corresponds to the estimated coefficient on PARCC-SBAC participation in the first row of Table 1. Although many of the blue dots lie above the orange dots, there is also overlap and the difference is small. (In fact, the difference in the two lines is just large enough as to be unlikely to have occurred by chance.) The figure also contains a 45 degree line, along which scores would have been unchanged between 2013 and 2015. Only a few of the orange or blue dots are above the 45 degree line, implying that most states—whether they be PARCC-SBAC participants or not—saw declines.
The subsequent rows of Table 1 report estimates for various subgroups of students. For instance, when looking at combined scores, white students in PARCC/SBAC states underperformed white students in states with similar prior achievement by 1.229 points (p-value=.010). Hispanic students and students who were eligible for the Free/Reduced Price Lunch program underperformed by 1.917 (p-value=.006) and 1.262 (p-value=.005) points respectively.
Sarah Lubienski, a professor of mathematics education at the University of Illinois, noted the larger decline in the data analytics subscale score and suggested that the Common Core delays the study of data analysis/statistics until sixth grade. As a result, I redid the analysis above for fourth and eighth grade data analysis subscale scores. The estimated effect of PARCC/SBAC participation in fourth grade was -1.32 points (p-value=.055)—larger than the point estimate for the composite scores. The estimated effect of PARCC/SBAC participation was -.8 in eighth grade data analytics (p-value=.46). Given that we would have expected effects on fourth grade, but not eighth grade, this is at least partially consistent with Dr. Lubienski’s hypothesis. To some extent the decline may be due a shifting of the standards across grades. But should we care if data analytic scores declined in fourth grade in the PARCC/SBAC states if those content standards have been moved?
Impact of Exclusion and Accommodation Rates
In NAEP, when sampled students are identified in school files as having disabilities or as English Language Learners, they can either be offered appropriate accommodations or, in some cases, excluded from the sample. Large changes in either the exclusion or accommodation rates could lead to changes in mean reported scores, even if there were no change in the mean score for the underlying population. As a result, in Table 2, I compare the changes over time in both accommodation and exclusion rates in the two groups of states.
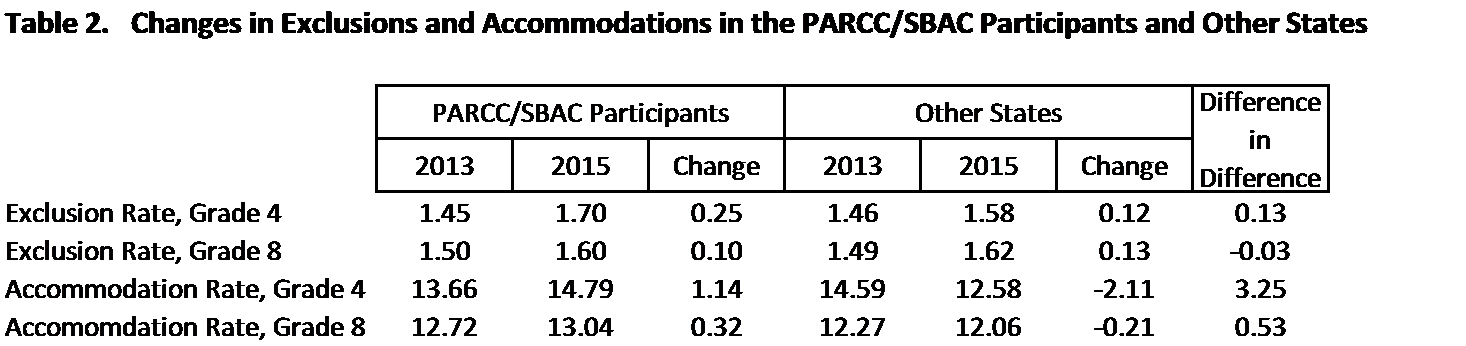
Between 2013 and 2015, the exclusion rates in the PARCC/SBAC states started out at less than two percent and increased by .25 and .10 percentage points in the PARCC/SBAC states and other states respectively. The exclusion rates were low to begin with and the changes were similar in the non-participating states. The percentage of fourth grade students offered accommodations rose by 1.14 points in the PARCC/SBAC states and fell by 2.11 percentage points in the other states, yielding a differential increase in accommodation percentages in the PARCC/SBAC states of 3.25 points. That is the only statistically significant difference in Table 2. However, to the extent that such accommodations allow students more time or have the exams read aloud, we might expect such an increase to have led to increases in performance in the PARCC/SBAC states. Although such a small change in the accommodation rate may not have generated a large impact, it would have favored the PARCC/SBAC states and thus cannot explain the decline.
Discussion
The above results confirm the finding, first reported by Whitehurst, that the states participating in the PARCC/SBAC exams scored roughly .8 scale score points lower than non-participating states with similar achievement on the 2013 exam. One possible explanation is a short-term disruption, as schools were struggling to retool themselves to deliver on the Common Core. There was a tremendous amount of retooling going on. In a forthcoming report from the Center on Education Policy Research at Harvard on implementation of the Common Core in five PARCC and SBAC states, we learned that more than half of elementary teachers and two-fifths of middle school teachers reported having changed more than three-quarters of their classroom instruction. Two-thirds of elementary math teachers report changing three-quarters or more of their instructional materials. Nearly half of elementary math teachers and more than one-third of middle school math teachers reported adopting a new textbook in 2013-14 or 2014-15. (Keep an eye out for the report to be released in December at http://cepr.harvard.edu/.)
However, even if we were to take such an estimate as reflecting the short-term impact of preparing for the PARCC/SBAC exams, how much of the decline in the national average could it explain? (By asking this question, I do not mean to imply that Russ Whitehurst suggested that PARCC/SBAC did explain it all. He did not. On the contrary, he described the decline as “modest” and pointed out that even those not participating in PARCC/SBAC had declines too. However, it’s important for the discussion to try to quantify the magnitude of the contribution.) The states participating in PARCC and SBAC represent roughly 48 percent of all public elementary and secondary schools in the United States. That means that if we were to add .8 points to the scores in each of the PARCC and SBAC states, it would boost national achievement by .38 points (.8 times .48). Such a boost would have eliminated 29 percent of the 1.3 point decline in fourth grade math and 19 percent of the 2.4 point decline in eighth grade math. In other words, the majority of the decline would have remained.
Let’s hope the small decline which occurred in the PARCC/SBAC states in 2015 was a short-term phenomenon, caused by many thousands of schools undertaking major instructional changes at the same time. However, given the combination of high standards and use of many more open-ended items on the PARCC and SBAC tests, requiring students to explain their thinking, to write coherently and to demonstrate conceptual understanding, perhaps we will see an acceleration of progress in student achievement, in literacy as well as math. Unfortunately, regarding the reasonableness of that hope, the NAEP scores don’t shed any light in either direction at this point.
The Brookings Institution is committed to quality, independence, and impact.
We are supported by a diverse array of funders. In line with our values and policies, each Brookings publication represents the sole views of its author(s).