
- Homepage
- Introduction
- Chapter 1: Which districts allocate resources progressively?
- Chapter 2: Does teacher sorting contribute to financial inequalities?
- Case studies: Massachusetts, Indiana, Louisiana, Nevada, New York, and North Carolina
- Methodological appendix
Introduction
Two parallel movements in education policy over recent decades have attempted to reduce inequalities in public schools, though inequalities of different forms. On one side, schools in the U.S. have historically spent lower amounts on a per-pupil basis in socioeconomically disadvantaged communities than those in more affluent areas. On the other side, research has shown teachers matter greatly to students’ immediate and long-term outcomes, but student access to quality teaching is stacked against those from disadvantaged communities.
Both problems have commanded policy attention in the modern era of education reform, though progress on these issues has been uneven. States have made important advances in school finance reform over recent decades, significantly narrowing spending gaps (though important gaps still exist in some contexts). Conversely, progress on the teacher quality side has been less encouraging. Evidence shows teacher qualifications among entering teachers has shown modest improvement, but policy efforts to strengthen the teacher workforce (primarily during the Race to the Top era) were often perceived as federal overreach by states and with hostility among teachers, with little discernable progress at scale.
Perhaps the divergent progress in these two policy areas is most vividly illustrated through the lens of responses to the COVID-19 pandemic. States and school districts are flush with cash, particularly aimed at helping schools serving disadvantaged student populations recover from learning losses sustained during the pandemic. Simultaneously, the stability of the teacher workforce is at risk, with teachers reporting high levels of stress, burnout, and intentions to leave the profession.
“…we find economically disadvantaged students have systematically lower access to experienced teachers across all states and, simultaneously, slightly progressive teacher spending within districts.”
But perhaps there is more in common between these two issues than we recognize. After all, they have largely been analyzed by different scholars in different subfields of education policy and have very different decisionmakers driving the outcomes we see. But what if the two issues are more intertwined than previously thought?
This chapter seeks to explore the interplay between financial and teacher resources to better understand how their inequalities relate, if at all. Using data from the Edunomics Lab at Georgetown University’s National Education Resource Database on Schools (NERD$), we analyze staffing and spending patterns across six states to explore these inequalities. In summary of our findings, we find economically disadvantaged students have systematically lower access to experienced teachers across all states and, simultaneously, slightly progressive teacher spending within districts. This seemingly contradictory result is reconciled by examining staffing patterns, which we find systematically allocate more teachers and other instructional support staff into schools serving high-need students, essentially compensating for low access to experienced teachers.
background
Personnel expenditures play a major role in education finances. Estimates put these expenditures (salaries plus benefits) at nearly 80% of all spending, based on 2018-2019 data. Naturally, expenditures specifically for teachers constitute the lion’s share of all personnel spending, which has prompted some scholars to argue that inequalities in overall school spending patterns are, in part, a reflection of inequalities in teacher salaries across different settings.
Teacher payrolls likely factor into overall financial inequalities across schools, though the nature of the relationship between the two is not well understood. The widespread use of fixed salary schedules combined with documented teacher sorting patterns—where the least experienced and credentialed teachers are more commonly hired in disadvantaged school settings—should theoretically result in more money being spent on teachers in more affluent settings, all else equal.
Yet, these spending differences have been difficult to detect. Prior studies point out payroll-based inequalities could be hidden from close public scrutiny as essentially mechanical reflections of salary schedules for variable teaching staffs across schools. For example, the comparability requirement in Title I’s Supplement-Not-Supplant rules mandates equal distribution of funds (or more progressive distributions favoring students in poverty) across schools before spending federal dollars in Title I-eligible schools. Yet, this rule explicitly excludes payroll differences that may arise across schools, so long as the salary schedule is comparable across schools.
“In aggregate, the evidence suggests these payroll differences could be important contributors to overall funding gaps despite varying across contexts.”
The larger significance of these payroll-induced inequalities is unclear, though prior work in school finance has explored the issue. In aggregate, the evidence suggests these payroll differences could be important contributors to overall funding gaps despite varying across contexts. These analyses, however, are only possible with access to teacher or instructional spending at the school level, often limiting analysts to data coming directly from districts. Consequently, the literature is a scattershot of different districts across multiple states with differing accounting assumptions, limiting comparability and generalizability of these findings. Only one study, authored by David Knight, explores the issue nationwide using teacher salary data reported in the Civil Rights Data Collection. Many of the patterns he originally documented are echoed here, and we highlight those areas of overlap below.
Data and methods
Our analysis of teacher spending uses financial data from the NERD$ database representing six states: Indiana, Louisiana, Massachusetts, Nevada, New York, and North Carolina. These states were selected primarily because the spending variables reported in the NERD$ data offered a sufficiently narrow window into teacher spending at the school level, which is the unit of analysis needed to execute the investigation. The teacher spending measures were slightly different in each state (Massachusetts reports teacher salaries; New York reports classroom salaries; North Carolina reports all school personnel salaries; Indiana, Louisiana, and Nevada report instructional spending). Notwithstanding these differences, we refer to these measures collectively as “teacher spending” throughout the report. Reconciling some of these differences is part of the analysis below.
To create the final samples for each state, we merged in data from the Civil Rights Data Collection (2017-2018) and the Common Core of Data (2018-2019). The analysis sample was composed of regular public schools, and we dropped schools with plausibly erroneous data and extreme values on key variables to avoid outliers from driving our results. Further details on data and sample trimming are documented in the accompanying appendix.
We are primarily interested in resources allocated to economically disadvantaged students versus to those who are not. Historically disadvantaged communities often show strong associations with racial/ethnic backgrounds, though income has become increasingly important over time and is our primary variable of interest throughout this report. We use student eligibility for the federal free or reduced-price lunch program (FRPL) as a proxy for coming from a low-income household. With each state’s data, we analyze spending patterns on teachers and across all spending types to explore their interaction. We also analyze staffing patterns across schools to compare the allocations of financial resources to that of human resources in schools. We do this by calculating financial and staffing inequalities within and across districts using a formula weighted by the number of students belonging to each group and a wage index to control for differing costs across districts (see the appendix for full methodological details). We can detect differences in spending and staffing across schools but cannot observe variation within schools.
Results
We focus on broad staffing and financial patterns that we see across the six study states. Our concern is not on the specific dollar amounts spent, but the patterns of resource access for disadvantaged students within each state, compared to non-disadvantaged students. Short synopses of state-specific findings, along with interactive data visualizations, are published separately (see Indiana, Louisiana, Massachusetts, Nevada, New York, and North Carolina). We highlight five key findings based on our analysis.
Finding 1: Economically disadvantaged students in all study states have lower access to experienced teachers than those who are not.
First, we explore how teachers are distributed across students, primarily to confirm whether we see corroborating evidence of adverse teacher sorting in our study states. The variable of interest is the share of novice teachers (those in their first or second year of teaching) measured at the school level, as this is our main variable of teacher qualifications available to us. We regress this variable against the share of economically disadvantaged students in each school plus a standard set of school-level covariates, estimating each model separately by state. Figure 1 presents a coefficient plot of the point estimates on the share of FRPL-eligible students for each state (lines show confidence intervals). The left panel presents point estimates based on a district fixed effects model, estimating observed differences in novice teacher share within districts. The right panel presents point estimates looking across the entire state (no district fixed effects).
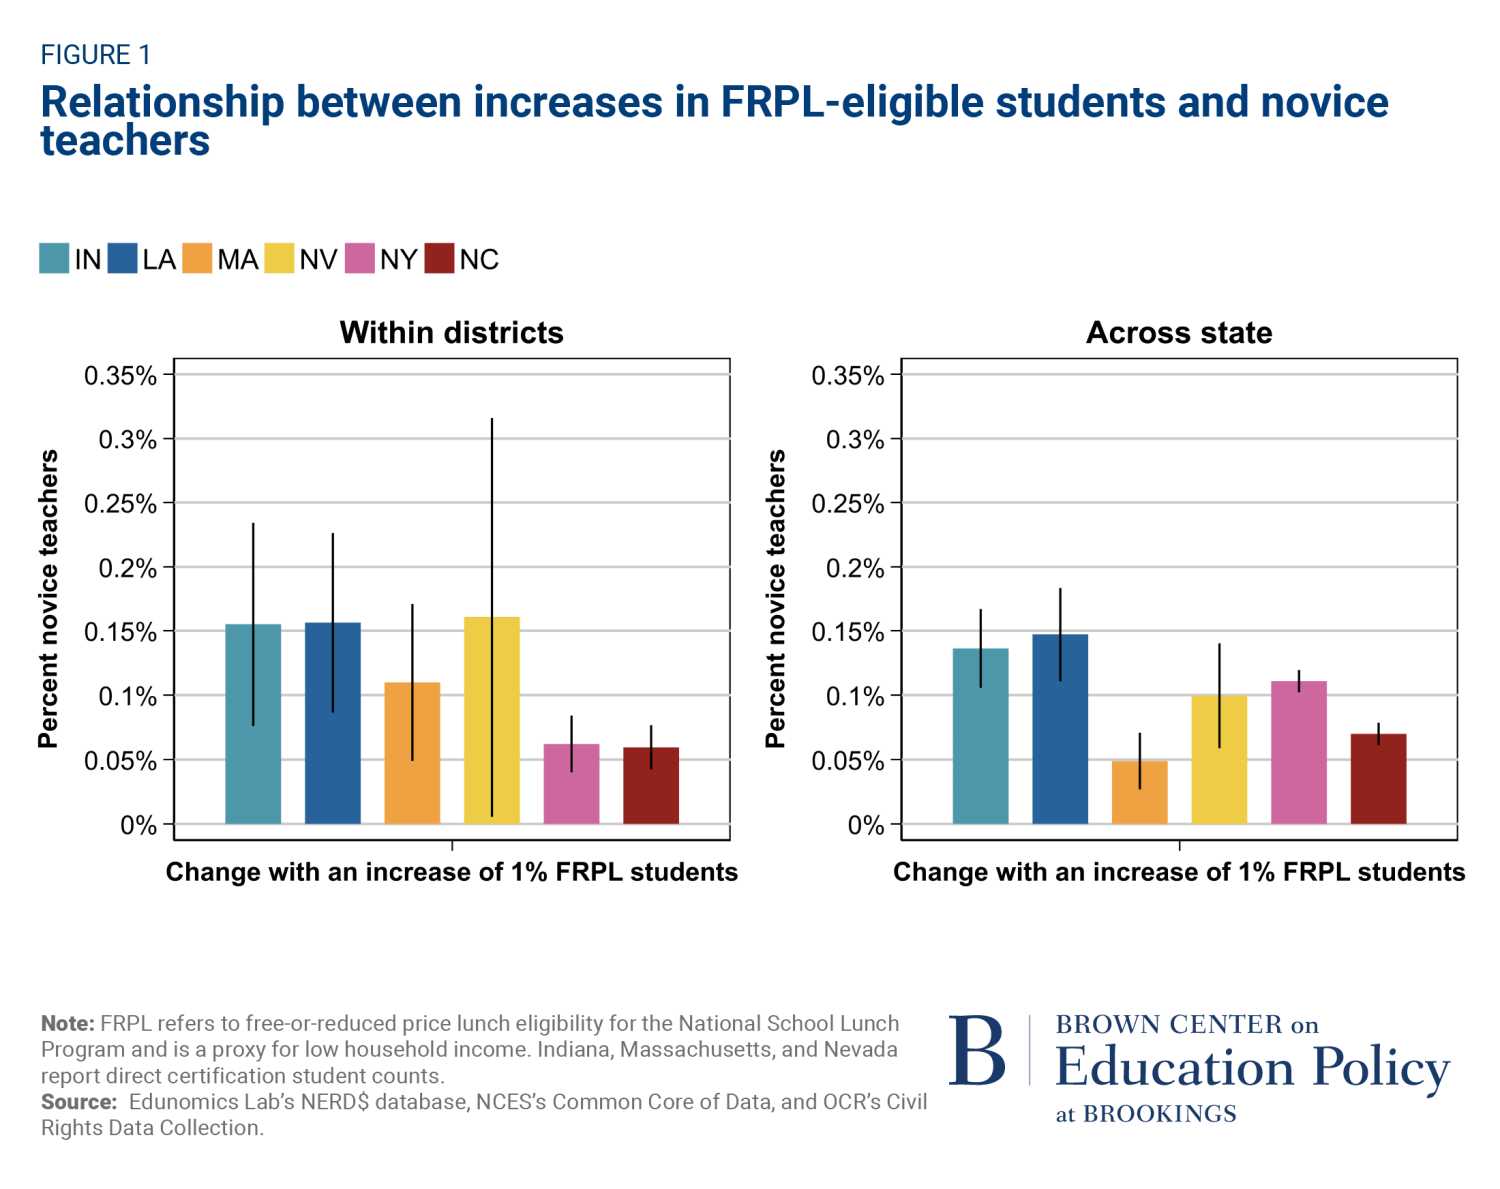
Figure 1 clearly shows schools serving higher shares of FRPL-eligible students are significantly and positively correlated with higher shares of novice teachers on staff across all our study states. The magnitudes of these estimates correspond to a one percentage point increase in the share of FRPL students in schools; in other words, the 0.1 point estimate observed within districts in Massachusetts means that schools with a 10 percentage point higher share of FRPL-eligible students also have a 1.0 percentage point higher share of novice teachers.
“Figure 1 clearly shows schools serving higher shares of FRPL-eligible students are significantly and positively correlated with higher shares of novice teachers on staff across all our study states.”
This unequal access to experienced teachers is well documented in prior studies in the literature spanning nearly two decades and multiple states (and countries). Our estimates are well aligned with these prior estimates. We must be careful to note that teacher qualifications, like prior experience, are generally seen as somewhat weak predictors of teacher quality (based on teachers’ ability to produce student learning gains). Multiple studies have found evidence of relatively small gaps in economically disadvantaged students’ access to teacher quality even when large gaps on qualifications are evident. Yet, the best we can tell is that disadvantaged students have systematically lower access to teachers who are qualified (using common qualifications like experience and certification) and effective (using value-added productivity measures), and this phenomenon is primarily driven by teacher sorting behaviors.
Returning to Figure 1, when comparing the differences between the within-district (on the left side) and statewide estimates (on the right), the statewide estimates are of similar magnitude in most states (or not significantly different). Yet, the statewide estimates are significantly larger in New York. This suggests teachers in New York are both distributed unequally across schools in the same districts and are even more unevenly distributed when looking across district boundaries. This happens when FRPL-eligible students are also unevenly distributed across districts so that looking within districts only captures a piece of an overall pattern of statewide inequality. This, too, is consistent with prior studies examining the distribution of teacher quality, which find both within-district and across-district sorting can play a role in preventing disadvantaged students from accessing teacher talent.
Finding 2: Across all states, inequalities on per-pupil teacher spending within districts are slightly progressive.
This analysis focuses exclusively on spending differences between FRPL- and non-FRPL-eligible students within districts. This is an important level of focus because, while states allocate money to districts based on funding formulas, many spending decisions in public schools are determined locally, including decisions related to staffing, like whom to hire, where to place them, and how much to pay them.
The prior literature examining the relationship between teacher and financial resources is often focused on unequal spending patterns that could arise as a natural consequence of adverse teacher sorting across schools within the same local districts. Since local districts often pay teachers the same salary regardless of where they teach, higher-salaried teachers’ preferences to teach away from disadvantaged settings will mechanically allocate salary funds towards more affluent areas. Teachers certainly can also sort across district boundaries as discussed above, though salary schedules typically also change across boundaries, in which case the relationship between teacher sorting and spending patterns becomes less direct (and potentially offset by state-level reallocations across districts). Yet, at this basic level, we find a progressive pattern of within-district spending across all study states, as documented in Table 1 below.
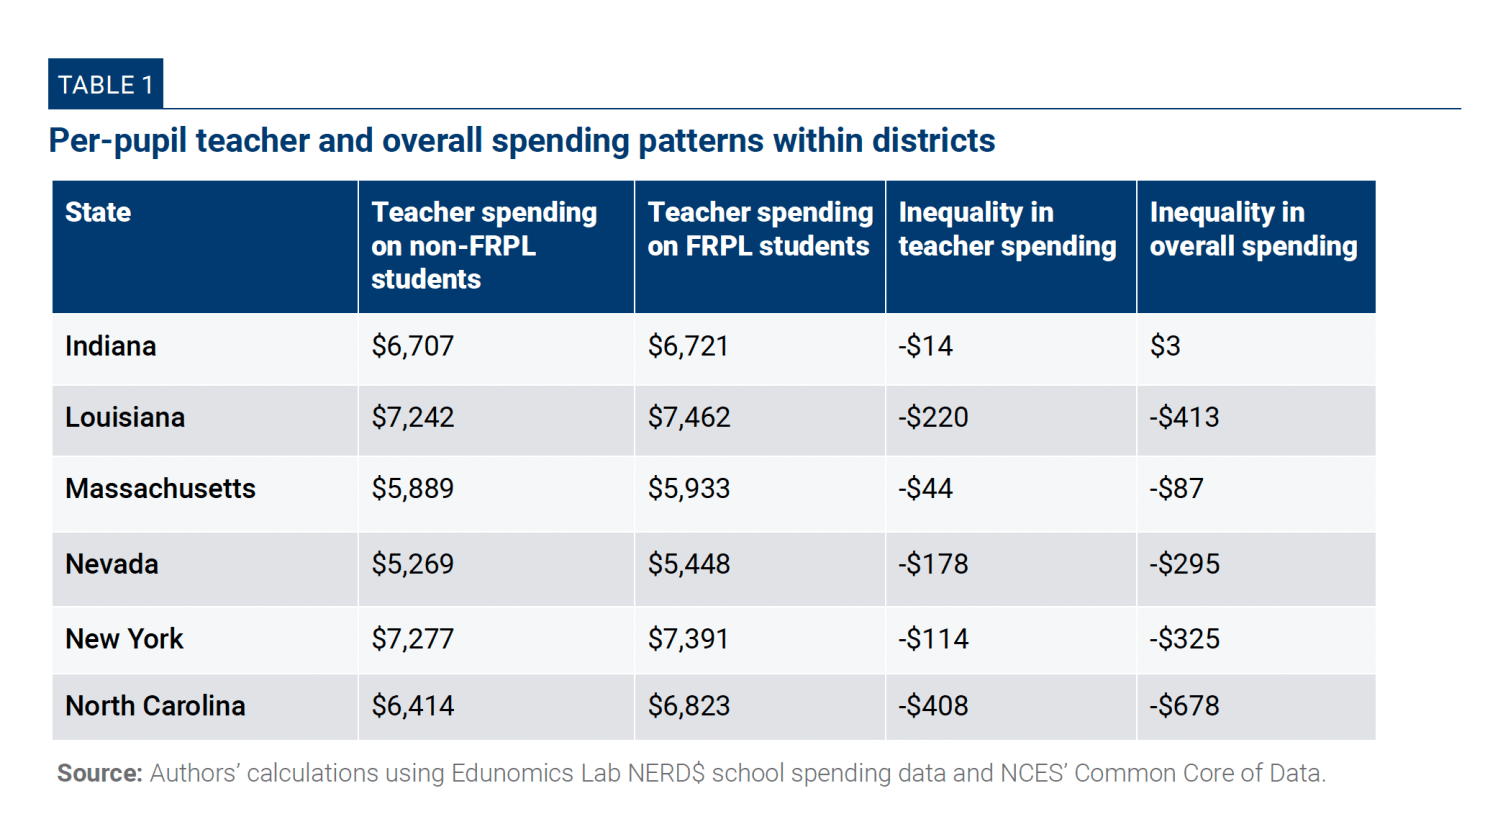
Table 1 reports per-pupil teacher spending on non-FRPL and FRPL student groups within districts and then calculates the average difference across districts in each state. The negative values in the third column show that teacher spending is progressive (i.e., favoring FRPL students) in each state, on average. The magnitude of progressive teacher spending is generally slight, where the marginal dollar values spent on FRPL students amount to spending differences ranging from <1% to 3% of that on non-FRPL students in most of these states. The notable exception is North Carolina, where teacher spending is more than 6% higher on FRPL students. Note that these spending estimates in Table 1 include funding from federal sources, which push school finances in a decidedly progressive direction. Since Title I amounts to more than $1,000 of funding per eligible student, the spending differences calculated here suggest that state and local funding allocations only are regressive, and it is likely the federal funds tip the balances into a progressive allocation on net.
These results do not imply every district in these states has progressive teacher spending, but rather that the average district in each state sample is slightly progressive. Each state has some districts that have regressive—rather than progressive—teacher spending patterns, though they are in the minority in all states. These range from a high of 46% of students in our Indiana sample who are enrolled in districts with regressive teacher spending down to only 10% of students in our North Carolina sample with regressive spending.
The final column of Table 1 presents the inequality in overall school spending within districts to compare against the teacher spending differences at this same level of analysis. In all states except Indiana, overall education spending is slightly more negative than that reported for teacher spending, indicating that spending in other areas is also pointing in progressive directions favoring disadvantaged students. Other spending in Indiana, by contrast, appears to be very slightly regressive and results in net overall spending within districts that favors non-FRPL students by just $3 on average.
Finding 3: Across all states, increased staffing ratios for economically disadvantaged students compensate for less-experienced teachers.
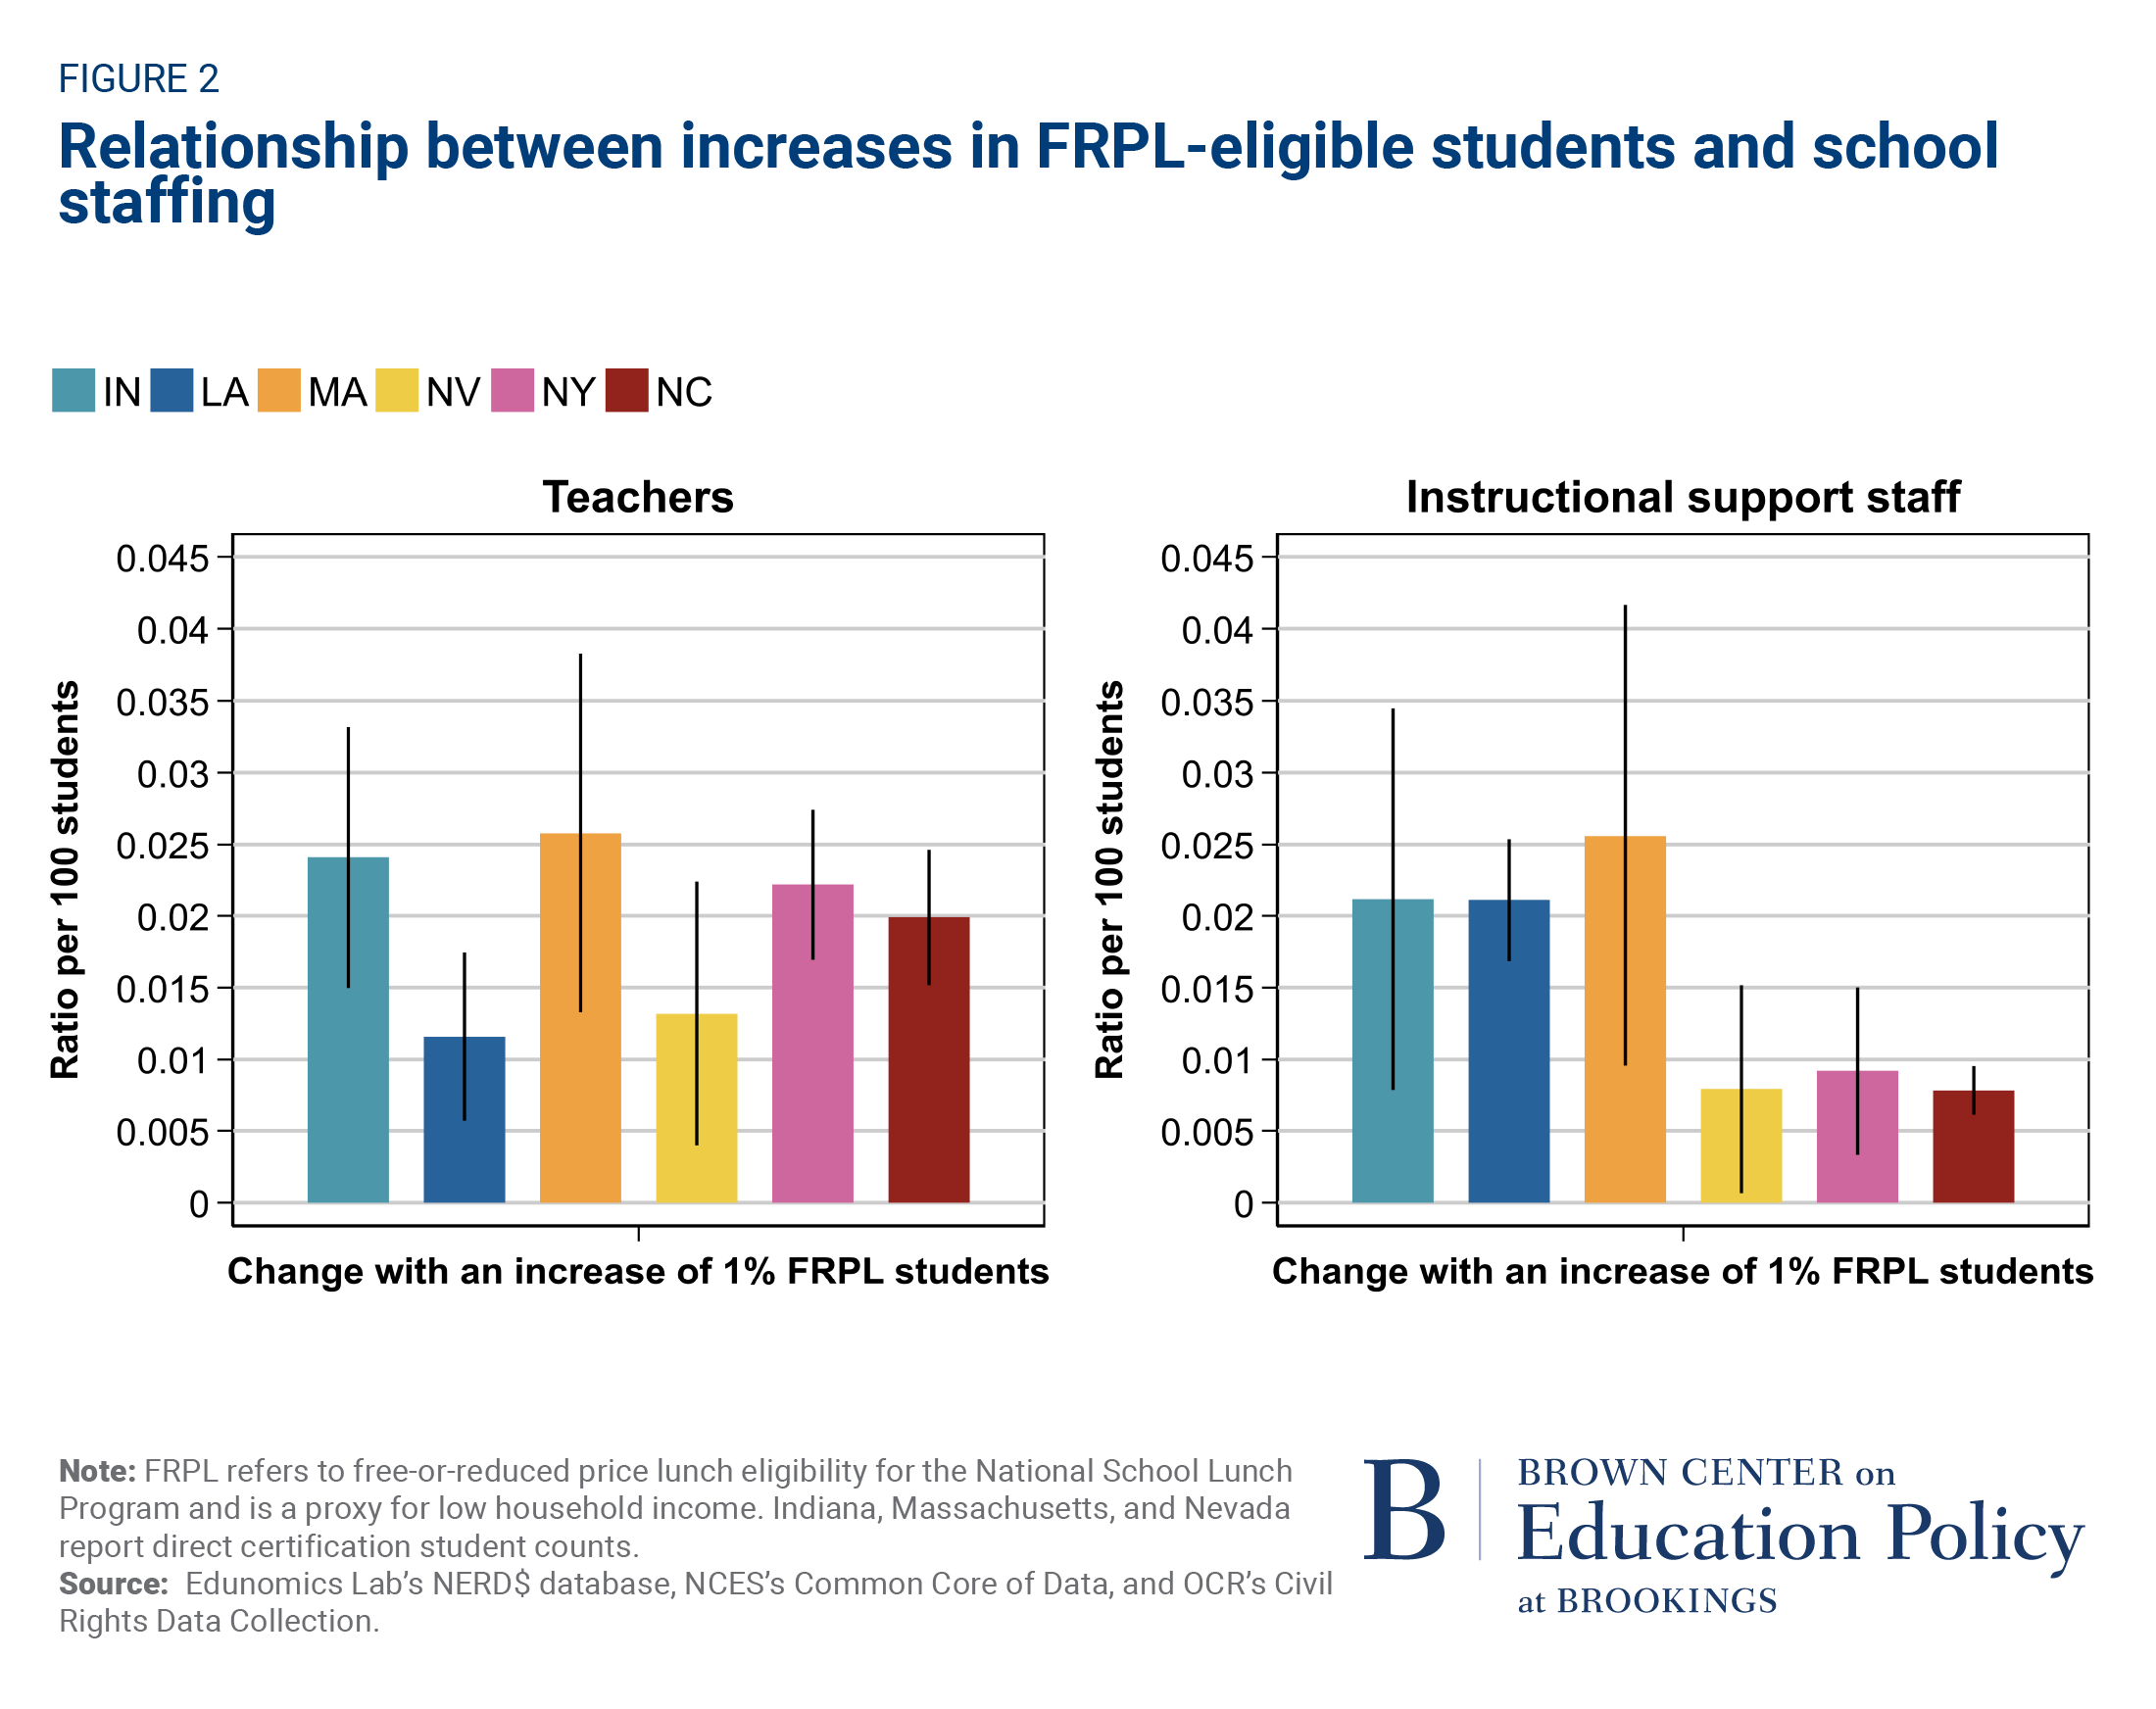
Findings 1 and 2 together create a bit of a contradiction: If teachers are allocated so unevenly across schools, why is teacher spending slightly progressive? The answer lies in what districts are doing with the extra teacher funds, and districts in all states report higher staffing levels in schools serving disadvantaged students (see Figure 2).
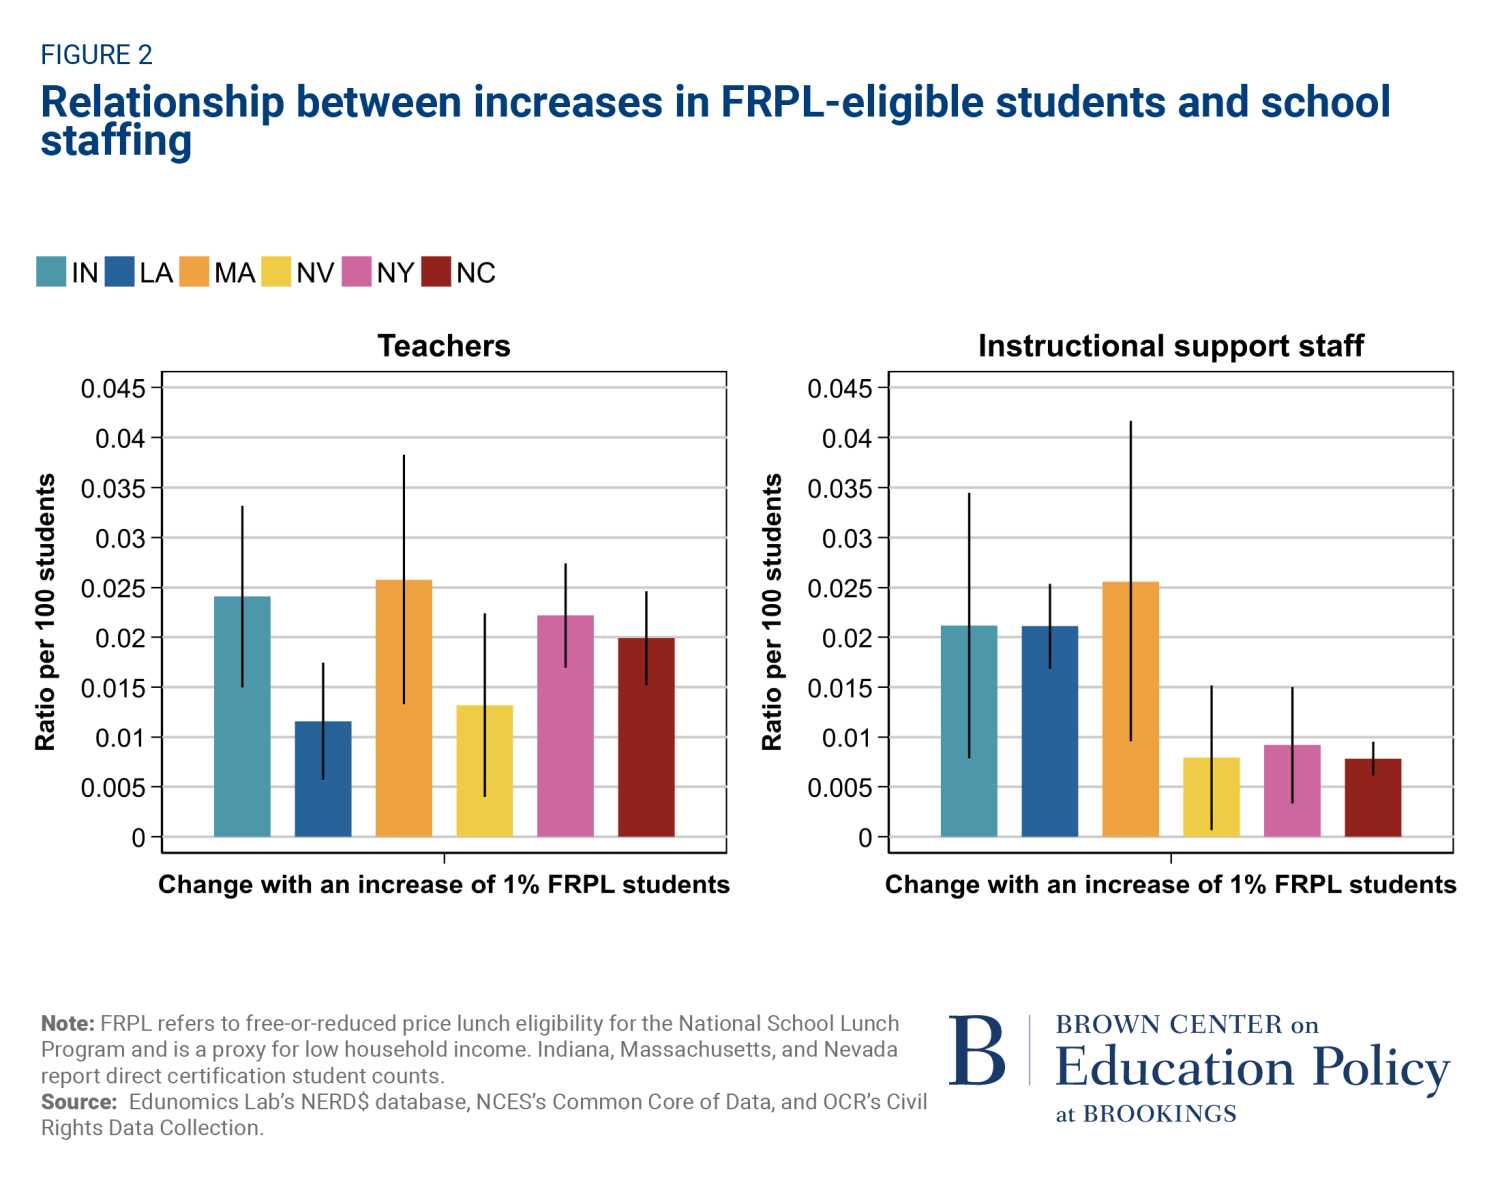
Figure 2 reports coefficient plots for regressions of teacher staffing ratios (on the left) and other support staff ratios (on the right) per 100 students. Regressions focus on staffing differences within districts.
“If teachers are allocated so unevenly across schools, why is teacher spending slightly progressive? The answer lies in what districts are doing with the extra teacher funds, and districts in all states report higher staffing levels in schools serving disadvantaged students.”
Schools serving more FRPL students have systematically more staff in classrooms. All study states show positive and statistically significant relationships with staffing ratios for both teachers and other instructional support staff. In some states (like North Carolina), teacher staffing ratios show a stronger relationship than instructional support staff, while in others (like New York), the opposite is true. For interpretation, Massachusetts’s estimate of 0.025 on FTE teacher staffing ratios corresponds to 0.5 more teachers per 100 students when the average school’s FRPL student population increases by 20 percentage points. This equates to an increase of 6% of the average Massachussets teacher-student ratio (average is 8.15 FTE teachers per 100 students).
“In other words, districts leaders seemingly compensate disadvantaged students with staffing quantity when they cannot ensure access to teacher quality.”
Contrast this universally beneficial staffing in high-poverty settings against the universally adverse sorting of experienced teachers away from these settings. It is this counterbalancing of staffing resources that makes it plausible to have both lower access to qualified teachers for disadvantaged students and still slightly progressive teacher spending at the district level. In other words, districts leaders seemingly compensate disadvantaged students with staffing quantity when they cannot ensure access to teacher quality. Though this may not be the preferred allocation of teacher quality, it is a sensible, equity-promoting response from leaders given the constraints they face. Namely, leaders cannot easily manipulate the distribution of teacher quality (unless they are willing to tweak single salary schedules), but they can more readily manipulate the quantity of teachers and support staff across schools.
These increased staffing ratios imply, but do not necessitate, smaller class sizes for high-poverty students. High-poverty schools may deploy additional teachers in other ways without lowering class sizes; for example, they can provide a wider range of courses to students, provide more planning time for teachers, or use alternate staffing models in the classroom (e.g., team teaching). We discuss potential implications for both lowering class size and alternative staffing models in our conclusion below.
Finding 4: Statewide inequalities in per-pupil teacher spending suggest greater variance occurring across districts.
When broadening the lens of our analysis to consider teacher spending patterns across the entire state, regardless of district boundaries, greater differences emerge between these states. Table 2 presents our statewide spending inequality calculations, which parallels the format presented in Table 1.
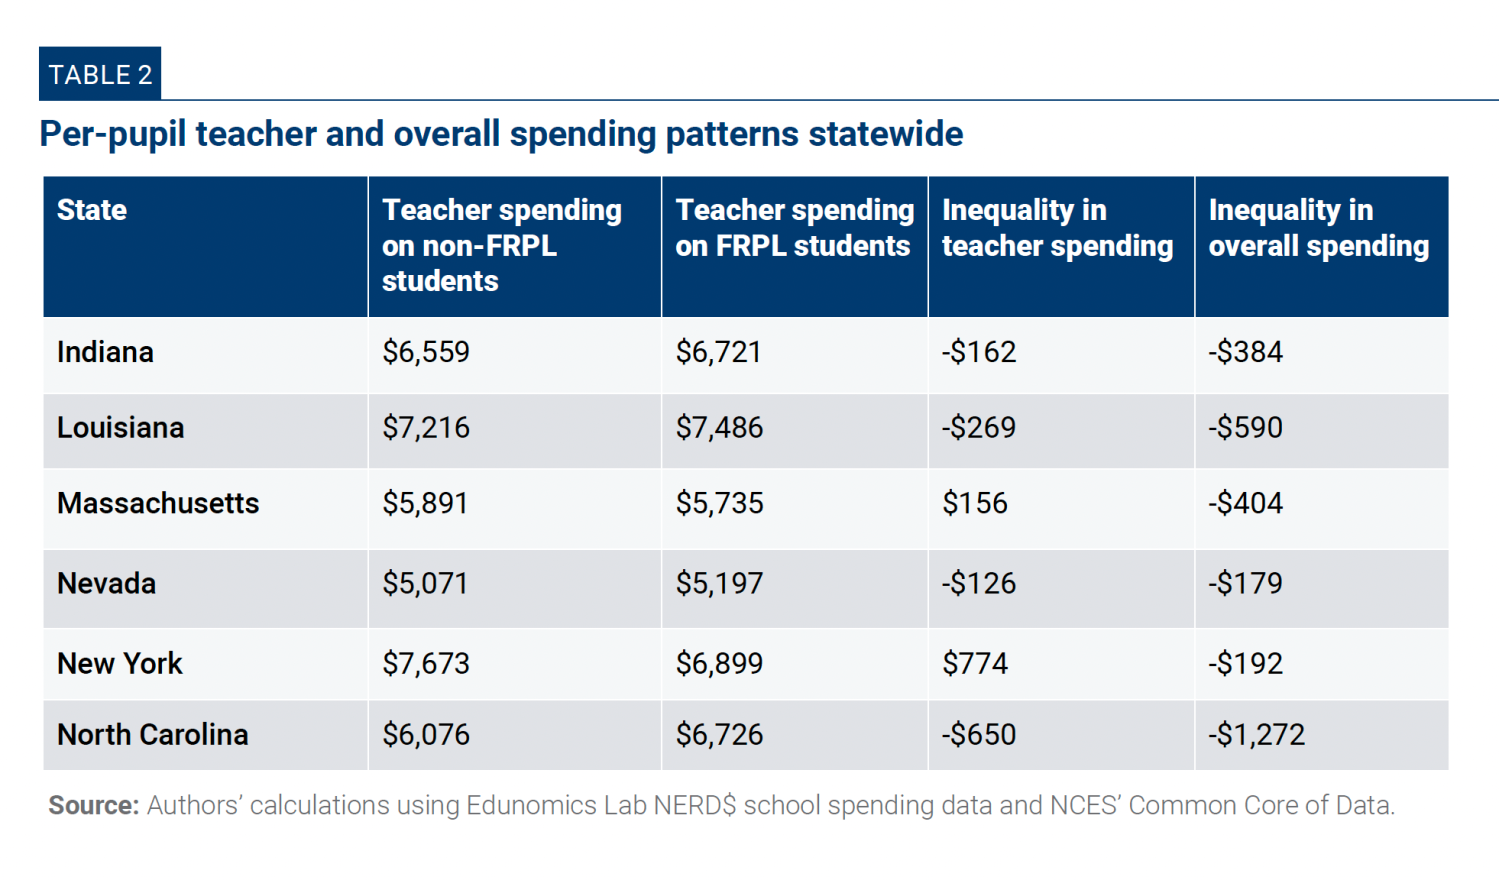
Table 2 shows the inequalities in per-pupil teacher spending between FRPL and non-FRPL students grow in different ways when expanding our focus. Where all states in Table 1 above showed progressive allocations within districts, on average, two states now show regressive allocations: Massachusetts spends $156 more on non-FRPL students statewide (FRPL students receive 3% less), and New York spends $774 more on non-FRPL students (FRPL students receive 10% less). At the opposite end, North Carolina now spends $650 less on non-FRPL students (FRPL students receive nearly 11% more).
But this reversal in spending patterns (for Massachusetts and New York) points to differences in teacher spending determined at the district level as being more significant factors of extant student inequalities. As mentioned above, different districts can have very different distributions of novice teachers, plus teacher salary schedules typically change across different districts, allowing some districts to pay more and others less for otherwise similarly qualified teachers.
Note that our inequality calculations included a wage index, intended to account for median wage differences in college-educated workers who are not working in education. Thus, New York’s statewide strongly regressive spending result is not simply a story of disadvantaged students disproportionately being located in low-spending districts; rather, it suggests they are disproportionately located in districts where teacher spending is comparably lower than we otherwise expect based on other educated workers in the area. Hence, New York City Schools, the largest district in the country and serving 52% of New York’s FRPL students, appears as a relatively low-spending district in our data (compared to other districts in the state) even though its teacher salaries are among the highest in the state in raw dollar values. It has an outsized effect on these statewide results even though the within-district calculations show progressive spending.
Finally, when looking at the last column of Table 2, the statewide calculations show that overall education spending is net progressive across all states. Spending in other, non-teaching spending categories are apparently progressive in all states, including in Massachusetts and New York, where they are of a large enough magnitude to offset the regressive teacher spending differences observed statewide.
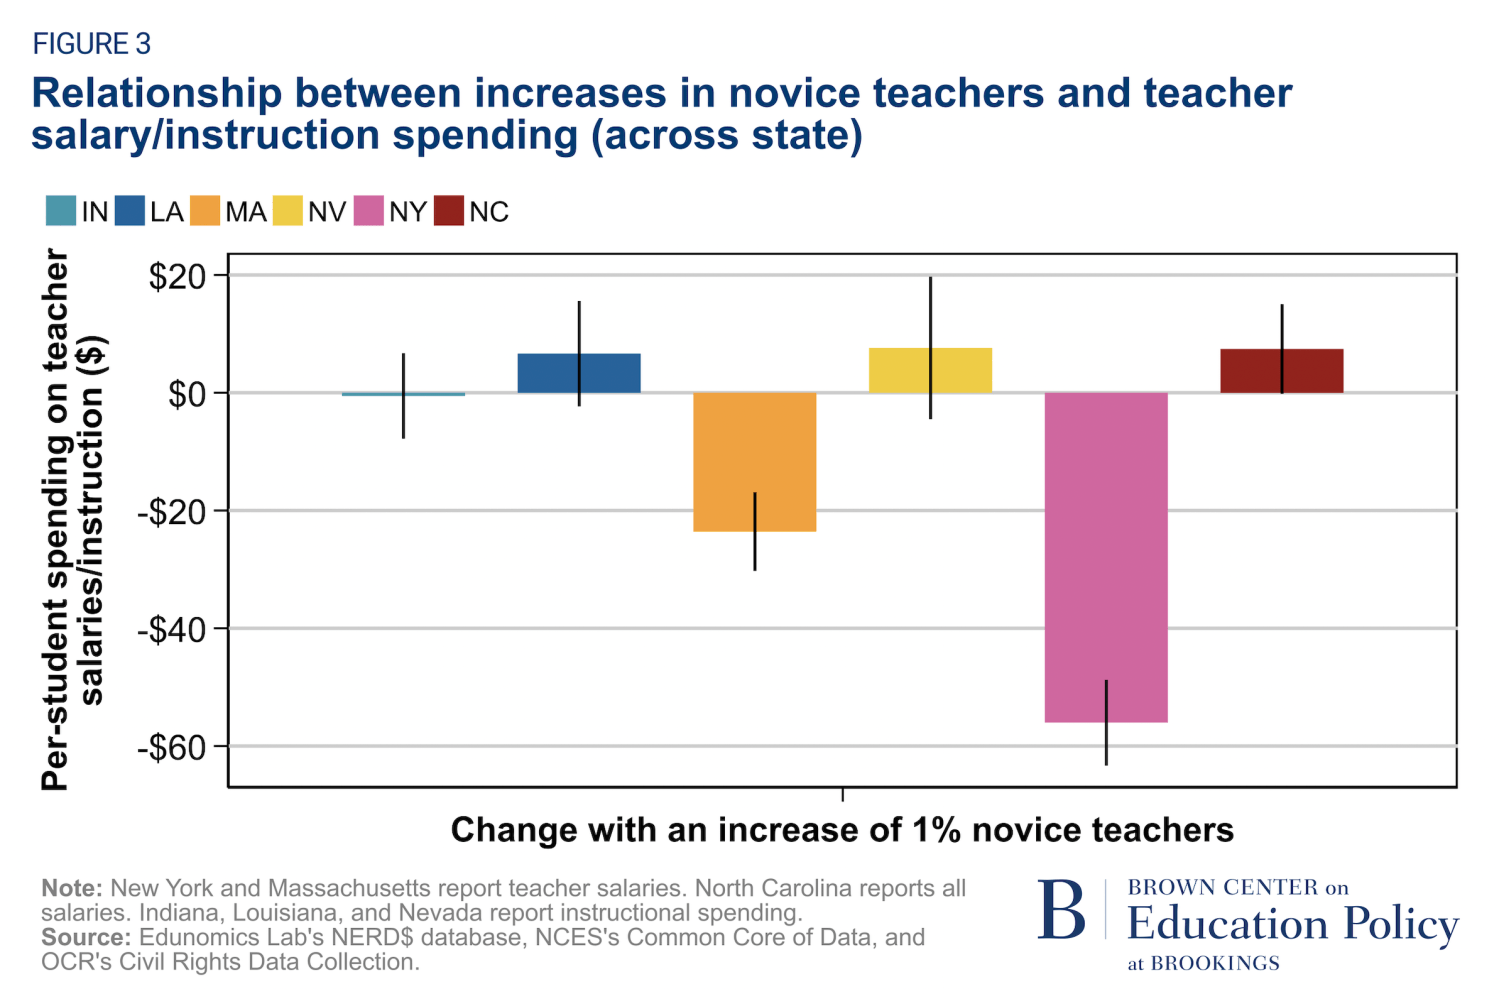
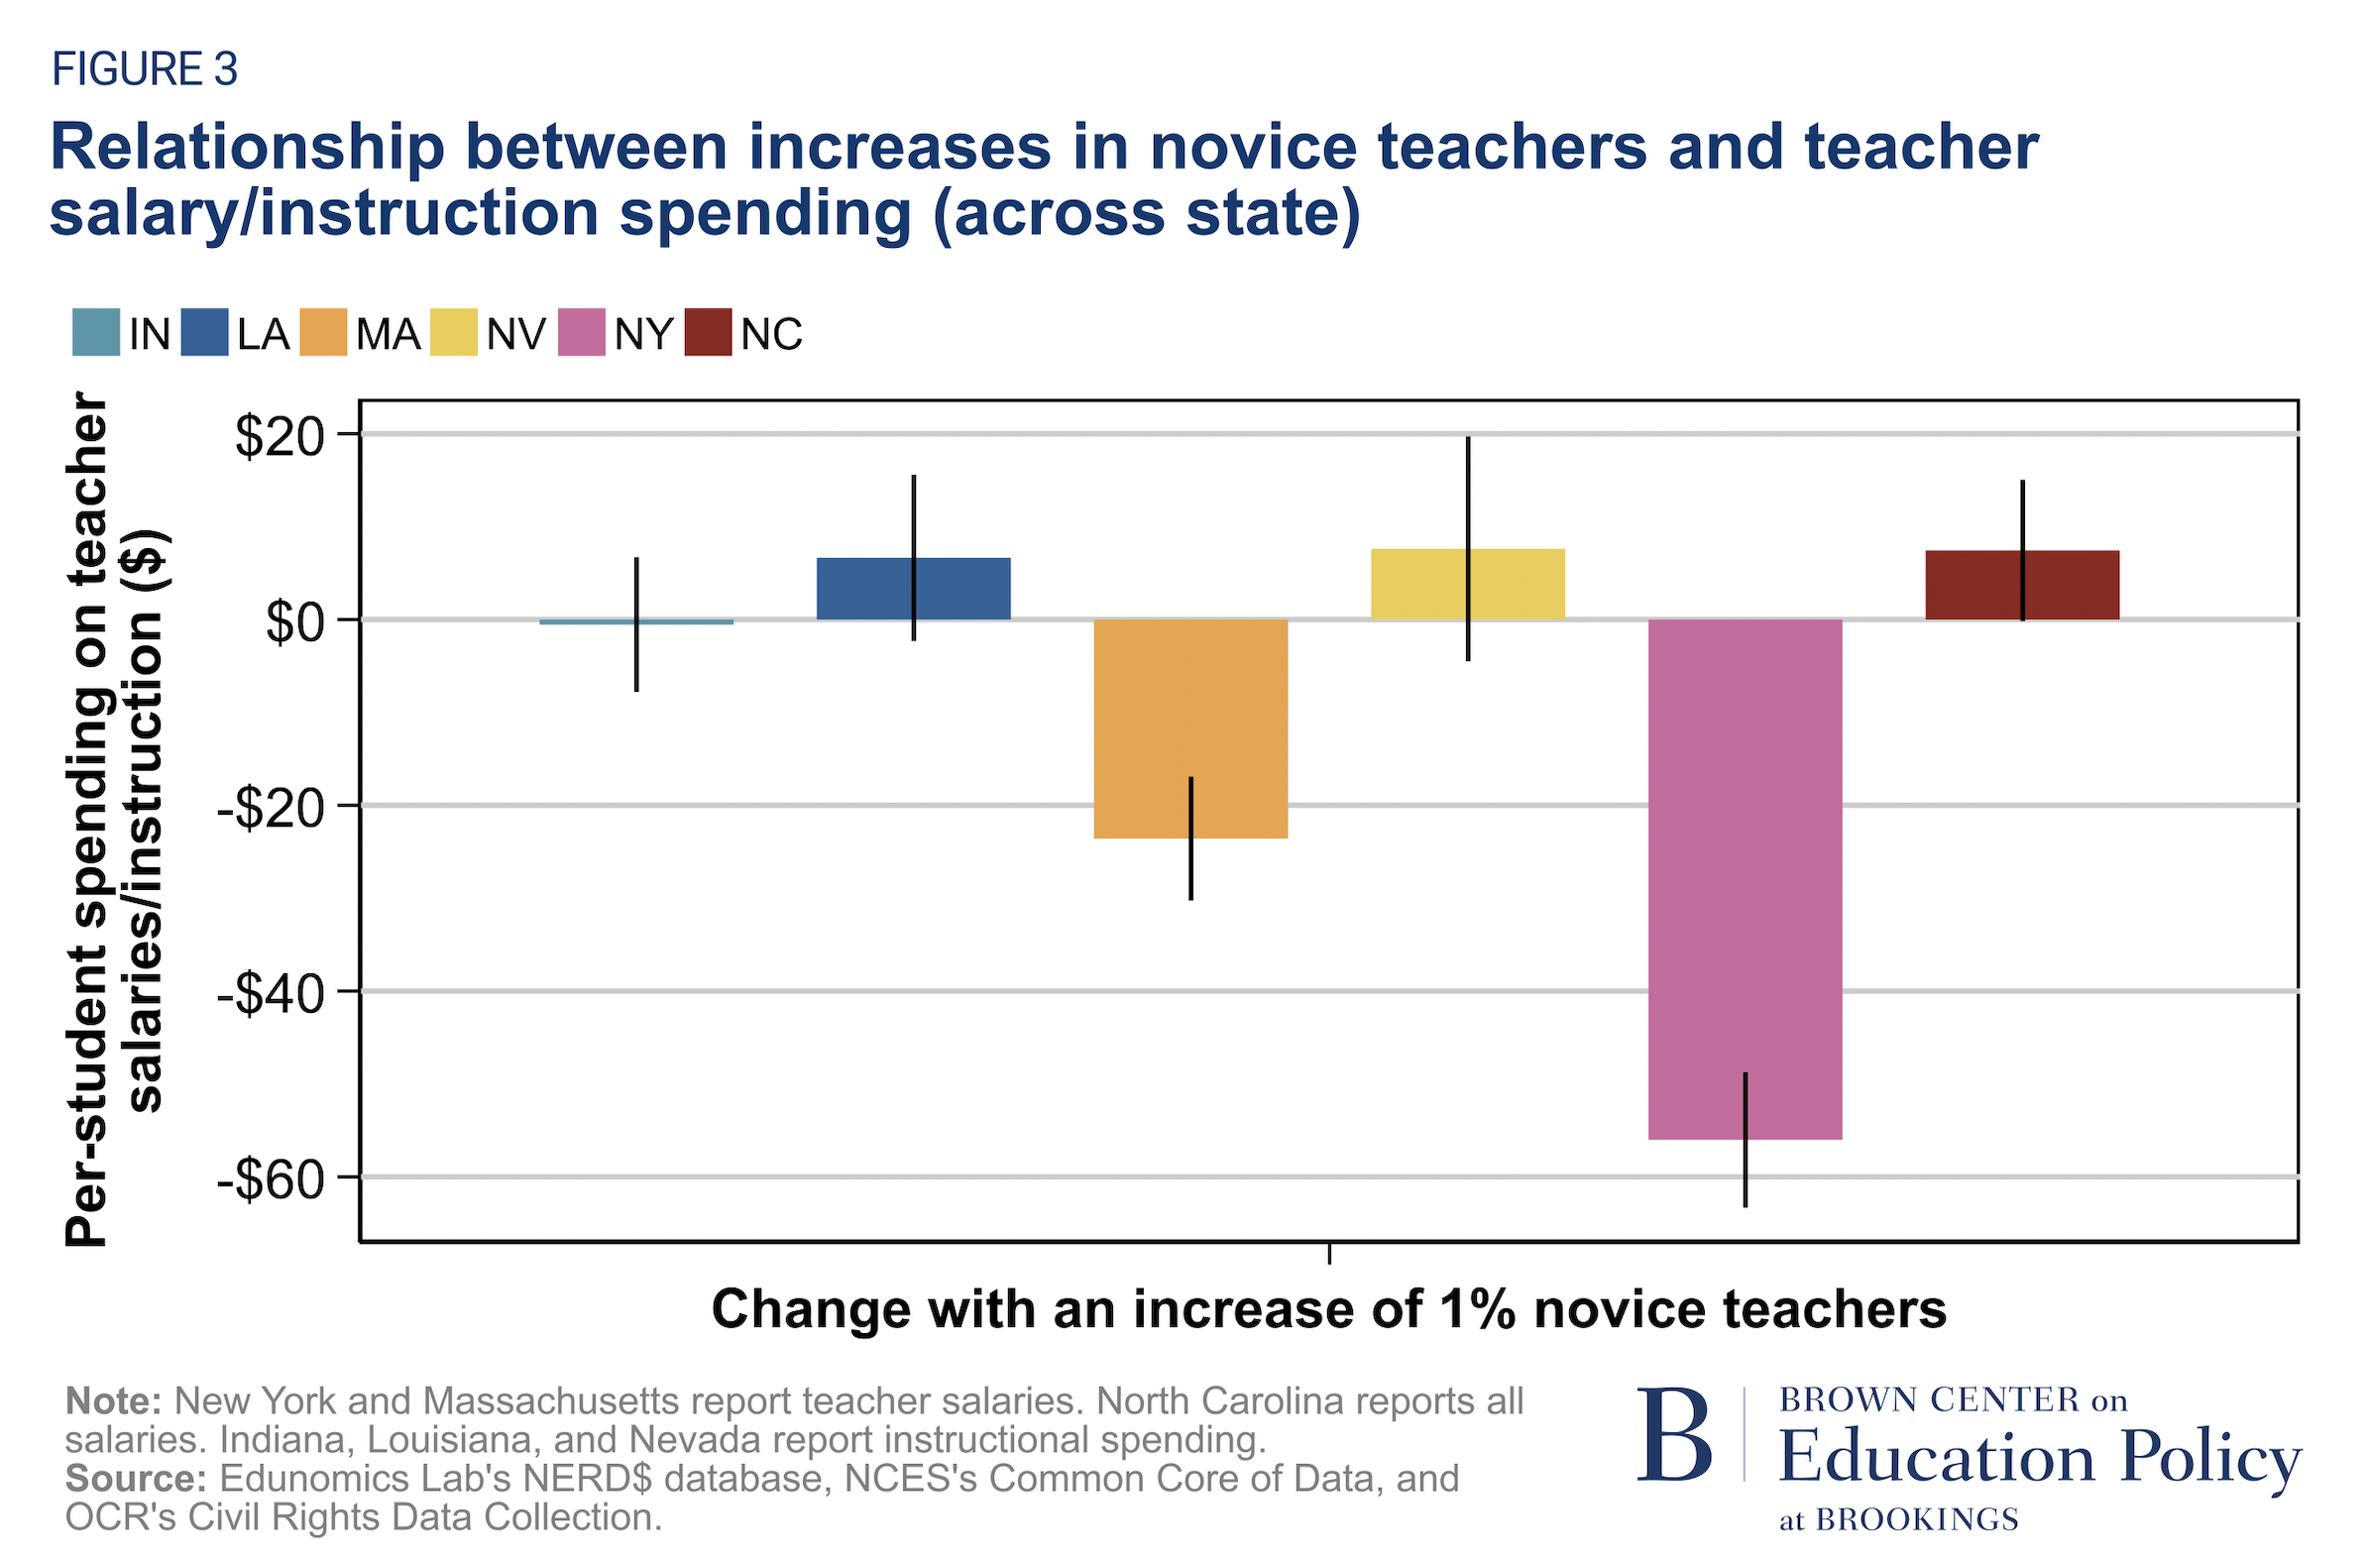
Finding 5: Calculated differences in per-pupil teacher spending across states are partially due to measurement.
Massachusetts and New York alone showed regressive spending patterns statewide (Table 2) and progressive patterns within districts (Table 1), though they are also the two states that focus most narrowly on salaries of classroom teachers (Massachusetts reports teacher salaries, and New York reports classroom salaries). Other states capture all school personnel salaries (North Carolina) or instructional spending (Indiana, Louisiana, Nevada), which include teacher salaries along with other costs less directly focused on the issues that motivate our study.
We believe it’s plausible, perhaps even likely, that if we could observe teacher salaries directly in all states, they would more closely resemble the results from Massachusetts and New York. We have three reasons to believe this may be the case. First, Knight’s prior analysis of the interplay between teacher staffing and spending used a school-level measure of spending on teacher salaries available from the Civil Rights Data Collection, and this measure is at least superficially intended to capture a consistent definition of salaries across states (some scholars have criticized the CRDC for inconsistencies in reporting school-level financial data). Knight found teacher salary spending patterns that were, on average, modestly progressive within districts but regressive when looking across districts within states, consistent with the patterns in Massachusetts and New York observed in this report. Similarly, Adamson and Darling-Hammond also find similar, strongly regressive patterns in California and New York with data from a decade earlier than this analysis.
Second, we noticed a curious relationship between the different teacher spending variables and the share of novice teachers: These variables were significantly and negatively correlated most strongly in Massachusetts and New York but had associations much closer to zero in all other states (see Figure 3 below). The share of novice teachers (defined as the share of teachers in their first or second year of teaching) is a revealing measure because it is our most direct signal of low qualifications, and therefore, expectations of lower salary spending. Thus, we should expect a direct and negative relationship between the two, in the absence of compensatory hiring. With the known inclusion of spending beyond teacher salaries in our spending measures from other study states, which are presumably less directly related to novice teacher share, we would expect an attenuated estimate (i.e., a relationship closer to 0).
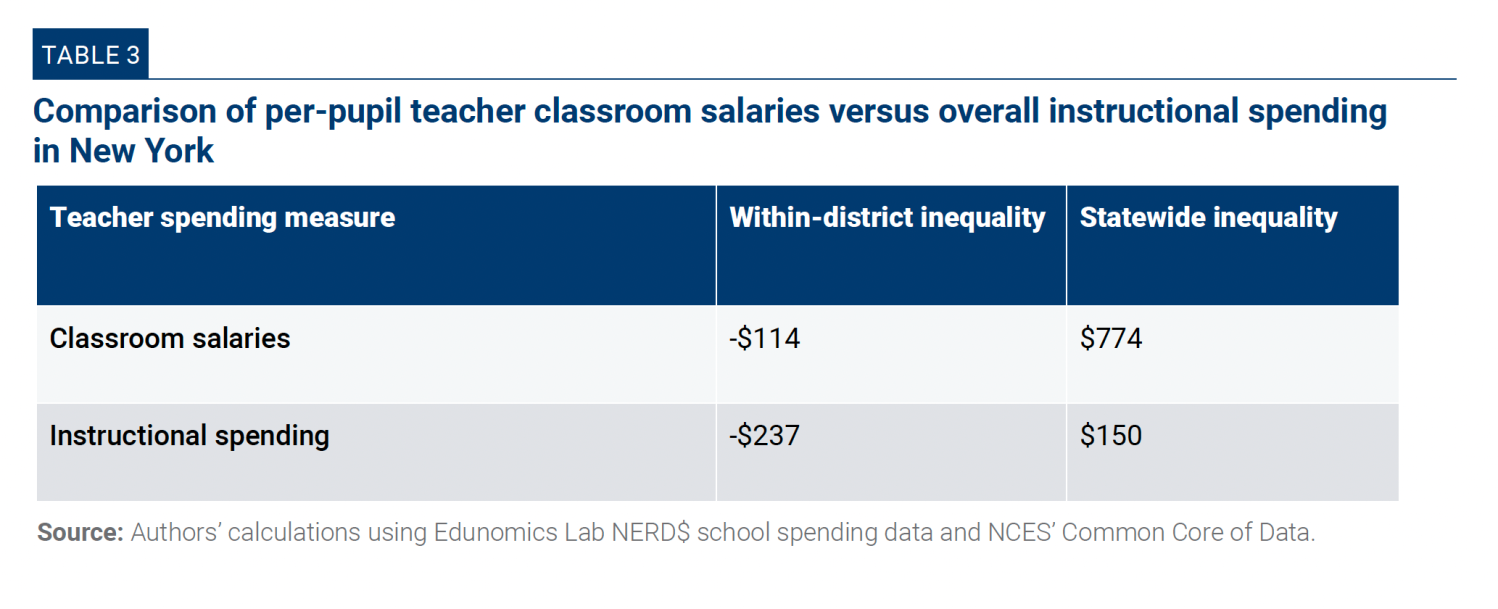
Third, we can directly evaluate how the results change with the use of instructional spending versus teacher salaries in New York, as this is the only state that reports both measures. Replicating the analysis in New York with its school-level instructional spending measures instead of teacher salaries shows both within-district and statewide inequality measures that decline in magnitude (i.e., reflect greater progressivity—see Table 3).
To be clear, we cannot directly observe teacher salary spending in most of the study states and we cannot determine what true inequalities on these measures look like. Based on prior literature and the empirical patterns we can document with the study data, we suppose real salary spending patterns would more closely resemble the regressive patterns observed in Massachusetts and New York.
Discussion and conclusion
This report explores whether and how unequal staffing patterns correspond to inequalities in per-pupil teacher spending. Our findings on staffing patterns here largely corroborate findings documented elsewhere in the literature: namely, that economically disadvantaged students have systematically lower access to experienced teachers in comparison to those who are not. We then present evidence that shows teacher spending across six study states is slightly progressive within districts. These progressive patterns counter hypothetical predictions based on the unequal distribution of teacher qualifications alone: all else equal, those students with greater access to qualified teachers should incur more spending on their behalf to support those higher-salaried teachers. Yet, our analysis also reveals that disadvantaged students are in schools with systematically higher staffing ratios for teachers and other teaching support staff, implying a compensation in higher quantity when local schools provide lower levels of quality.
“Our findings on staffing patterns here largely corroborate findings documented elsewhere in the literature: namely, that economically disadvantaged students have systematically lower access to experienced teachers in comparison to those who are not.”
In summary, our results offer encouraging findings, where some form of equality is obtained even when teacher sorting patterns clearly offer a one-sided disadvantage to FRPL-eligible students. Even with this good news, however, we are still cautious about disadvantaged students’ access to teacher quality. As we conclude, we highlight several areas that warrant further discussion and research.
- Is this quality-for-quantity exchange a fair deal for disadvantaged students? We are encouraged to see compensatory spending that presumably benefits students in other ways outside of teacher qualifications, though we are not persuaded this is adequate compensation. Additional teachers enable smaller class sizes, though prior research casts doubt on the wisdom of this exchange. Findings from California’s class-size-reduction policies show that increased teacher hiring overall (increased quantity) dampened the availability of teacher quality, particularly in high-need settings, thereby undermining the policy’s intended effect. Relatedly, Hansen explored the possibility of intentionally increasing class sizes for demonstrably effective teachers while simultaneously lowering that of less-effective teachers, a pattern directly analogous to what we see here in our data. His simulation-based findings suggest that even relatively large declines in class size (up to five fewer students) for those with less-effective teachers do not equalize the learning experience between FRPL and non-FRPL students. In other words, disadvantaged students may still be getting a raw deal even with extra teachers. If lower class sizes are intended to fully offset the lower access to experienced teachers, we would need far more teachers hired in high-poverty settings than what we now observe.
- Can we realistically sustain higher staffing levels as compensation for disadvantaged students in the face of ongoing teacher shortages? Scholars have been warning of long-term teacher shortages for years, even if the exact nature of those shortages is debated. The COVID-19 pandemic and the consequent burnout of teachers in recent years has elevated these concerns even more. These broader labor market trends portend a real risk that schools serving disadvantaged students may be unable to reliably provide higher levels of staffing for schools, given that they are the ones most likely to report hard-to-fill vacancies. We fear that the delicate balance we observe between teacher sorting and additional staffing only works when labor market conditions are favorable, though we should not be satisfied with the current arrangement as a long-term solution for FRPL-eligible students’ uneven access to qualified teachers. Rather, long-term strategies to buoy the teacher pipeline are still integral pieces to providing equal access to quality teaching for all students. Even more, complementary policies(e.g., salary supplements for effective teachers in high-need schools) to ensure equal access to theeffective teachers already in schools should be part of the policy response.
“We fear that the delicate balance we observe between teacher sorting and additional staffing only works when labor market conditions are favorable…”
- We should be utilizing teachers’ aides and other instructional support staff more heavily as a policy lever. Our findings show that offsetting staffing can come in the form of teachers’ aides and other support staff in high-need settings, and these additional staff could benefit students if we staff schools strategically. We have strong evidence that investments in instructional coaching can yield benefits to teachers and their students. We just need to take these practices to scale. The conventional wisdom on teacher aides, conversely, is that they generally provide little boost in student learning (even if they are popular among teachers for reducing their teaching burden). Recent studies, including a randomized control trial, however, challenge that narrative and find strong gains associated with the staffing of teachers’ aides, especially in high-need settings. Scholars have also highlighted teachers’ aides in recent years as an important, untapped source of new teacher talent that could help promote teacher diversity, too. Though more research is needed to better understand how best to deploy them, both instructional coaches and teachers’ aides could be cost-effective ways to support classroom instruction and we should be leaning into them in high-need settings.
- These school-level finance data are a valuable contribution to education finance, though we still need more information to fully understand extant inequalities. Unequal per-student spending on teachers likely persists within schools at the expense of struggling or disadvantaged students, since teachers also appear to be unequally distributed within schools, too. For example, economically advantaged students are more likely than their peers to enroll in honors or AP-level courses, and, conversely, economically disadvantaged students are more likely to take remedial courses. Per-pupil teacher spending for these more demanding classes may be significantly higher, partially due to more experienced teachers being more likely to teach them and stemming from lower average class sizes. Within-school sorting likely also has implications for the distribution of teacher quality, where disadvantaged students may be more likely to be in the classroom of a less-effective teacher. Mapping the connections between teacher spending, teacher resources (both qualifications and estimated productivity), and student-level differences in access to teachers would be an especially illuminating next step. Accessing within-school spending data is difficult but may be crucial for identifying the “true” student-level inequalities associated with teacher and instructional spending. More contemporary analysis must be conducted to evaluate both the magnitude and the extent to which these inequalities persist.
Read the case studies (Massachusetts, Indiana, Louisiana, Nevada, New York, and North Carolina) →
Authors


The Brookings Institution is committed to quality, independence, and impact.
We are supported by a diverse array of funders. In line with our values and policies, each Brookings publication represents the sole views of its author(s).


