
- Homepage
- Introduction
- Chapter 1: Which districts allocate resources progressively?
- Chapter 2: Does teacher sorting contribute to financial inequalities?
- Case studies: Massachusetts, Indiana, Louisiana, Nevada, New York, and North Carolina
- Methodological appendix
Problem
Prior research shows FRPL students have lower access to experienced and other qualified teachers, compared to non-FRPL students. These patterns hold in Massachusetts, too. Since teachers are often paid on salary schedules that do not vary based on their school, these sorting patterns will lead to more dollars allocated to affluent settings, all else equal. Do teachers contribute to funding gaps in Massachusetts?
Findings
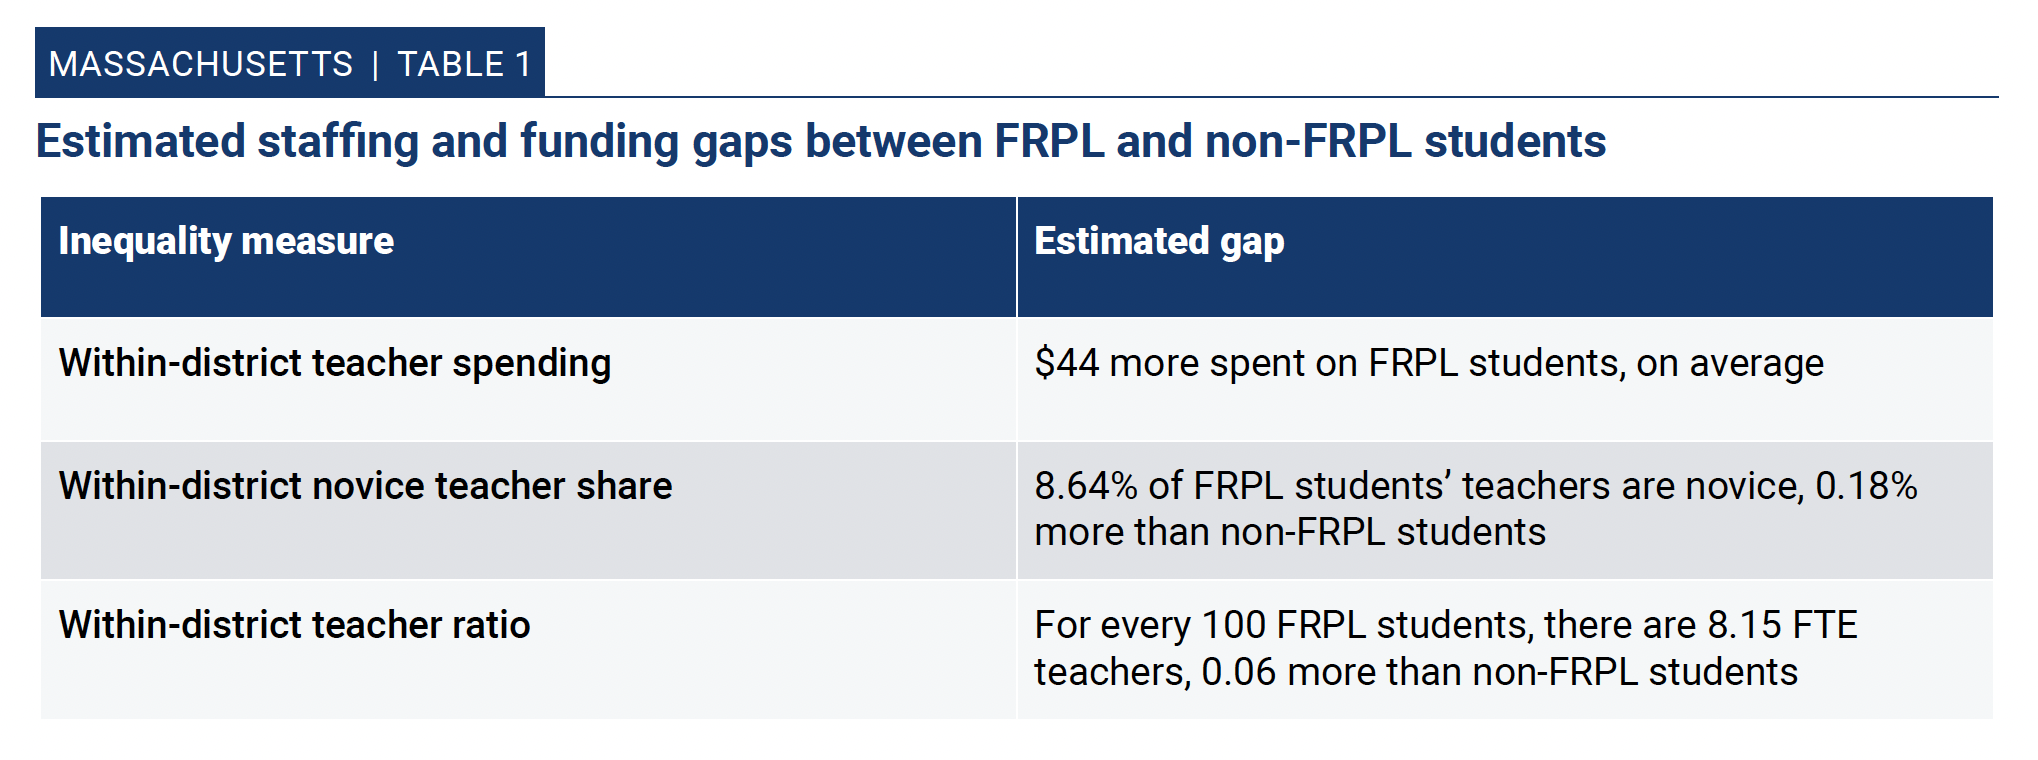
Within districts, FRPL students have lower access to experienced teachers while simultaneously receiving slightly higher allocations of teacher spending. The result is explained by compensatory staffing, where FRPL students are in schools with increased staffing ratios for teachers (see Table 1) and other instructional support staff (not shown).
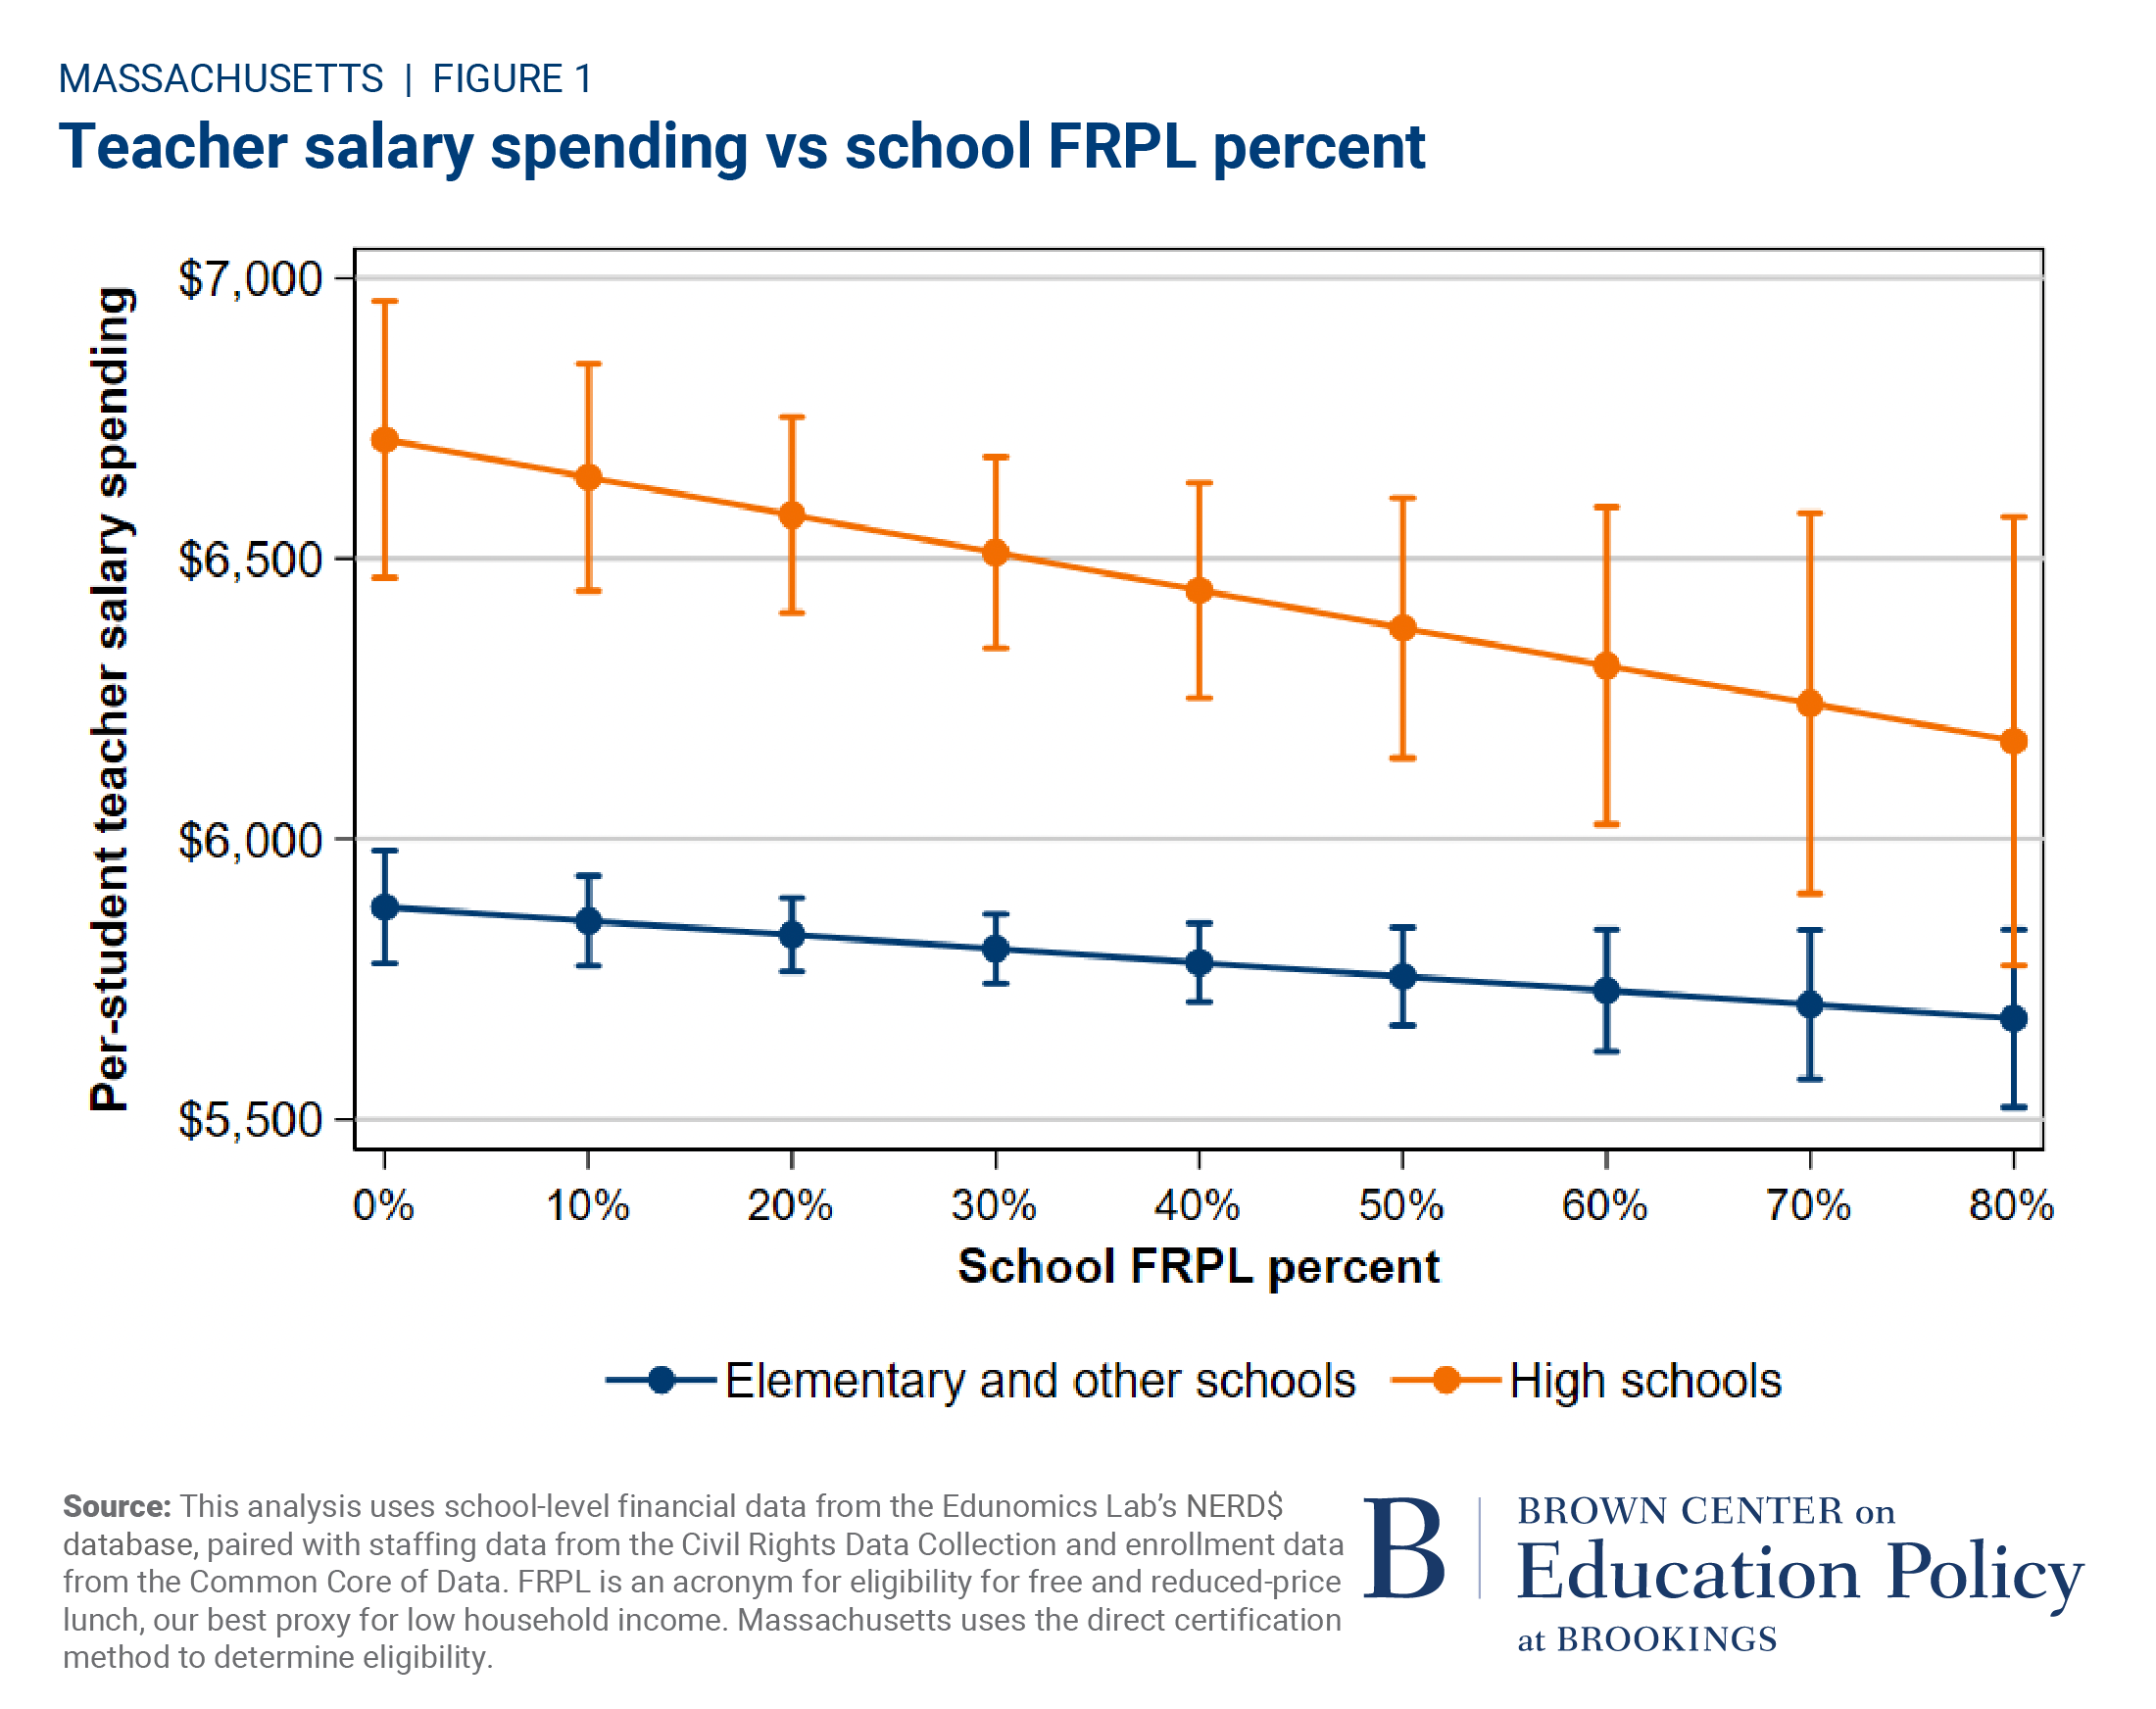
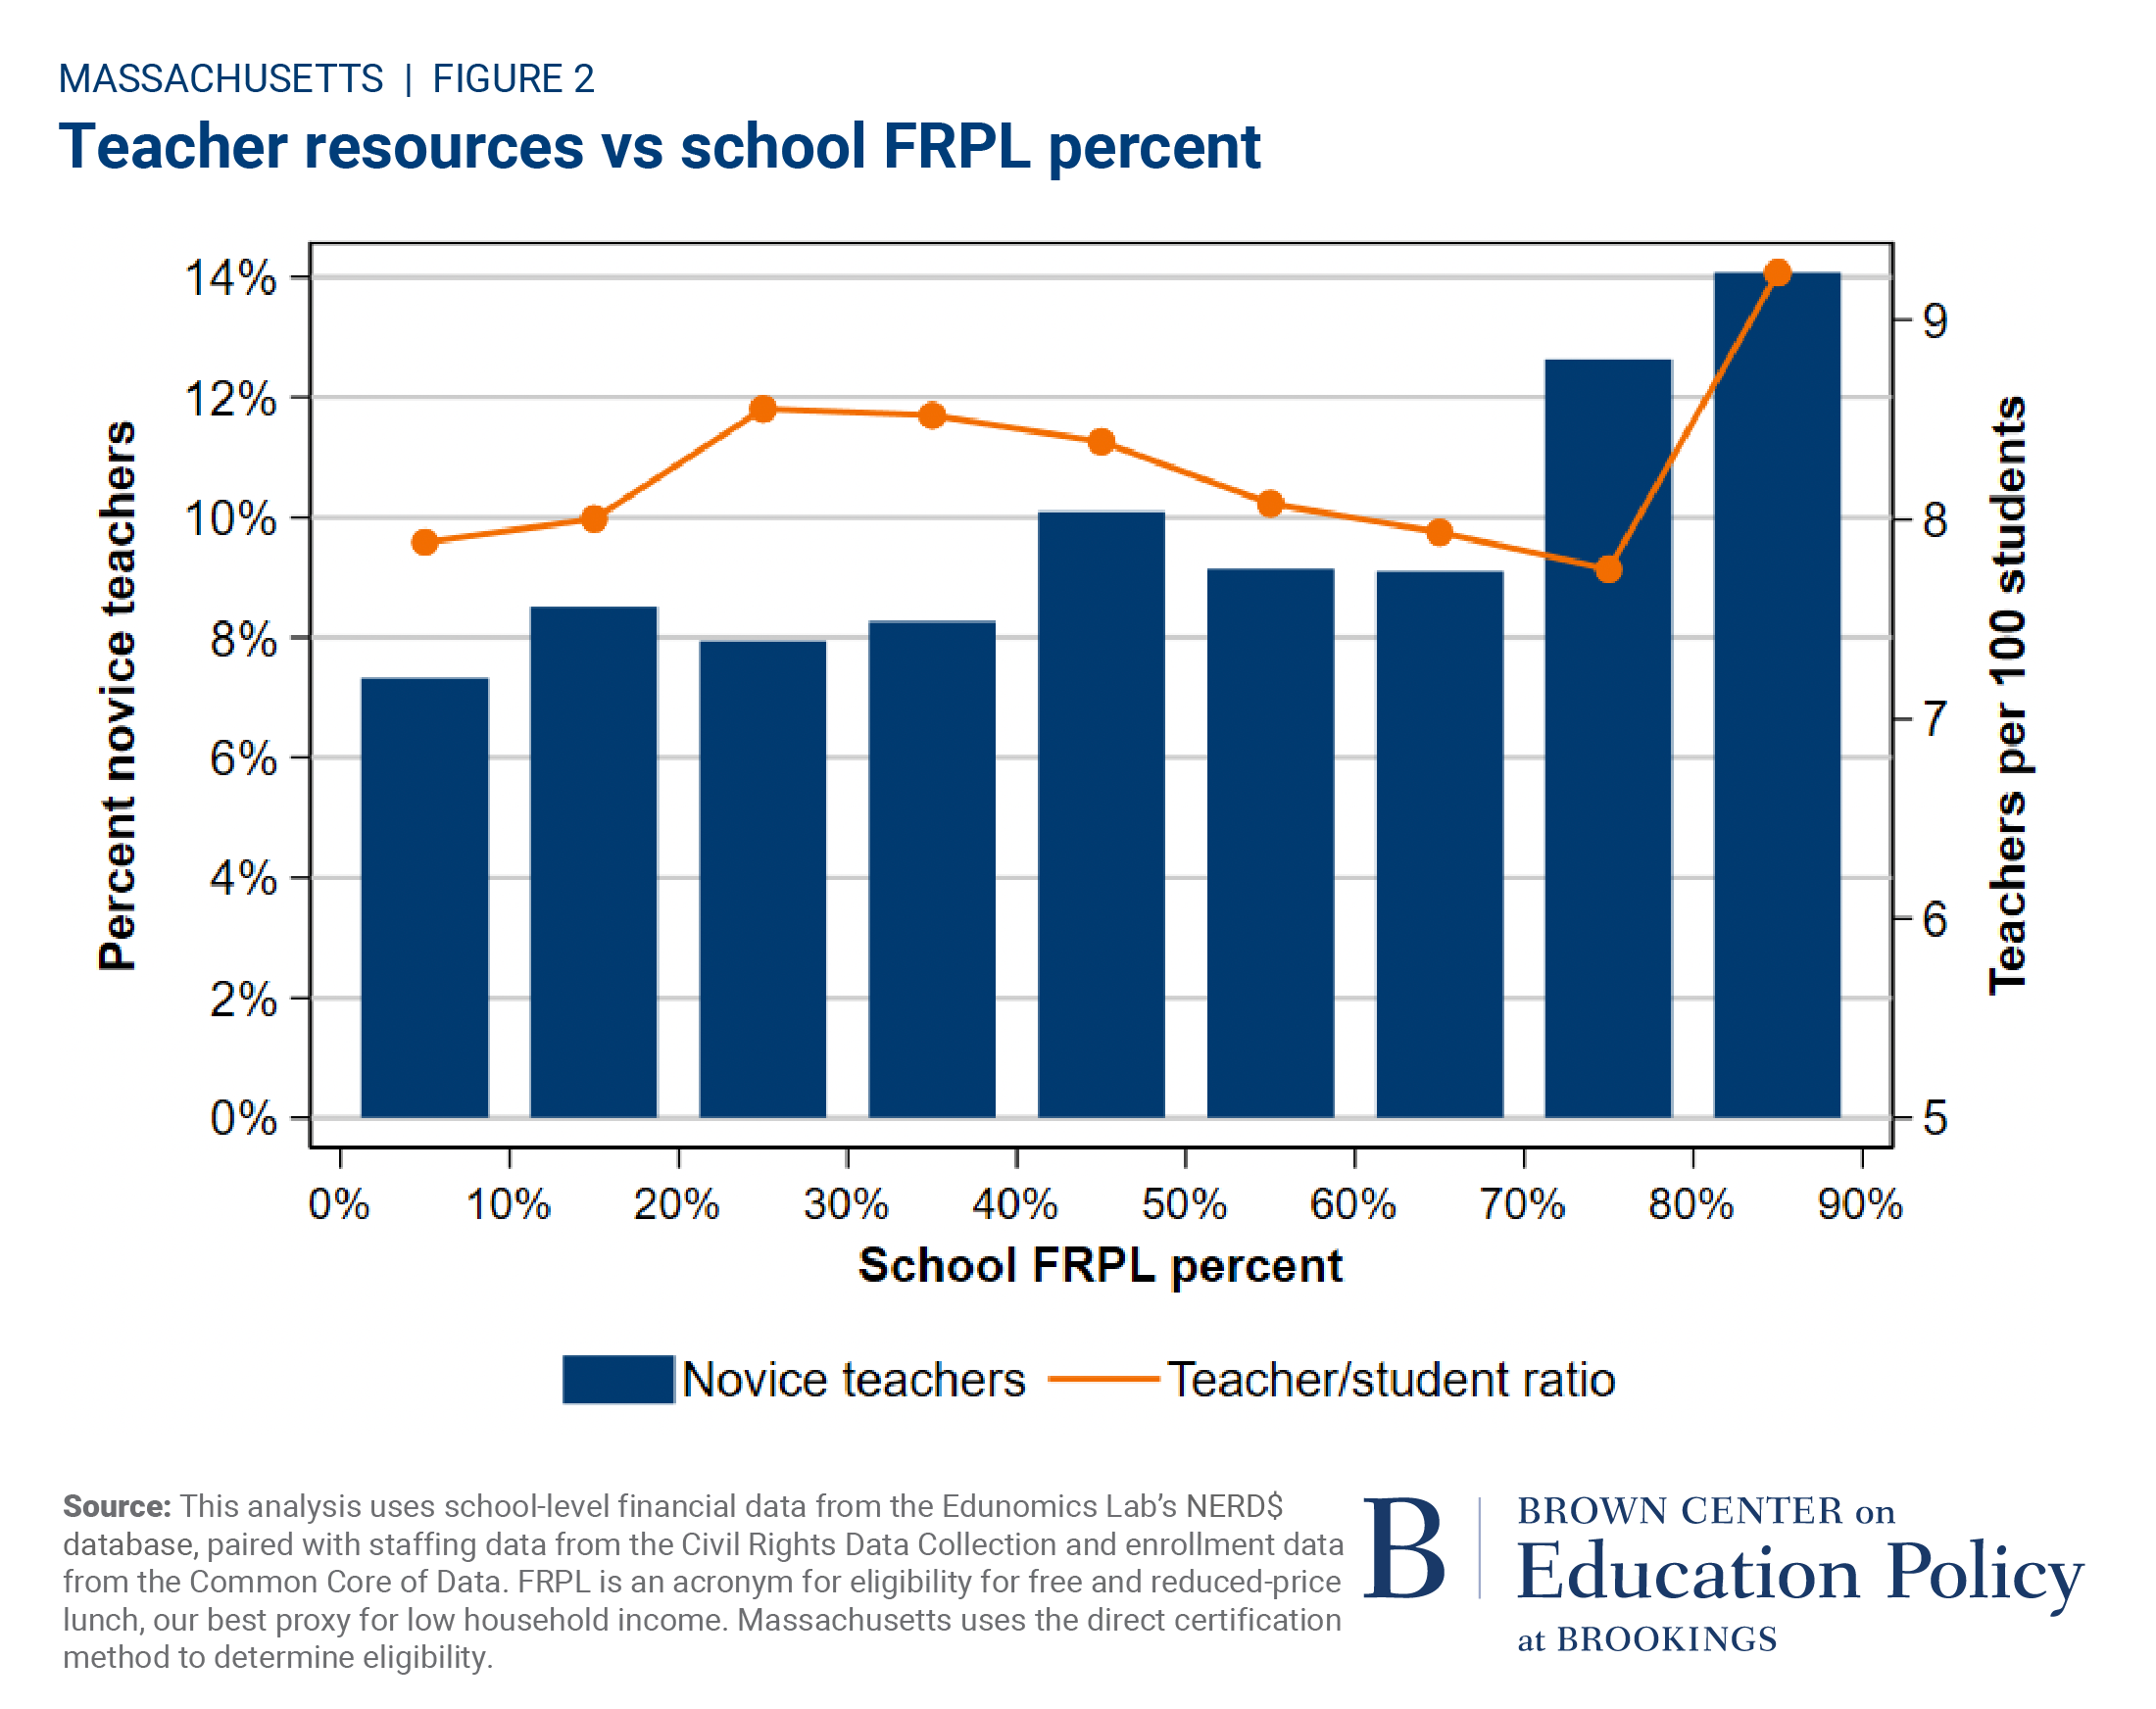
Teacher and spending allocations show greater variance looking across district boundaries. Massachusetts’ high-poverty schools receive lower amounts of teacher funding; teacher spending is higher, but more regressive in high schools (see Figure 1). High-poverty schools have higher shares of novice teachers, and similar staffing ratios (see Figure 2).
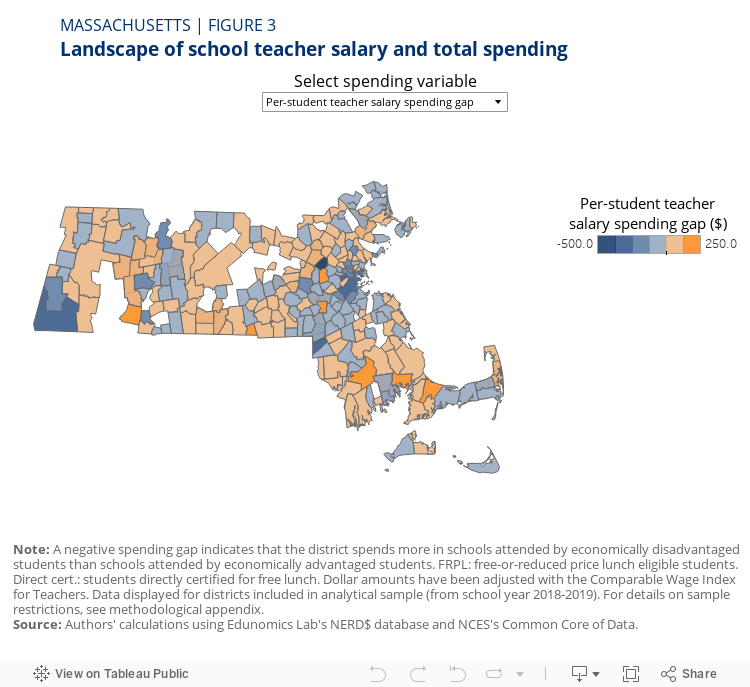
Approximately 58% of Massachusetts’ schools, serving 56% of students, are in progressive teacher spending districts (see Figure 3 for an overview of spending progressivity in Massachusetts’ districts).
Conclusion
- Massachusetts districts generally compensate FRPL students’ low access to experienced teachers with higher classroom staffing ratios; essentially quality for quantity. Yet, FRPL students should have many more teachers (smaller class sizes) to be fairly compensated for inexperienced teachers.
- Though within-district spending is slightly progressive on net in most districts, spending is slightly regressive when looking across districts overall. The state should be doing more to reallocate financial and staffing resources across districts.
Source
This analysis uses school-level financial data from the Edunomics Lab’s NERD$ database, paired with staffing data from the Civil Rights Data Collection and enrollment data from the Common Core of Data. FRPL is an acronym for eligibility for free and reduced-price lunch, our best proxy for low household income. Massachusetts uses the direct certification method to determine eligibility.
Continue reading Chapter 2: Does teacher sorting contribute to financial inequalities? →
Read the other case studies (Indiana, Louisiana, Nevada, New York, and North Carolina) →
Authors


-
Acknowledgements and disclosures
The authors thank Adelle Patten for communications support. We also acknowledge generous financial support from the Gates Foundation in enabling the Brown Center to conduct this work.
The Brookings Institution is committed to quality, independence, and impact.
We are supported by a diverse array of funders. In line with our values and policies, each Brookings publication represents the sole views of its author(s).