
The Trump administration’s stark immigration policies—designed to sharply reduce international migration and increase deportations—have impacted various aspects of our economy and society. As part of this assessment, it is important to understand how these policies have led to declines in population growth nationally as well as for individual areas. Knowing how many and which parts of the U.S. have seen substantial immigration reductions can lend insight into these areas’ future demographic and economic prospects.
A previous Brookings analysis examined then newly released Census Bureau estimates to show that reduced immigration over the year ending June 2025 nearly halved the nation’s overall population growth and notably reduced population growth in most states. This report extends that discussion with more recent Census Bureau estimates that focus on the nation’s major metro areas and urban core counties—areas that by and large have relied heavily on net international migration (referred to here as “immigration”) as a key part of their population growth.1
As with our earlier analysis of U.S. states, we find that the immigration downturn in metro areas has been widespread. Over the past year, all 56 of the nation’s major metro areas (those with populations over 1 million) saw immigration declines, and as a result, all but one showed slower population growth, a shift from growth to decline, or an even greater population decline than the previous year.
This report also explores how immigration shifts since the COVID-19 pandemic have impacted major metro areas’ growth levels in light of changing domestic migration (moves to other parts of the U.S.) and modest upticks in natural increase (the number of births minus deaths). While rising post-pandemic immigration prior to last year allowed most major metro areas to rebound from low or negative pandemic-era growth, recent immigration slowdowns appear to counter those trends. For example, metropolitan New York’s 2023-24 population gain of 291,111—the highest of all metro areas that year—fell to just 32,361 in 2024-25. Meanwhile, metropolitan Los Angeles’ 2023-24 population gain of nearly 25,000 shifted to a loss of 62,454 in 2024-25.
The final portion of this analysis focuses on highly dense urban core counties and cities within major metro areas. With few exceptions, reduced immigration has led to lower population growth or greater population declines in these places, requiring greater emphasis on slowing their loss of domestic migrants.
Overall, this analysis of the latest Census Bureau population estimates for major metro areas and urban core counties suggests that these areas need to brace for even greater demographic slowdowns—as well as further workforce and economic stagnation—if current immigration reductions continue.
All major metro areas showed immigration reductions, leading to slower population growth or declines in most
National immigration levels have shifted noticeably since the prime pandemic year of 2020-21, when immigration was severely curtailed before rising through 2023-24 as restrictions were lifted. Figure 1 shows recently revised Census Bureau estimates of net international migration, which rose from 376,000 in 2020-21 to 1.67 million, 2.26 million, and 2.73 million in the following three years. Yet in 2024-25, the number of new immigrants dropped to 1.26 million—a level likely to be considerably smaller over the next year.

As Figure 1 shows, the lion’s share of new immigrants in each of these years resided in the nation’s 56 major metro areas. In each of these years, over 75% of all the nation’s immigrant gains occurred in major metro areas, with the remaining gains occurring in smaller metro areas or non-metropolitan areas. Because major metro areas constitute only 57% of the total U.S. population, the concentration of immigrants in these areas heavily shapes the growth levels of their populations. This makes it especially noteworthy to see how the over 50% reduction in immigrants to these places—from 2.06 million in 2023-24 to 969,000 2024-25—affected individual areas.


Figure 2 displays the shift in immigrant growth over the past two years for the five major metro areas that had the largest immigrant gains in 2023-24. While metro area New York had the greatest 2023-24 immigrant gains and greatest numeric 2024-25 reduction of all metro areas in the U.S., all five areas showed substantial reductions in their immigration levels. Los Angeles and Chicago also showed 2023-24 to 2024-25 immigration reductions of more than 60%, and immigration reductions in Dallas, Houston, and Miami were 52%, 41%, and 32%, respectively.
As Map 1 depicts, all 56 major metro areas showed declines in their immigration levels between these two years of at least 30%, with 32 showing immigration reductions by 50% or more. Major metro areas in the West showed the largest reductions: Fresno, Calif., Riverside, Calif., Denver, Salt Lake City, Los Angeles, and San Diego (along with New York, Minneapolis-Saint Paul, and San Antonio) each registered 2024-25 immigration levels at least 65% lower than those for 2023-24. (See downloadable Table A.)
Because immigration is an essential demographic component of population growth in most major metro areas, the decline in new immigrants contributed to a decline in most of these areas’ population growth. Figure 3 shows this by examining growth slowdowns for the same five major metro areas in the previous figure. For example, in metro area New York (which saw a reduction of 238,529 immigrants across the previous two years), population growth dropped from 291,111 to just 32,361.
Lower immigration was responsible for most major metro areas’ reduced population growth; the remainder was mostly due to greater domestic out-migration in the latter year. In each of the other four major metro areas shown, population gains were reduced or (in the case of Miami and Los Angeles) became negative, either totally or in large part due to lower immigration.

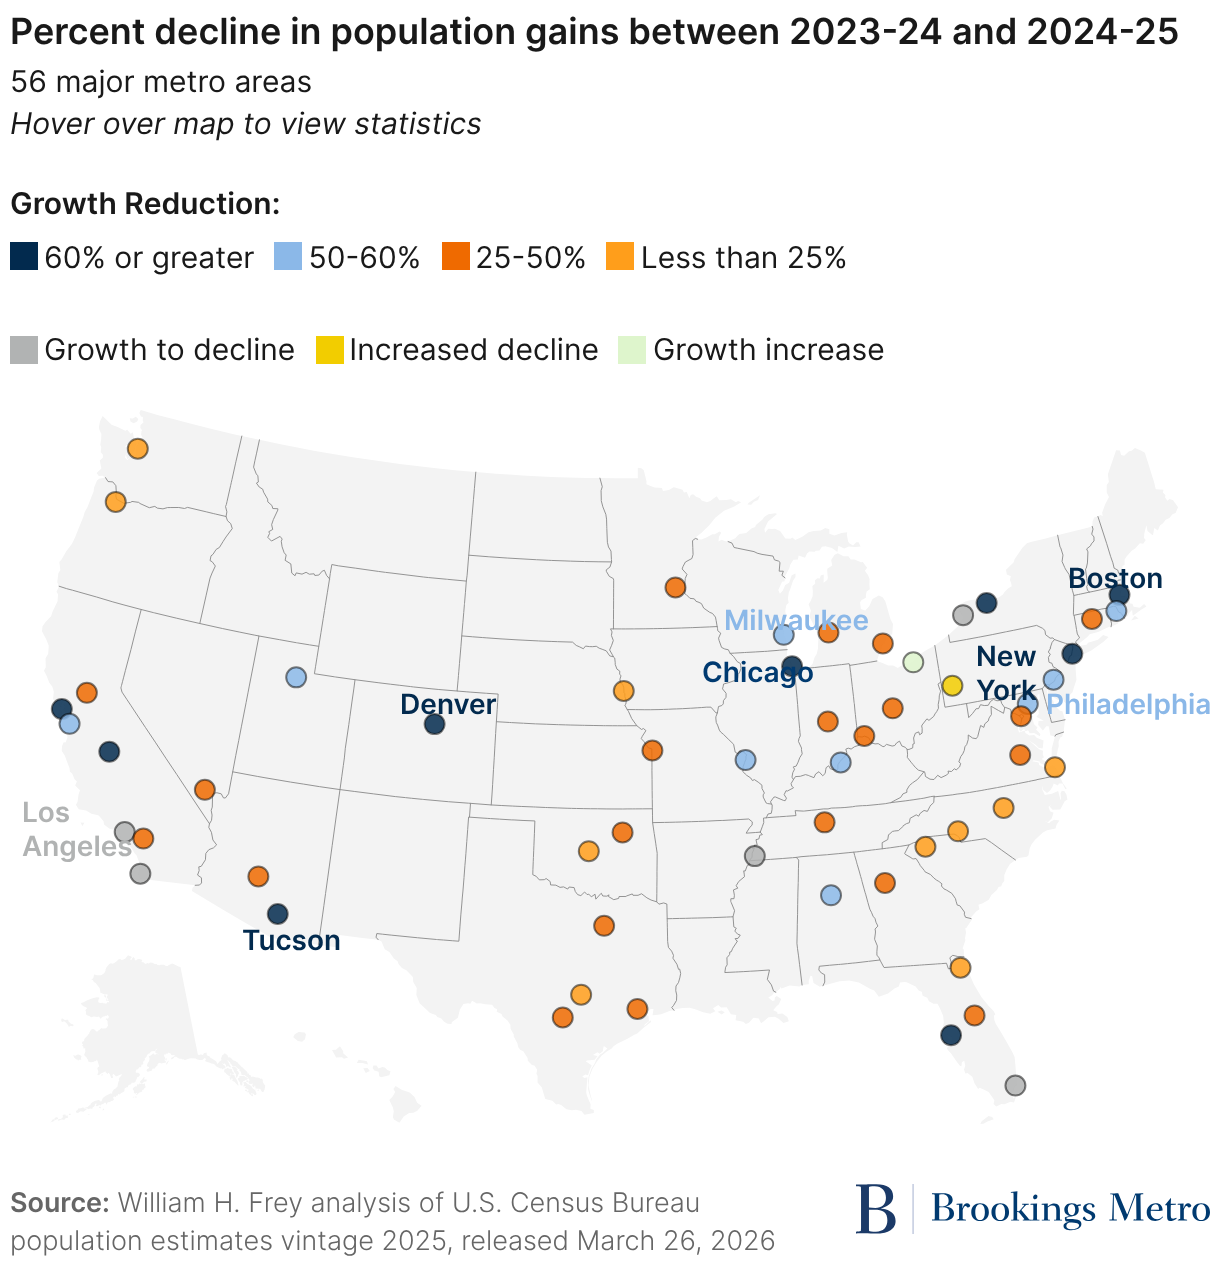
Map 2 depicts how each major metro area’s population change compares between 2023-24 and 2024-25. In all except one, there were smaller population gains in 2024-25 (49 metro areas), shifts from gains to declines (five metro areas: Los Angeles, Miami, San Diego, Memphis, Tenn., and Buffalo, N.Y.), or greater declines than in 2023-24 (Pittsburgh). The one exception is the Cleveland metro area, which gained a modestly larger number of residents in 2024-25 than it did in 2023-24.
Among those with smaller population growth, the biggest shifts occurred in New York, Tucson, Ariz., Denver, Boston, San Francisco, and Chicago—each with at least 70% less growth in 2024-25 than the previous year. As a result of its large numeric reduction, New York, which ranked as the highest-population-gaining metro area in 2023-24, sunk to 13th in 2024-25.
A relevant question is how much reduced immigration contributed to the decreased population growth or the new or increased declines registered for almost all major metro areas between 2023-24 and 2024-25. Our calculations show that in 31 of these areas, the reduction in immigration accounted for all of lower population growth or greater decline; in another 22, it accounted well over half of the those shifts. (See downloadable Table A, right-most column.)
Among the former group of metro areas are Chicago, San Francisco, Salt Lake City, Philadelphia, St. Louis, and Milwaukee. In each of these and others, 2024-25 population growth would have been the same or higher than 2023-24 if it were not for the recent decline in immigration.
Major metro areas saw post-pandemic population rebounds, then falloffs associated with migration shifts
Thus far, this report has focused primarily on how major metropolitan area population growth reacted to the recent immigration falloff, making plain how important immigration has been in population growth for most of these metro areas. Yet it is useful to also examine how immigration has impacted these areas since the prime pandemic year of 2020-21, when international immigration reached an even lower level and domestic migration within the U.S. shifted noticeably in ways that impacted many areas even more than immigration.
This was also a time of more deaths and fewer births, leaving natural increase (the excess of births over deaths) at lower levels than in prior years and exerting a downward pressure on population growth. Together, these factors provide some demographic context for understanding how future shifts in immigration can impact major metro areas.


An overview of these patterns can be seen in Figures 4 and 5, which display the growth of the nation’s aggregate major metro area population and the three demographic components of change (immigration, domestic migration, and natural increase) for the period just prior to and since the pandemic. Figure 4 shows that these areas, as a group, sustained a population loss over the 2020-21 prime pandemic year—a unique phenomenon in recent decades. Figure 5 shows that while all three demographic components of change contributed to this shift, domestic migration out of these areas and the drop in natural increase were more responsible for this population loss than reduced immigration.
However, in the three subsequent years (2021-22 through 2023-24), the rise in immigration played a strong role in major metro areas’ population rebound, complemented by smaller domestic out-migration and greater natural increase. This forms the backdrop of looking at the most recent year’s immigration decline, which was the primary reason for lower population growth in most major metro areas.
Not all major metro areas sustained population declines in the prime pandemic year, but those that did tended to be located in nation’s Midwest and coastal regions, which suffered from reduced immigration and accentuated domestic out-migration during that period. On the other hand, many metro areas located in the Sun Belt and Mountain West regions showed sharp population gains during and immediately after the prime pandemic year, often including domestic in-migration flows from metro areas in population-losing regions. (See downloadable Table B.)

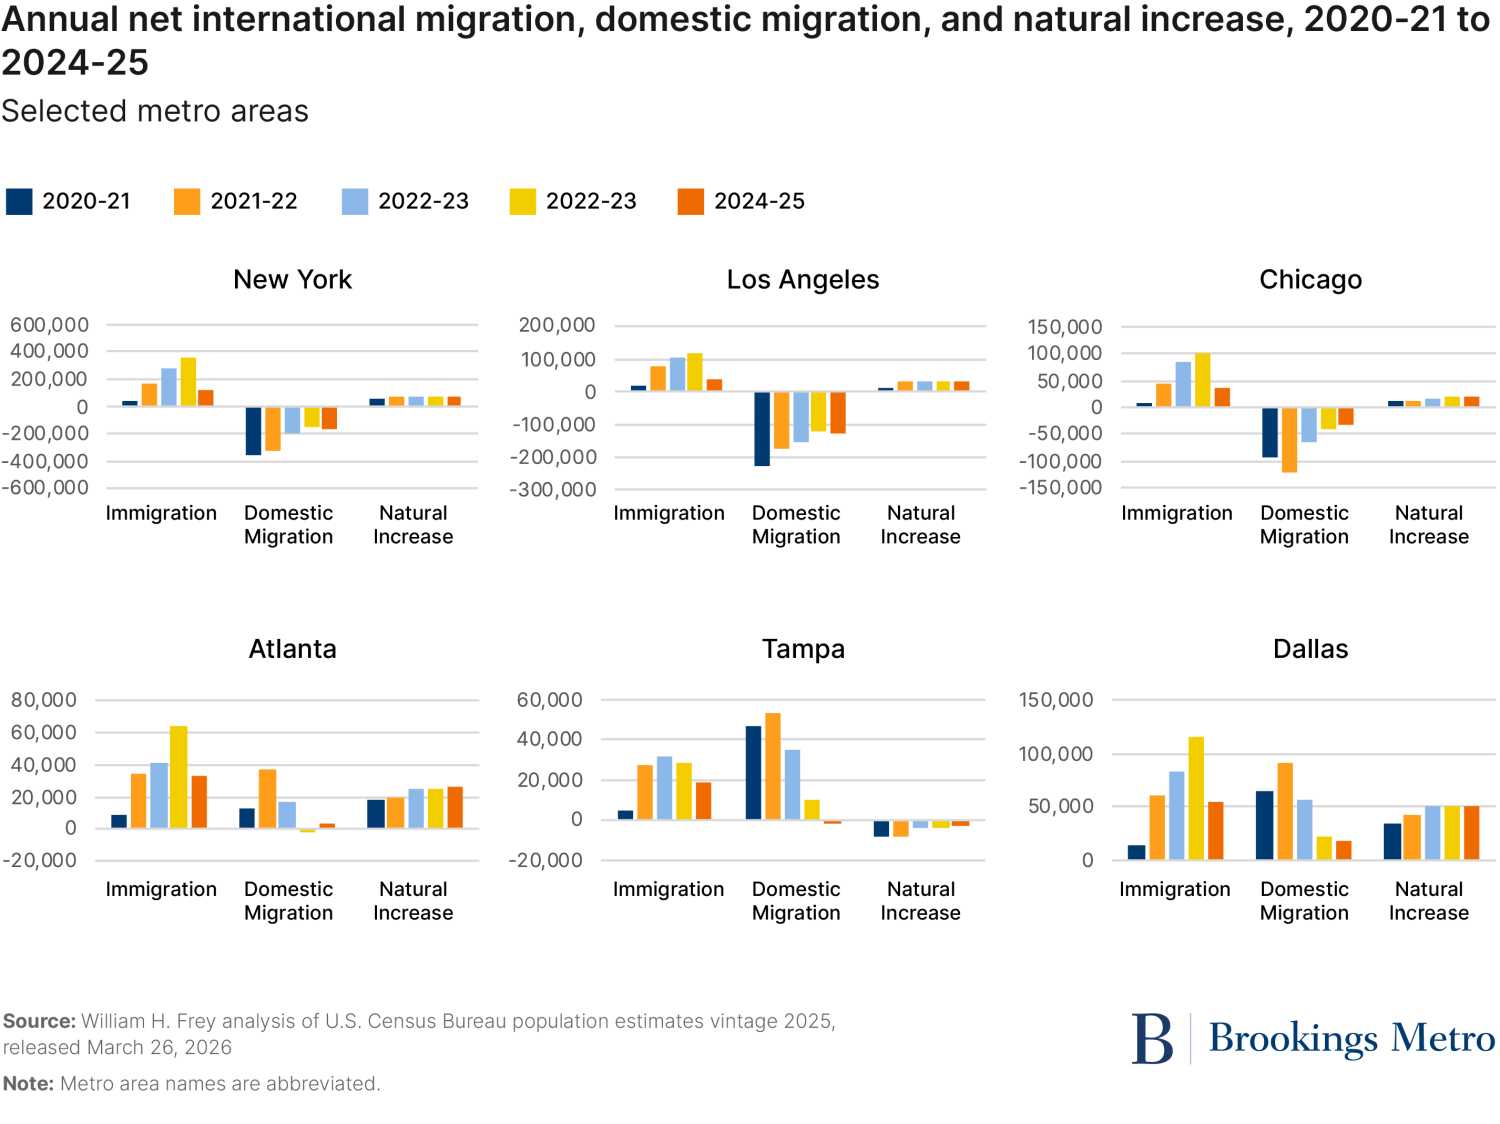
Figure 6 depicts annual growth rate patterns during prime and post-pandemic years for the coastal metro areas of New York and Los Angeles, Chicago in the Midwest, and three metro areas in the South: Atlanta, Tampa, Fla., and Dallas. The first three metro areas showed population declines in 2020-21 and 2021-22 (and 2022-23 for Los Angeles), followed by gains that achieved their highest levels in 2023-24 (before falling in 2024-25). The three Southern metro areas registered gains in all five years, but their largest gains were in 2021-22, and stayed positive before registering a growth slowdown in 2024-25.
What lies beneath these different regional patterns are shifts in domestic migration. During the pandemic-era years 2020-21 and 2021-22, many coastal and Midwest metro areas reached peak levels of domestic out-migration, as many instituted strict shutdowns of offices and public transportation, and telework became more common. In these two years, 24 and 17 major metro areas, respectively, registered population losses, with many of them experiencing accentuated domestic out-migration.
At the same time, many Southern areas became destinations for increased domestic in-migration. This is shown for the six areas in Figure 7, with New York, Los Angeles, and Chicago registering their greatest domestic out-migration in 2020-21 and 2021-22, only to ease up later. At the same time, domestic in-migration to each of the three Southern metro areas was greatest in at least one of those two years.

Map 3 shows this shift in domestic migration between the two-year pandemic period from 2020 to 2022 and the more recent period from 2023 to 2025. Major metro areas are classed by their domestic migration gains and losses in both periods and the extent to which those patterns shifted. Most major metro areas that gained migrants in both periods (18 of 20), located largely in the Sun Belt, gained fewer migrants from 2023 to 2025 than they did from 2020 to 2022, and most major metro areas that lost migrants in both periods (19 of 27), located mostly on the coasts, the Northeast, and the Midwest, lost fewer migrants from 2023 to 2025 than they did from 2020 to 2022. In addition, seven major metro areas, mostly in the Midwest, shifted from domestic migration losses to gains, and two (Orlando, Fla., and Hartford, Conn.) flipped from gains to losses. Moreover, although natural increase has risen from its nadir in the post-pandemic period, it has remained relatively stable for most metro areas over the past three years. (See downloadable Tables B and C.)
These patterns place a greater emphasis on immigration as a means of countering domestic out-migration in slow-growing metro areas on the coasts and in America’s heartland, and for making up for lower domestic in-migration in many Sun Belt metro areas. Rising immigration had much to do with the post-pandemic population growth rebound in most major metro areas, especially in 2023-24, when immigration increased in 45 of these areas and population gains rose in 40.
Immigration’s impact on urban core areas
If there is one part of a major metro area where immigration has an especially important impact, it is in their urban core counties. The newly released Census Bureau data permit such an assessment for select urban core counties as well as those that correspond to city boundaries.2

Figure 8 displays annual growth rates since the beginning of the pandemic for six selected urban core areas: New York City; Cook County, Ill. (containing Chicago); Wayne County, Mich. (containing Detroit); Philadelphia; Washington, D.C.; and Dallas County (containing most of the city of Dallas). Each of these areas showed negative growth in 2020-21, with several exhibiting continued declines in the subsequent year or two. This prime pandemic year decline was fairly pervasive across large urban counties, as the pandemic spurred movement to the suburbs and other metro areas. Yet in each of these areas, as in most others, these declines eased up or switched to growth by 2023-24, only to fall or turn negative in 2024-25. (See downloadable Table D showing trends among 38 select urban core areas.)
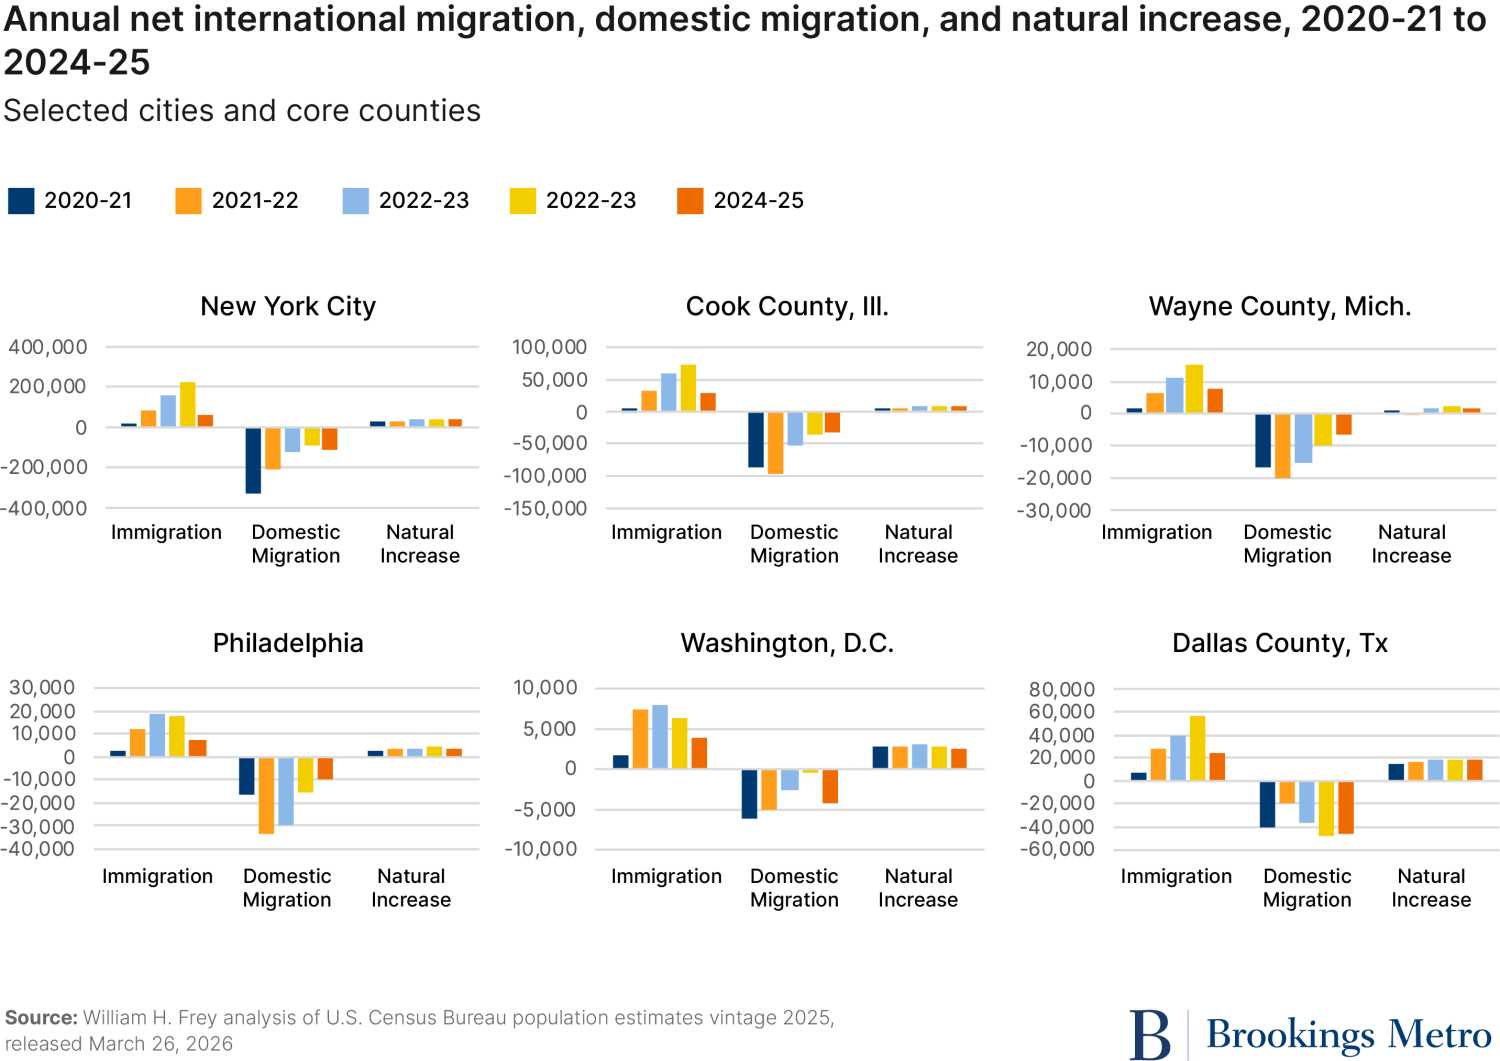
An examination of the demographic components underlying changes in each of these areas shows that, in general, shifts in domestic out-migration and immigration were primarily responsible for population pattern shifts. That is, for most urban core areas, domestic out-migration was largest during the pandemic years 2020-21 and 2021-22, as shown in Figure 9 for New York City, Cook County, Wayne County, Philadelphia, and Washington, D.C., as well as many others. (See downloadable Table E for 38 urban core areas.)
A large number of these areas showed smaller out-migration in later years as pandemic-driven migration to the suburbs and other areas subsided—although there are some exceptions, such as Dallas County and some Sun Belt core county areas where domestic in-migration fell off. (Also Washington, D.C., where federal government downsizing may have spurred further out-migration.) However, the later population gains through 2023-24, shown for most core areas, were also reliant on increases in immigration, which led to positive 2023-24 growth in cities such as New York and Philadelphia along with many other urban core counties, which experienced lower but still negative domestic out-migration.
This made the decline in immigration between 2023-24 and 2024-25 especially significant for urban core areas that relied on immigration for its post-pandemic gains. New York City’s population growth again became negative, with Cook County, Wayne County, and Philadelphia registering noticeable growth slowdowns. Among 38 selected urban core counties of major metro areas, 33 performed worse demographically in 2024-25 than in 2023-24. Of those, 21 showed smaller gains, 11 flipped from gains to losses, and one showed greater population declines. (See downloadable Table D.) A notable exception was the city of San Francisco, which registered a small population gain in 2024-25 despite sustaining a decline in immigration; this was due to a sharp reduction in domestic out-migration.
What will lower immigration mean for urban America?
This analysis shows how in just one year, reduced immigration has brought a pervasive population growth slowdown in the nation’s major metro areas and urban core counties, lowering the growth or increasing the decline in nearly all of them. In addition to this impact on the 56 major metro areas examined here (which received the bulk of the nation’s immigrants), immigration also declined in each of the nation’s 331 smaller metropolitan areas and most of the nation’s counties. In fact, among the 1,492 mostly urban counties that gained 50 or more immigrants in 2023-24, all but one of them showed lower immigration in 2024-25.

These immigration declines are largely the result of Trump administration policies that served to sharply reduce immigration contributions in a variety of ways through lowering international in-movement in legal programs, including instituting travel bans, cutting refugee resettlements, and restricting H-1B visas, along with aggressively implementing border restrictions and deportation measures.
What happened last year may represent the “tip of the iceberg” of what could occur to these areas if prolonged and greater immigration reductions occur through increased deportations and more restrictions on international migration in-movement. The period examined here surely understates what is occurring right now, since these new Census Bureau estimates ended with the 12-month period through June 2025, showing a net international migration of 1.26 million people (down from 2.73 million the previous year). The Census Bureau itself has projected that immigration could be reduced to just 321,00 people for the 12-month period ending June 2026. Other immigration projections by the Congressional Budget Office and Brookings Institution project similarly low or negative immigration for calendar year 2026. If this continues well into the future, it not only means low and eventually negative U.S. population growth overall as our aging population results in more deaths and fewer births, but it also could lead to a decline in the nation’s labor-force-age population in the next decade.
The impact of these projected demographic shifts would be especially harmful for major urban areas and their cities given their dependence on immigration for population and workforce growth. The 2026 Brookings Metro Monitor shows that between 2014 and 2024, metro areas with larger increases in the foreign-born share of their working-age population saw stronger growth in gross metropolitan product, employment, and other economic metrics. Because major metropolitan areas in all parts of the country will become increasingly dependent on immigration, the prospect of a continued decline in this important source of demographic and economic growth should be cause for concern.
Author

-
Footnotes
- The new Census Bureau estimates for counties and metropolitan areas, released March 26, 2026, for the period 2020 to 2025, are known as “vintage 2025 estimates” and should be used in place of earlier estimates for this period. These new estimates introduce changes in methodology, especially regarding international migration in the last two years to take account of changes in the sizes of in- and out-movement of international migrants using various government sources and other surveys. See a discussion of the full methodology here. For specific aspects of estimating immigration, see “New Population Estimates Show Historic Decline in Net International Migration” (Washington, D.C: U.S. Census Bureau) January 27, 2026.
- The recent Census Bureau release includes metropolitan areas and counties, but not all cities. However, several counties are coincident with city boundaries, including Philadelphia County, Denver County, and San Francisco County. New York City is the sum of Bronx, Kings, New York, Queens, and Richmond counties. Other cities, including Baltimore, St. Louis, and Washington, D.C., are known as “county equivalents” and were also part of this release. Downloadable Tables D and E present statistics for 38 of these areas that are located within major metro areas and classed as urban core counties using a typology developed by Brookings Metro.
The Brookings Institution is committed to quality, independence, and impact.
We are supported by a diverse array of funders. In line with our values and policies, each Brookings publication represents the sole views of its author(s).


